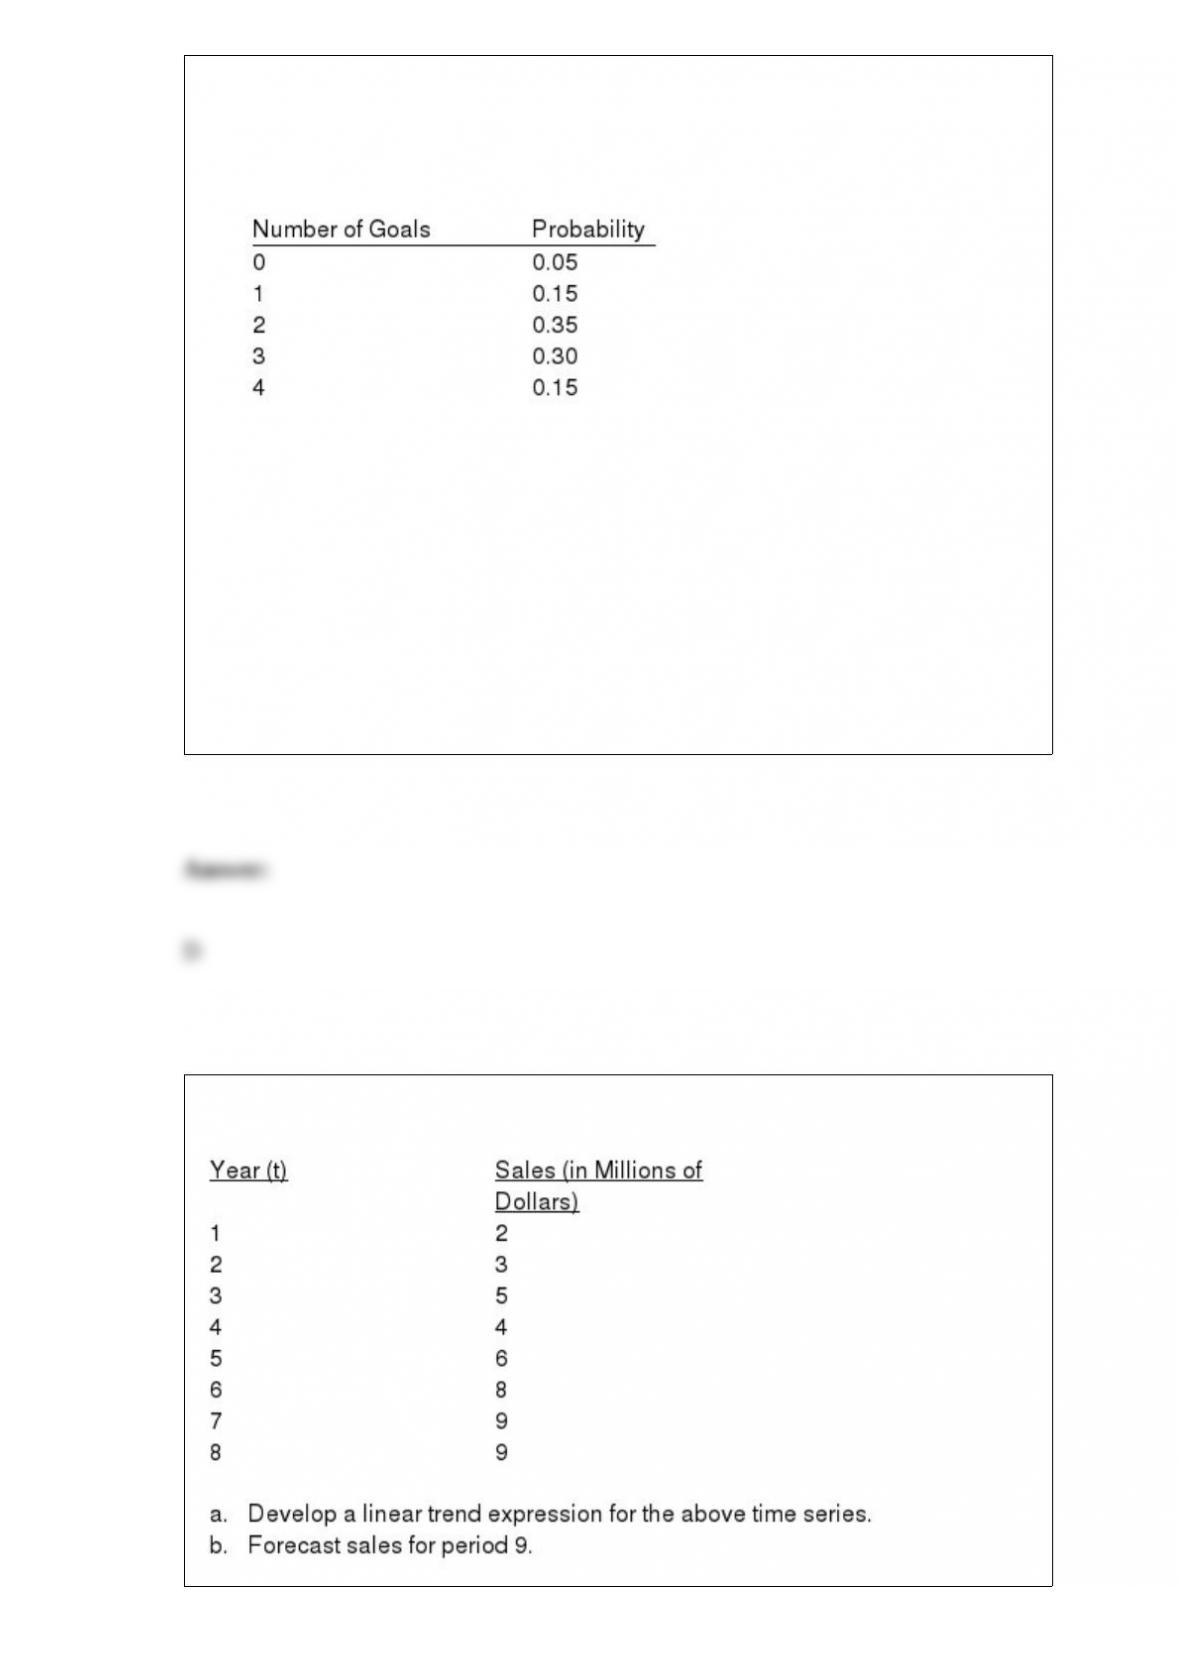
Exhibit 5-3
The probability distribution for the number of goals the Lions soccer team makes per
game is given below.
Refer to Exhibit 5-3. What is the probability that in a given game the Lions will score at
least 1 goal?
a. 0.20
b. 0.55
c. 1.0
d. 0.95
The sales volumes of CMM, Inc., a computer firm, for the past 8 years is given below.

Cluster sampling is
a. a nonprobability sampling method
b. the same as convenience sampling
c. a probability sampling method
d. None of the alternative answers is correct.
The set of all elements of interest in a study is
a. set notation
b. a set of interest
c. a sample
d. a population
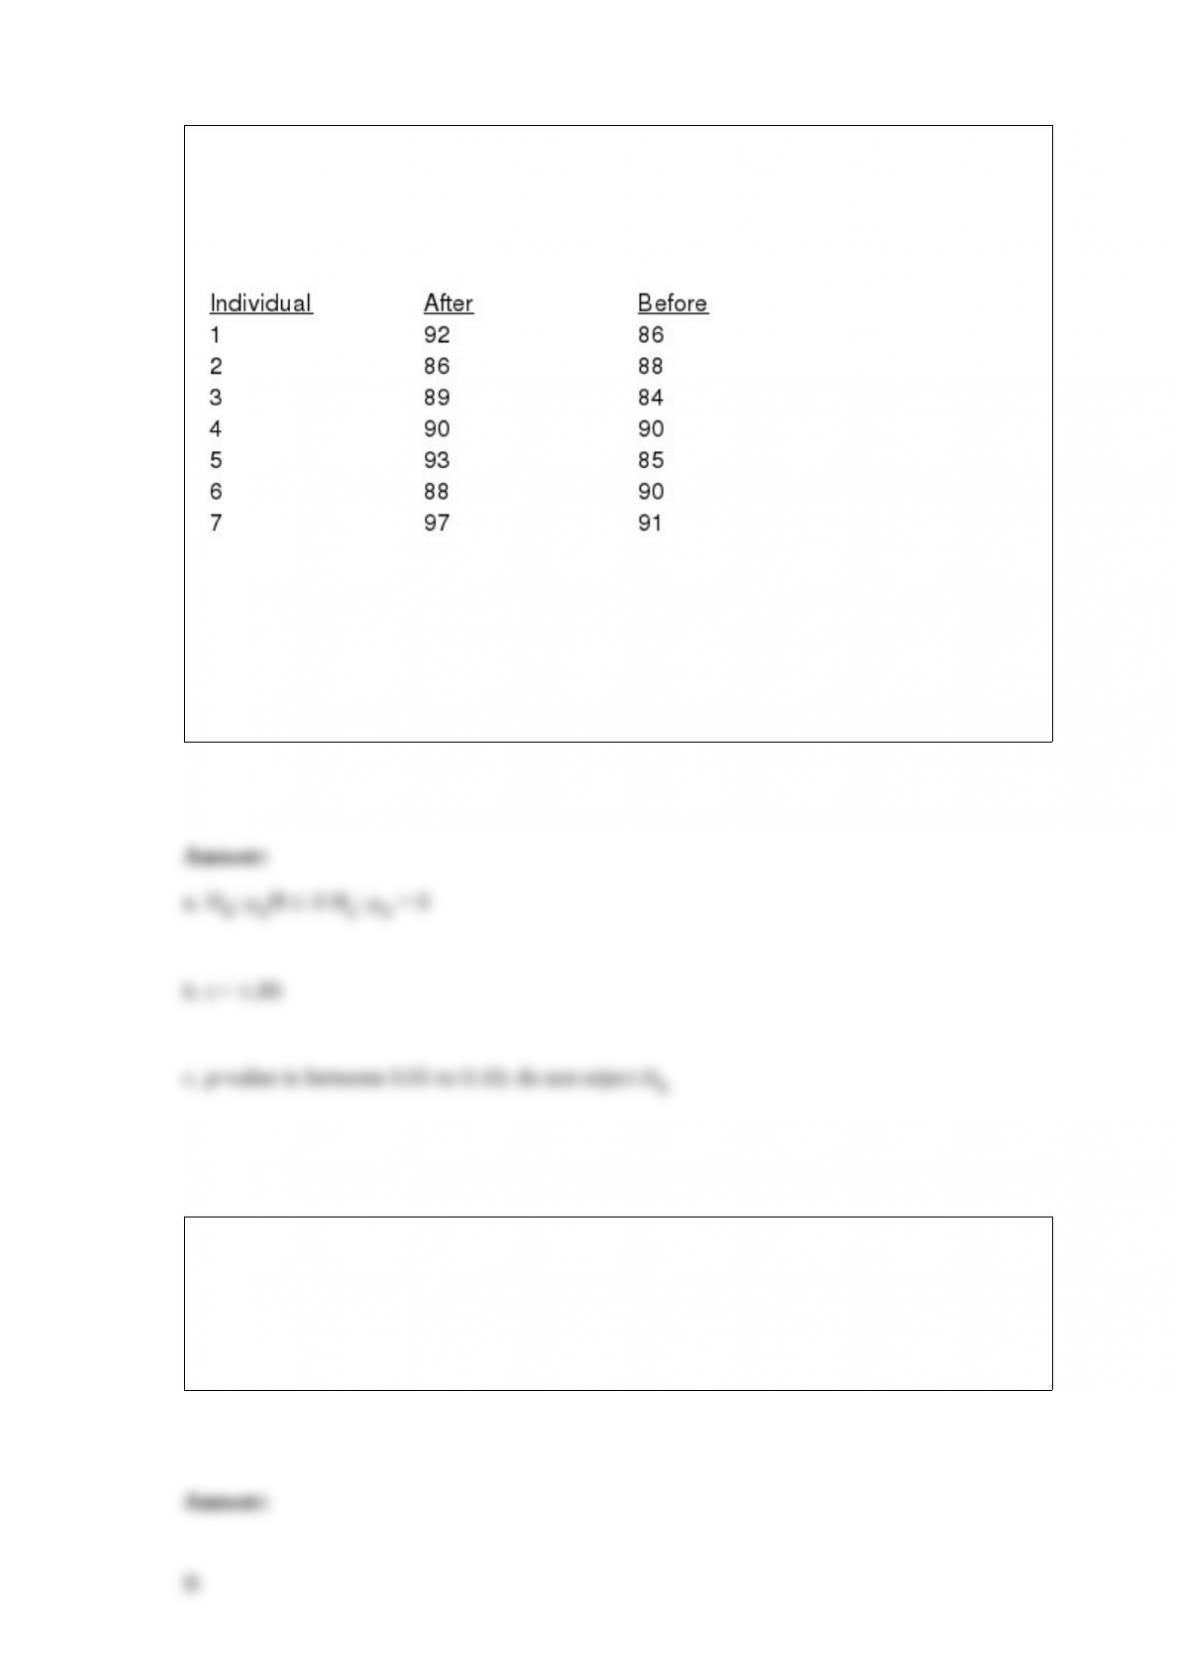
A test on world history was given to a group of individuals before and also after a film
on the history of the world was presented. The results are given below. We want to
determine if the film significantly increased the test scores. (For the following matched
samples, let the difference “d” be d = after – before.)
a. Give the hypotheses for this problem.
b. Compute the test statistic.
c. At 95% confidence, test the hypotheses.
Which of the following graphical methods is most appropriate for categorical data?
a. ogive
b. pie chart
c. histogram
d. scatter diagram

If A and B are independent events with P(A) = .1 and P(B) = .4, then
a. P(A B) = 0
b. P(A B) = .04
c. P(A B) = .5
d. P(A B) = .25
All of the following distributions are symmetric except
a. uniform
b. normal
c. exponential
d. standard normal
A population of 1,000 students spends an average of $50 a day on dinner. The standard
deviation of the expenditure is $3. A simple random sample of 64 students is taken.
a. What are the expected value, standard deviation, and shape of the sampling
distribution of the sample mean?
b. What is the probability that these 64 students will spend a combined total of more

than $715.21?
c. What is the probability that these 64 students will spend a combined total between
$703.59 and $728.45?
Z is a standard normal random variable. The P(1.41 z 2.85) equals
a. 0.4772
b. 0.3413
c. 0.8285
d. None of the alternative answers is correct.
A statistics professor asked students in a class their ages. On the basis of this
information, the professor states that the average age of all the students in the university
is 21 years. This is an example of
a. a census
b. descriptive statistics
c. an experiment
d. statistical inference

In ANOVA, which of the following is not affected by whether or not the population
means are equal?
a.
b. between-samples estimate of 2
c. within-samples estimate of 2
d. None of these alternatives is correct.
The term exponential smoothing comes from
a. its emphasis on minimizing mean squared error
b. the exponential nature of the weighting scheme used
c. its use in fitting exponential trend lines
d. the nonlinear noise it attempts to remove
The sample statistic s is the point estimator of
a.

b.
c.
d.
Which of the following is an improper form of the null and alternative hypotheses?
a. and
b. and
c. and
d. and
Read the z statistics from the normal distribution table and circle the correct answer. A
two-tailed test at a .0694 level of significance; z
a. -1.96 and 1.96
b. -1.48 and 1.48
c. -1.09 and 1.09
d. -0.86 and 0.86
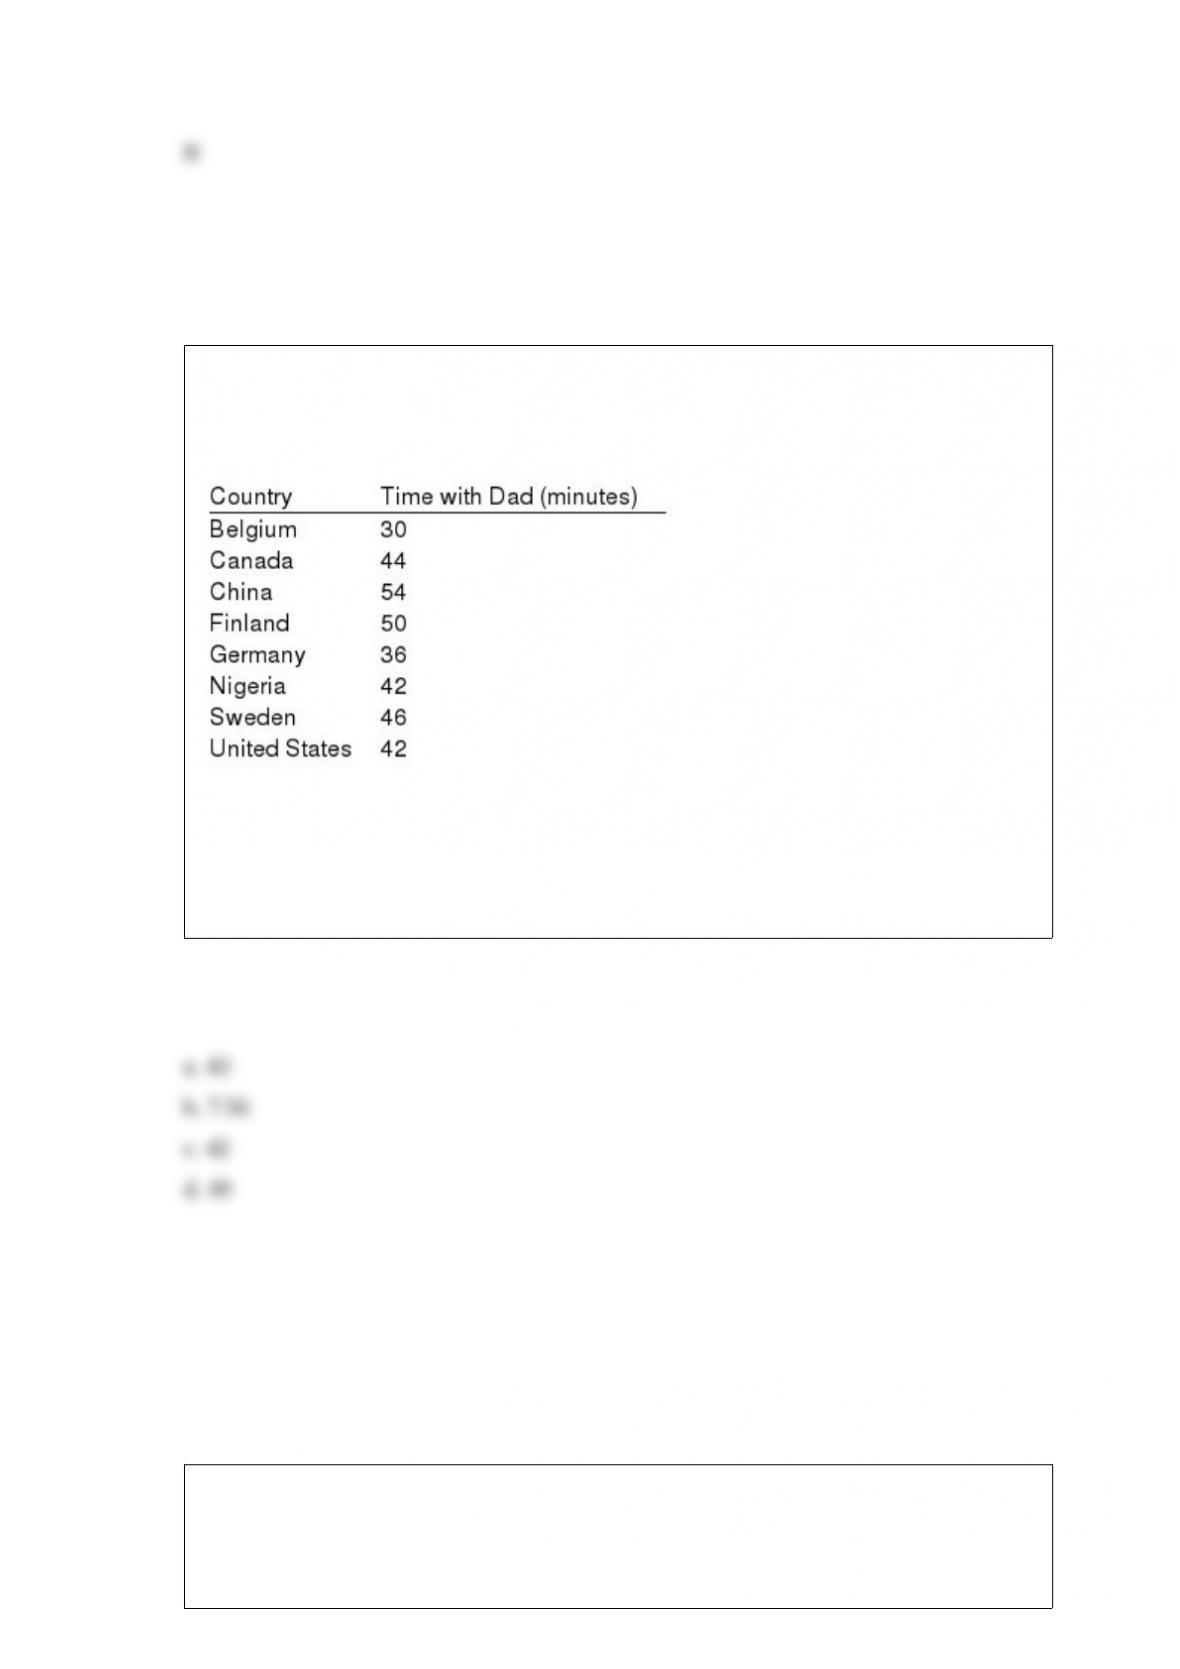
A private research organization studying families in various countries reported the
following data for the amount of time 4-year old children spent alone with their fathers
each day.
For the above sample, determine the following measures:
a. The mean
b. The standard deviation
c. The mode
d. The 75th percentile
A control chart used when the output of a process is measured in terms of the mean
value of a variable such as a length, weight, temperature, and so on is
a. a p chart

b. an x-bar chart
c. an R chart
d. an np chart
A list of the sampling units for a study is called a
a. frame
b. cluster
c. stratum
d. population
In the linear trend equation, Tt = b0 + b1t b1 represents the
a. trend value in period t
b. intercept of the trend line
c. slope of the trend line
d. point in time
If the data distribution is symmetric, the skewness is
a. 0
b. .5
c. 1
d. None of the other answers is correct.
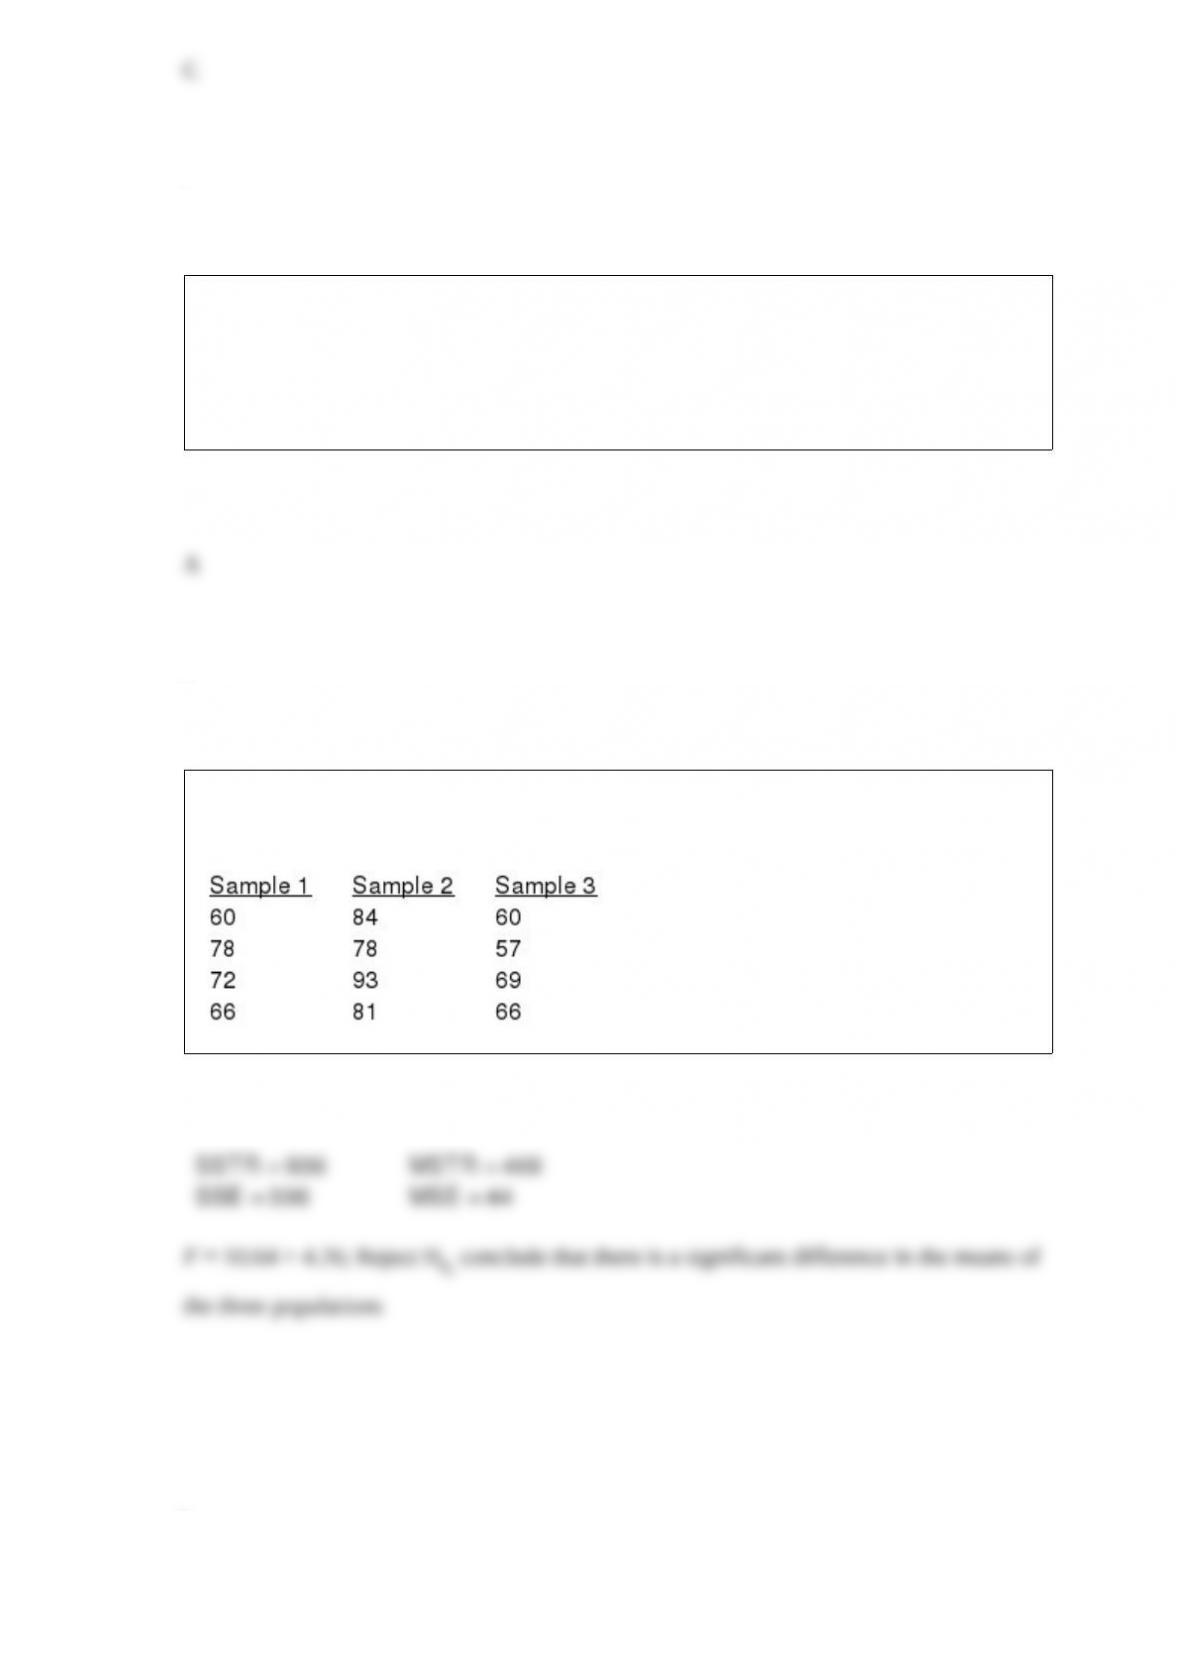
At = 0.05, test to determine if the means of the three populations (from which the
following samples are selected) are equal.
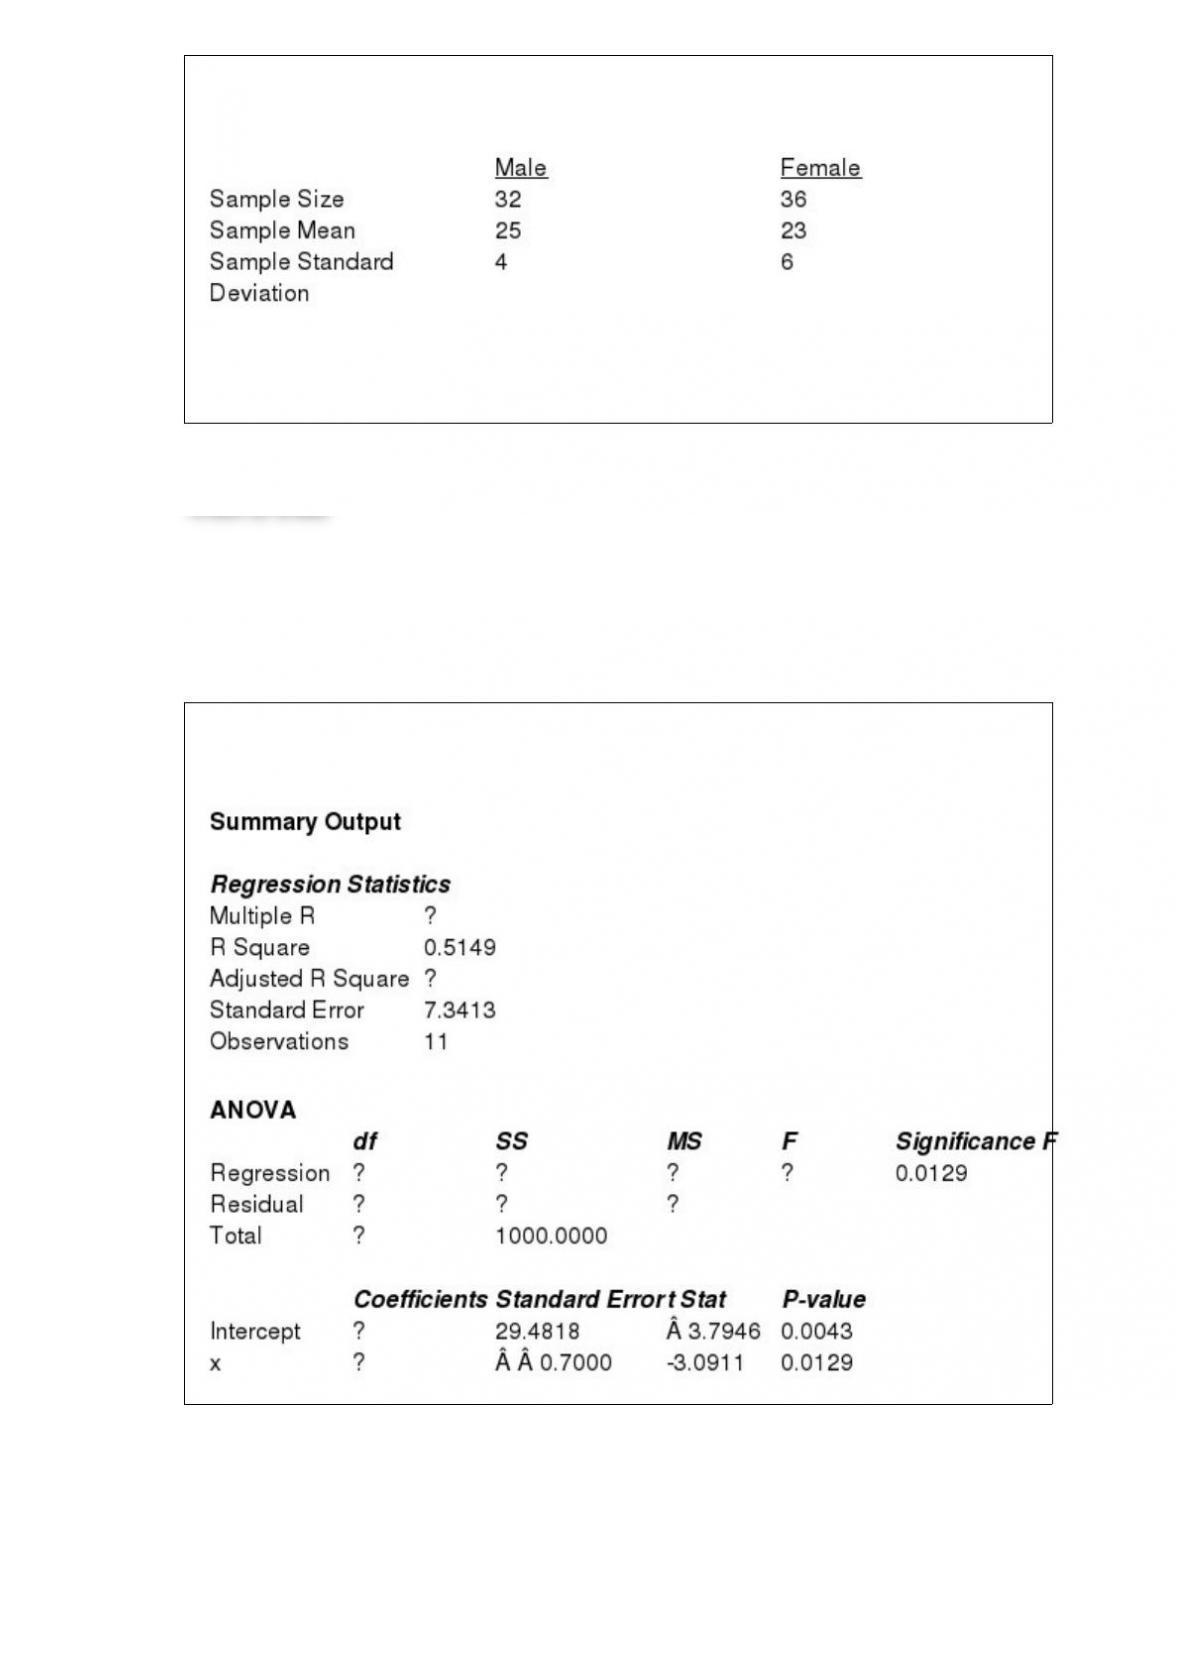
In order to estimate the difference between the average age of male and female
employees at the Young Corporation, the following information was gathered.
Develop a 95% confidence interval estimate for the difference between the average age
of male and female employees at the Young Corporation.
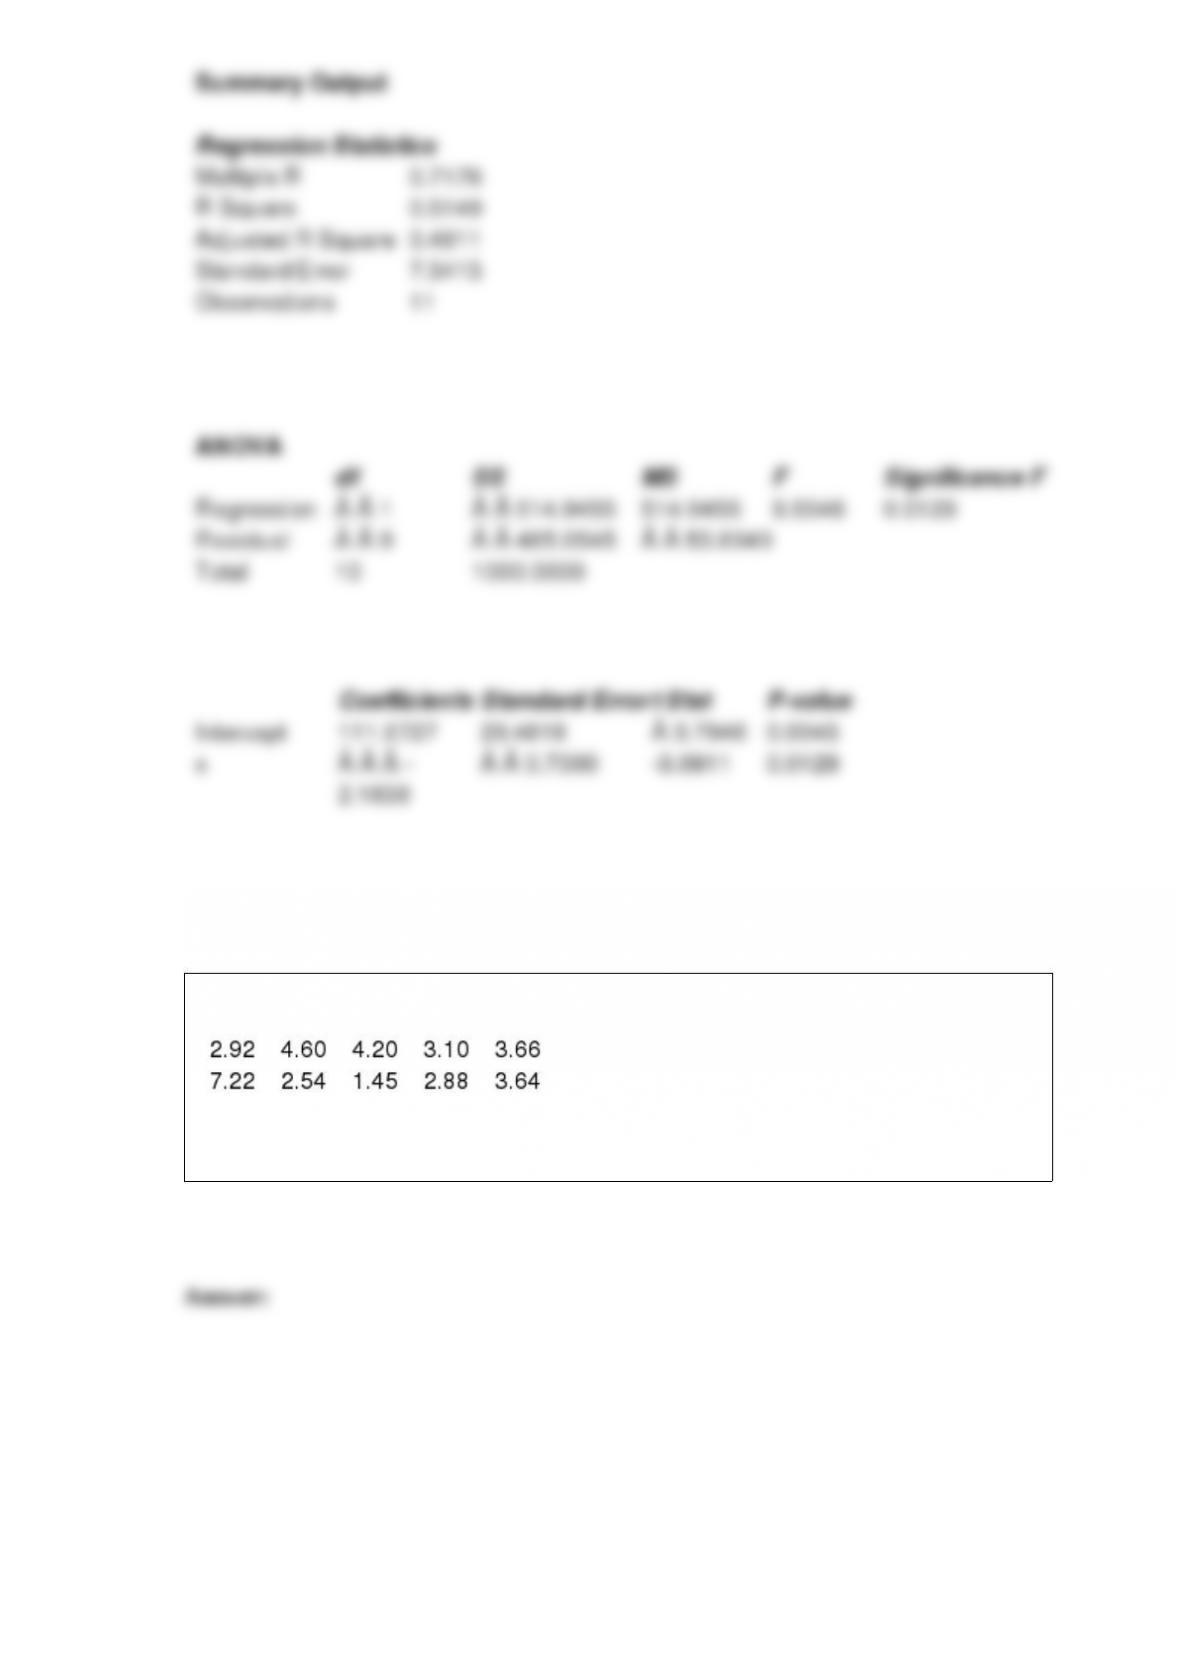
Part of an Excel output relating X (independent variable) and Y (dependent variable) is
shown below. Fill in all the blanks marked with “?”.
A sample of ten earnings per share estimates is shown below.
Use Excel to estimate the variance with a 95% level of confidence.
The board of directors of a corporation has agreed to allow the human resources
manager to move to the next step in planning day care service for employees’ children if
the manager can prove that at least 25% of the employees have interest in using the
service. The HR manager polls 300 employees and 90 say they would seriously
consider utilizing the service. At the
= .10 level of significance, is there enough
interest in the service to move to the next planning step?
A sample of 6 recent college graduates shows their current annual income (in $1000),
years of education, and current age (in years). The data follow:
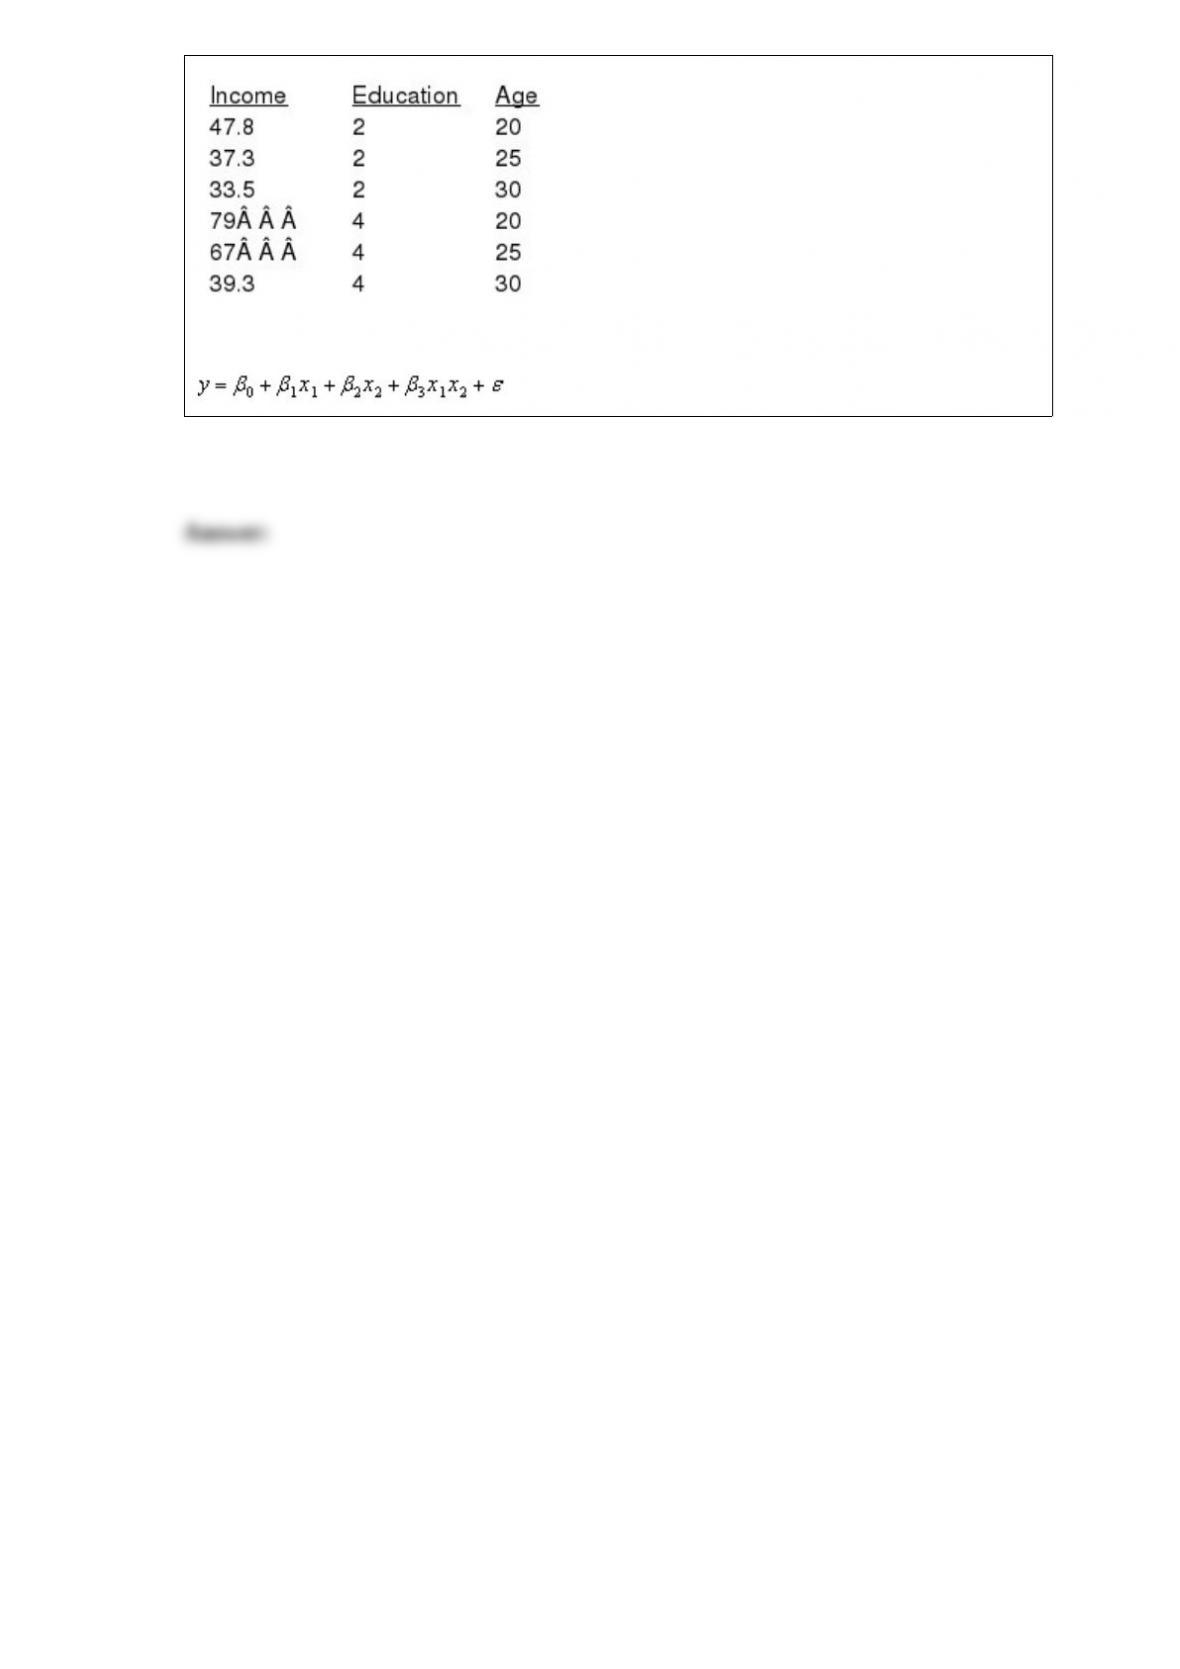
Use Excel’s Regression Tool to estimate a general linear model of the form that predicts
annual income.
Thirty-two percent of the students in a management class are graduate students. A
random sample of 5 students is selected. Using the binomial probability function,
determine the probability that the sample contains exactly 2 graduate students?
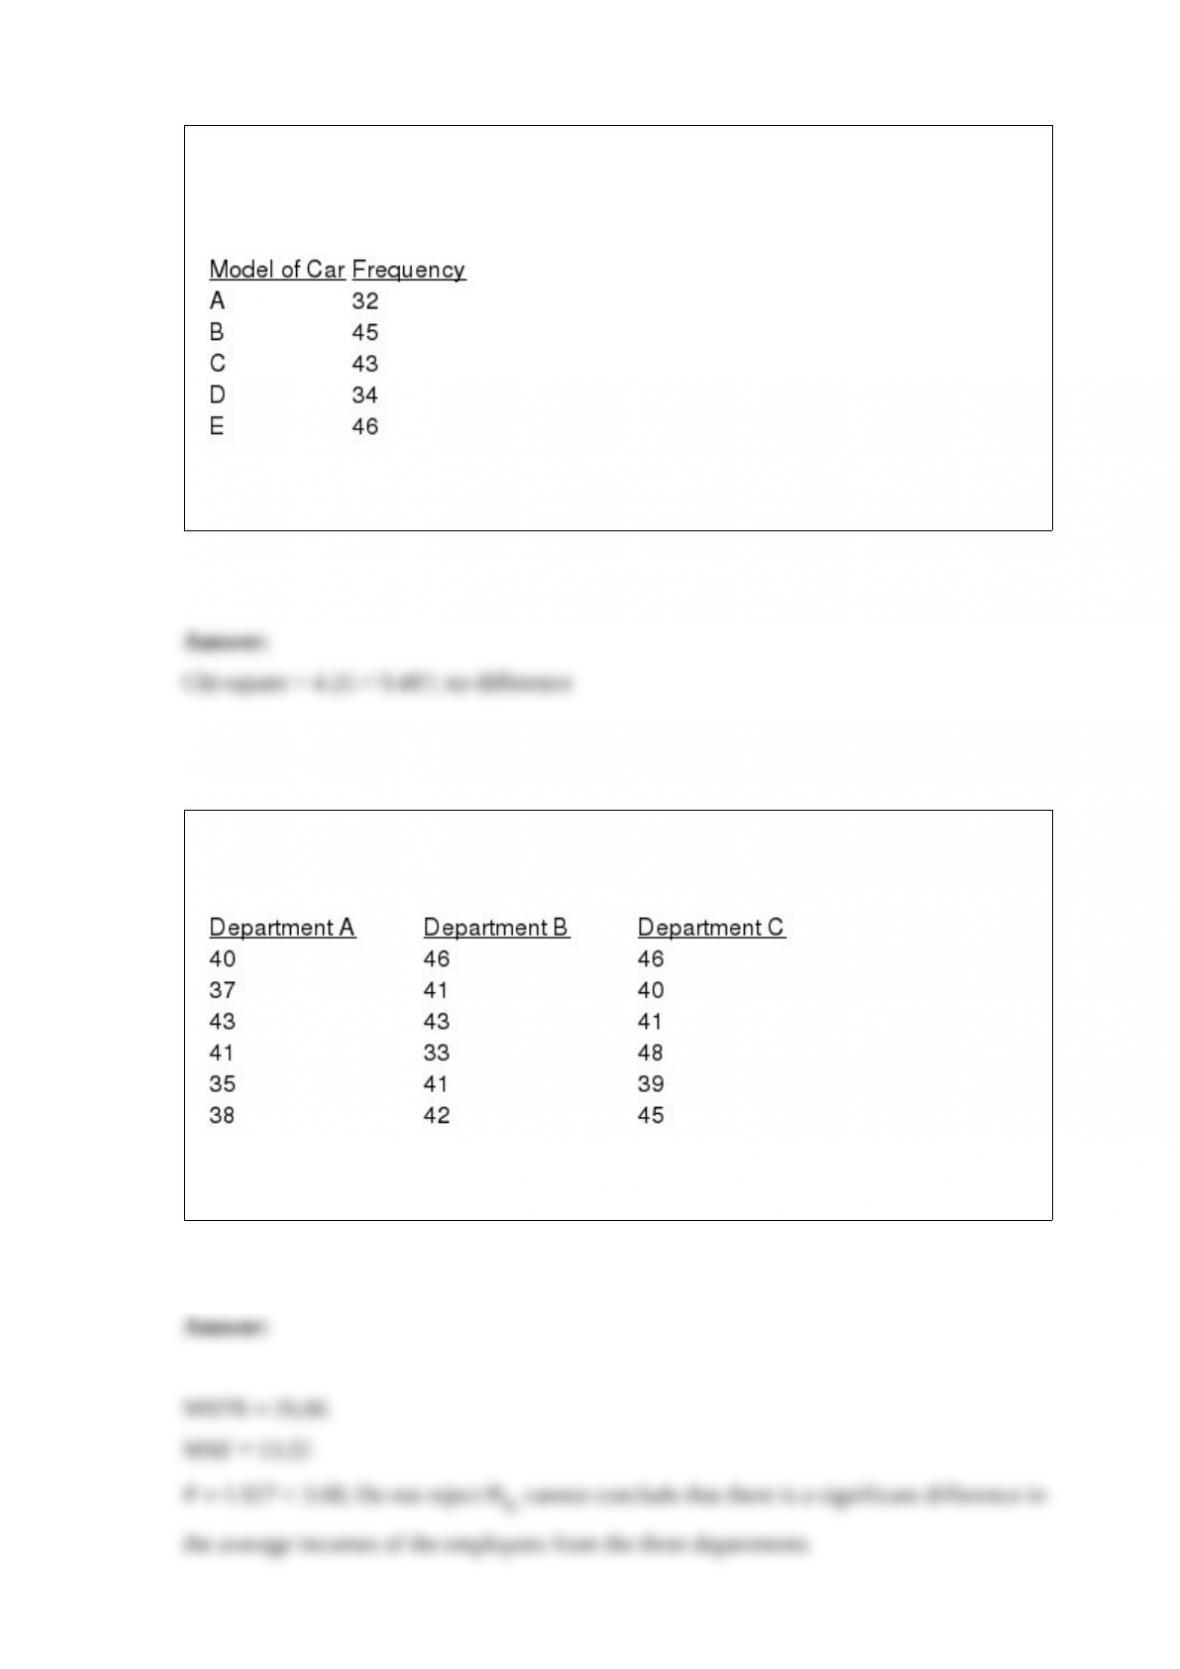
A major automobile manufacturer claimed that the frequencies of repairs on all five
models of its cars are the same. A sample of 200 repair services showed the following
frequencies on the various makes of cars.
At = 0.05, test the manufacturer’s claim.
Random samples of employees from three different departments of MNM Corporation
showed the following yearly incomes (in $1,000).
At = .05, test to determine if there is a significant difference among the average
incomes of the employees from the three departments.