Regression analysis was applied between sales (in $1,000) and advertising (in $100),
and the following regression function was obtained.
80 6.2x
Based on the above estimated regression line, if advertising is $10,000, then the point
estimate for sales (in dollars) is
a. $62,080
b. $142,000
c. $700
d. $700,000
Whenever the probability is proportional to the length of the interval in which the
random variable can assume a value, the random variable is
a. uniformly distributed
b. normally distributed
c. exponentially distributed
d. Poisson distributed
You are given an ANOVA table below with some missing entries.
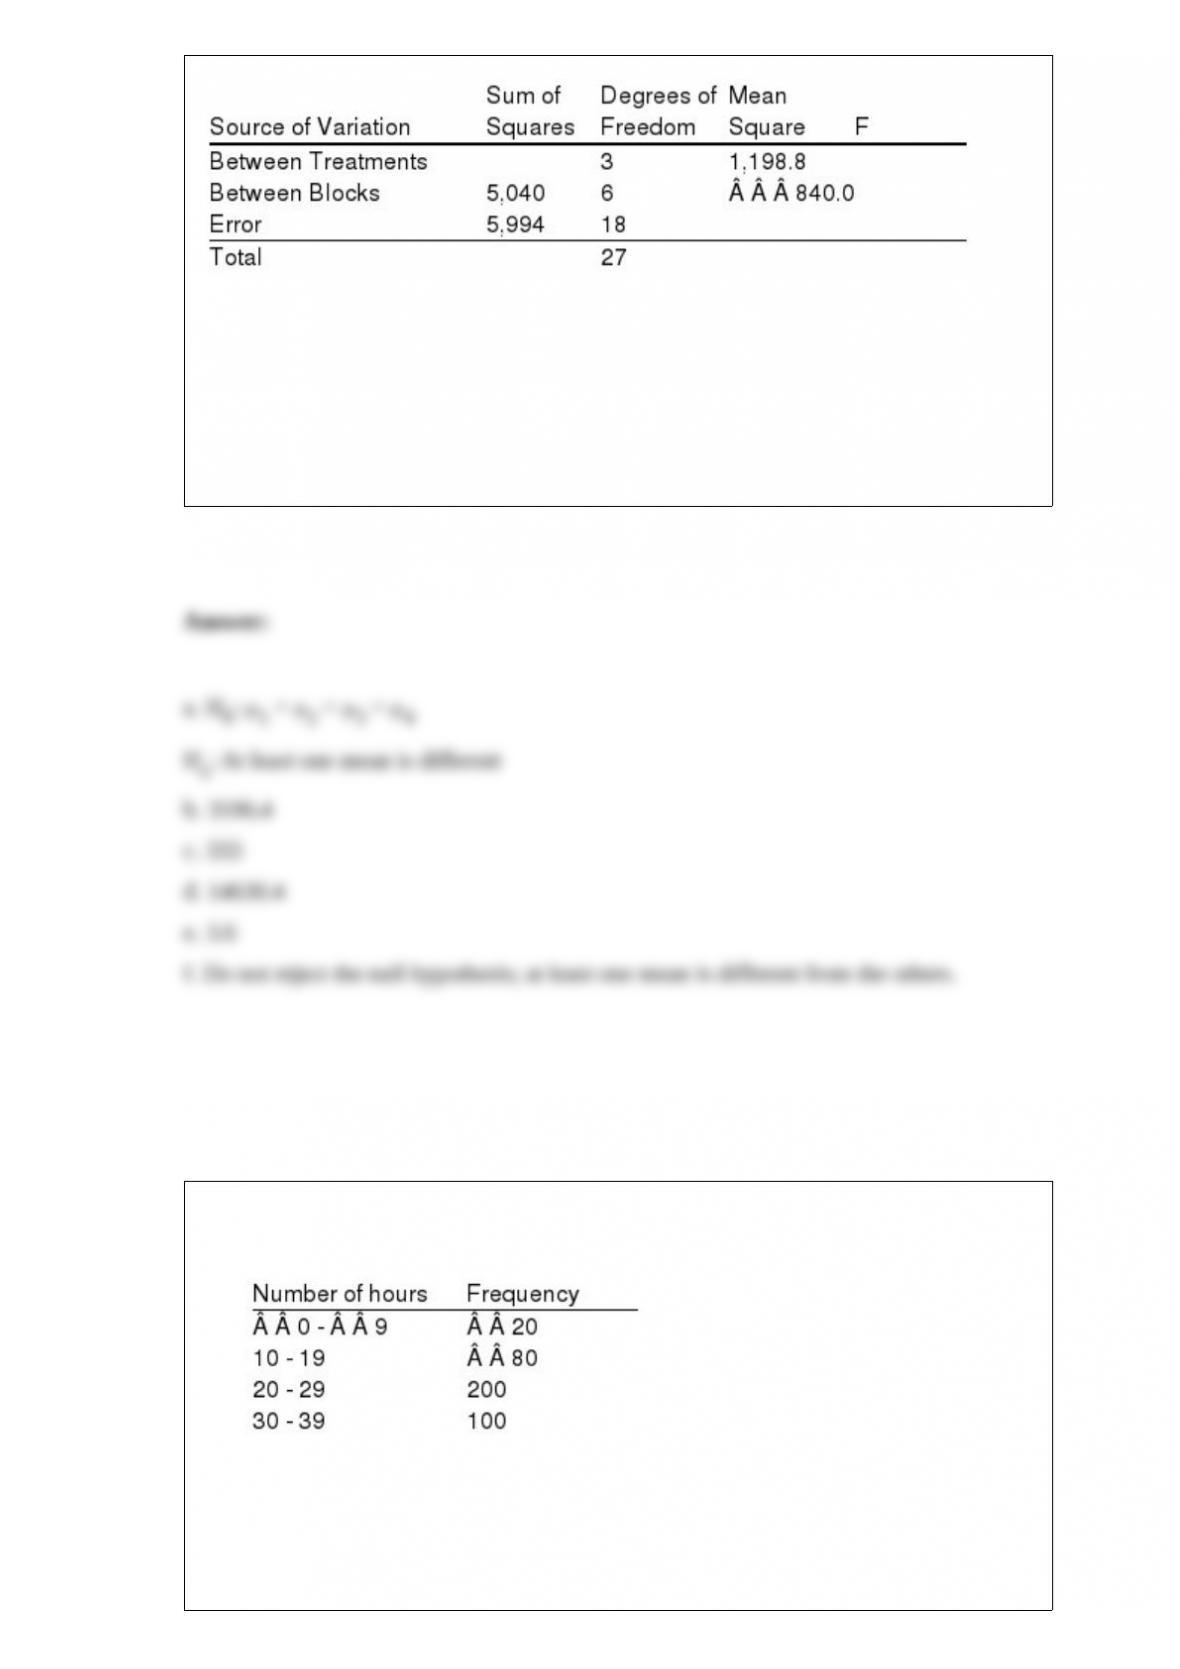
a. State the null and alternative hypotheses.
b. Compute the sum of squares between treatments.
c. Compute the mean square due to error.
d. Compute the total sum of squares.
e. Compute the test statistic F.
f. Test the null hypothesis stated in Part a at the 1% level of significance. Be sure to
state your conclusion.
Exhibit 2-1
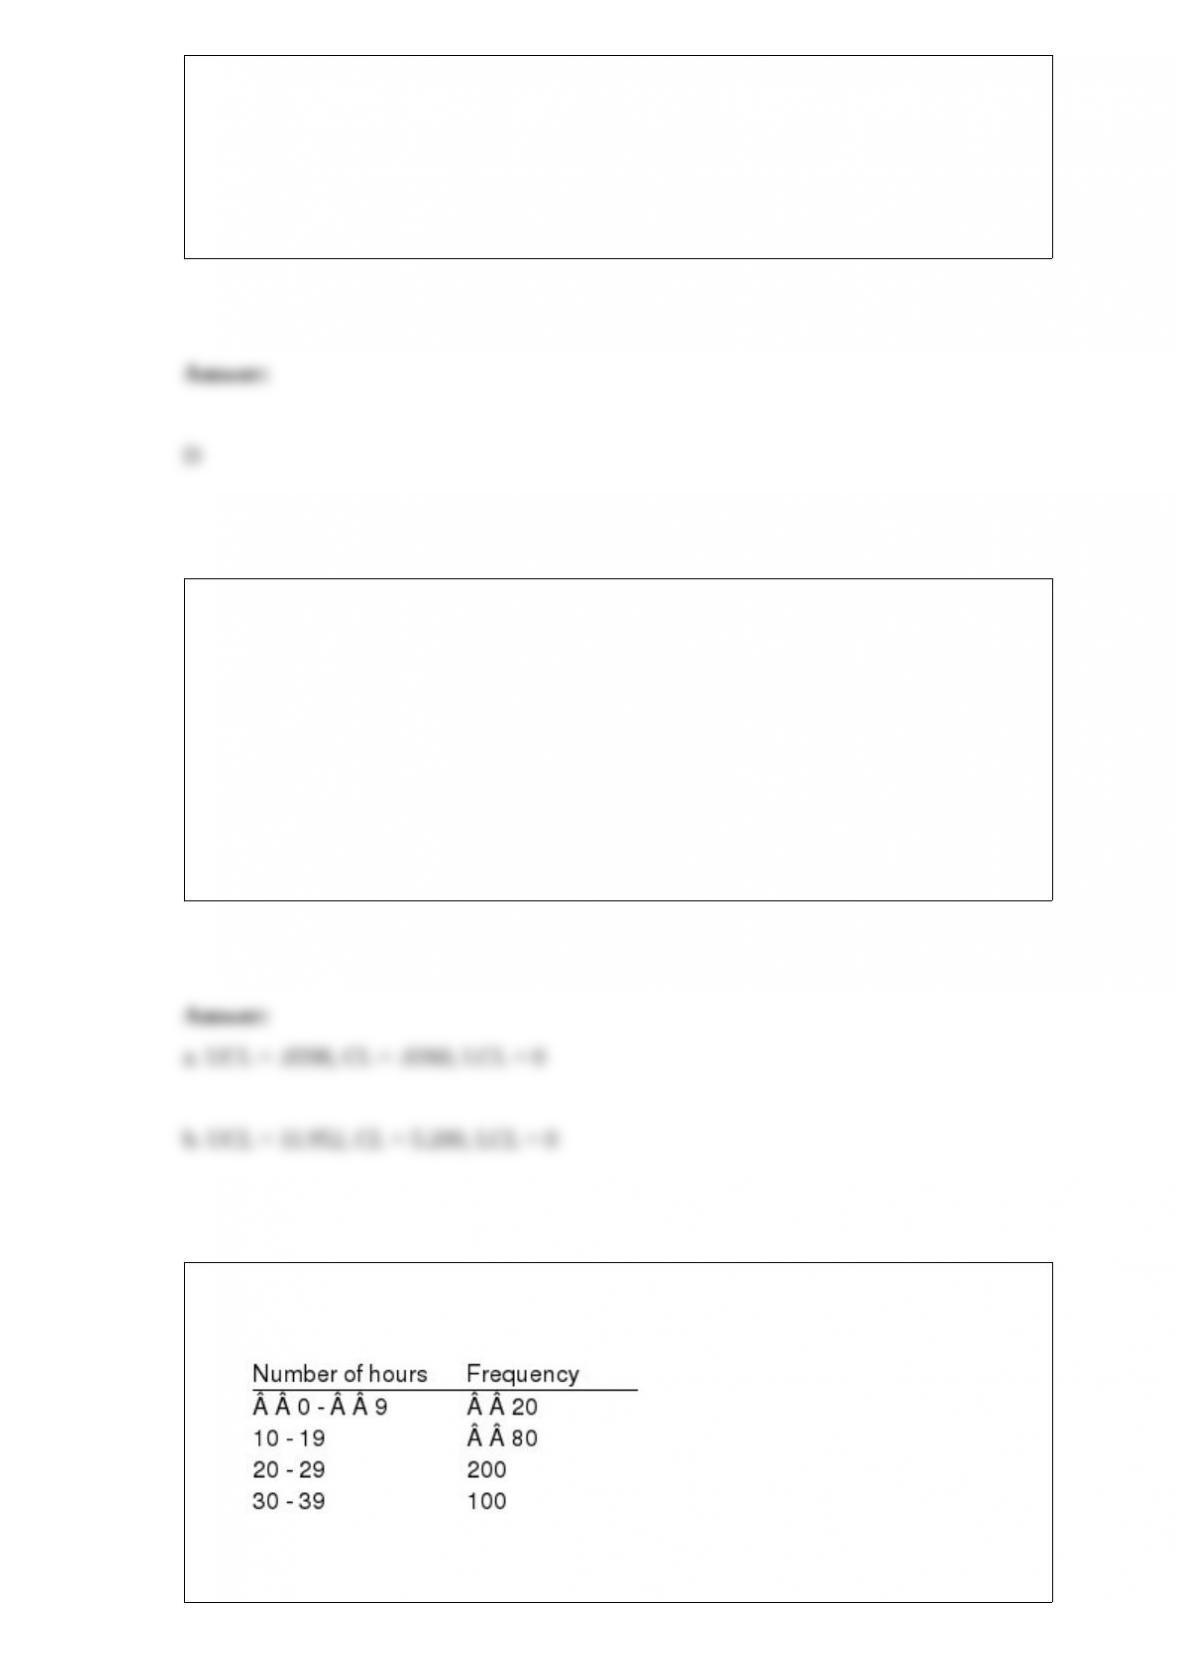
The numbers of hours worked (per week) by 400 statistics students are shown below.
Refer to Exhibit 2-1. The number of students working 19 hours or less
a. is 80
b. is 100
c. is 180
d. is 300
The uniform probability distribution is used with
a. a continuous random variable
b. a discrete random variable
c. a normally distributed random variable
d. any random variable
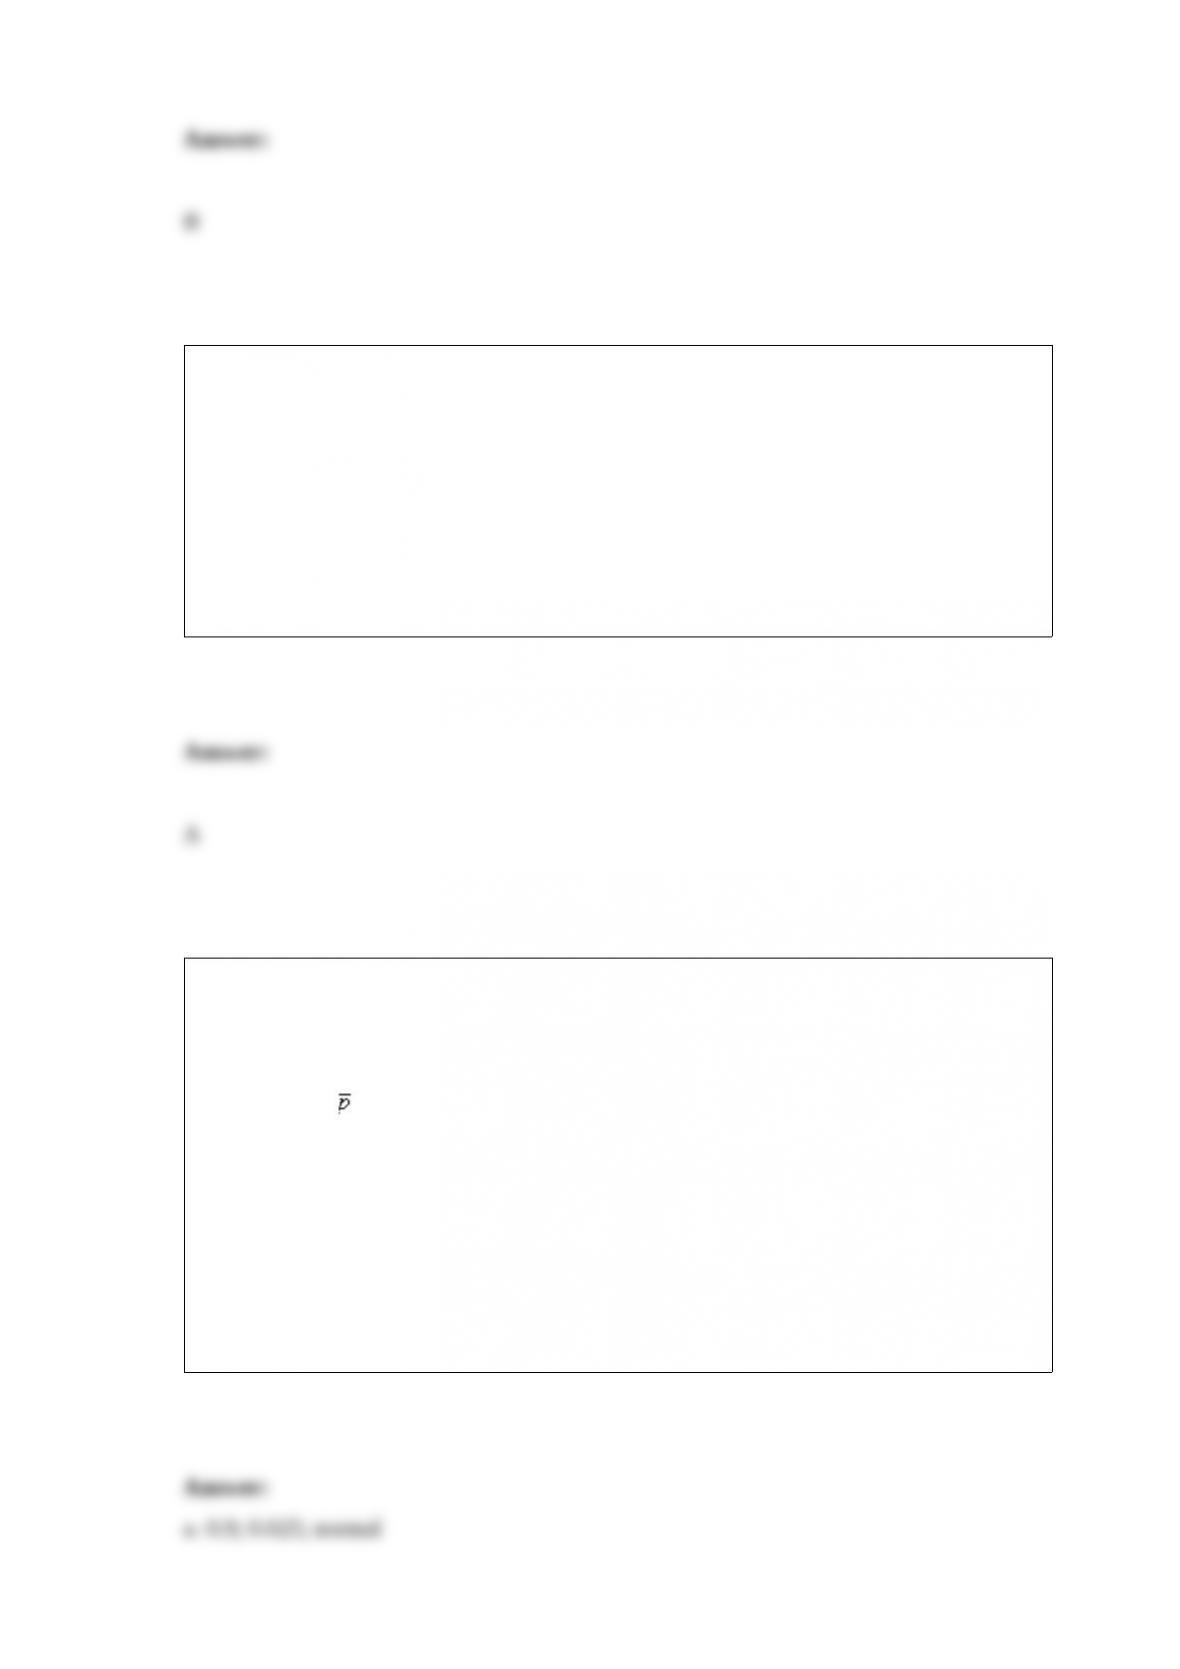
In a restaurant, the proportion of people who order coffee with their dinner is 0.9. A
simple random sample of 144 patrons of the restaurant is taken.
a. What are the expected value, standard deviation, and shape of the sampling
distribution of ?
b. What is the random variable in this problem? Define it in words.
c. What is the probability that the proportion of people who will order coffee with their
meal is between 0.85 and 0.875?
d. What is the probability that the proportion of people who will order coffee with their
meal is at least 0.945?
An important application of the chi-square distribution is
a. making inferences about a single population variance
b. testing for goodness of fit
c. testing for the independence of two variables
d. All of these alternatives are correct.
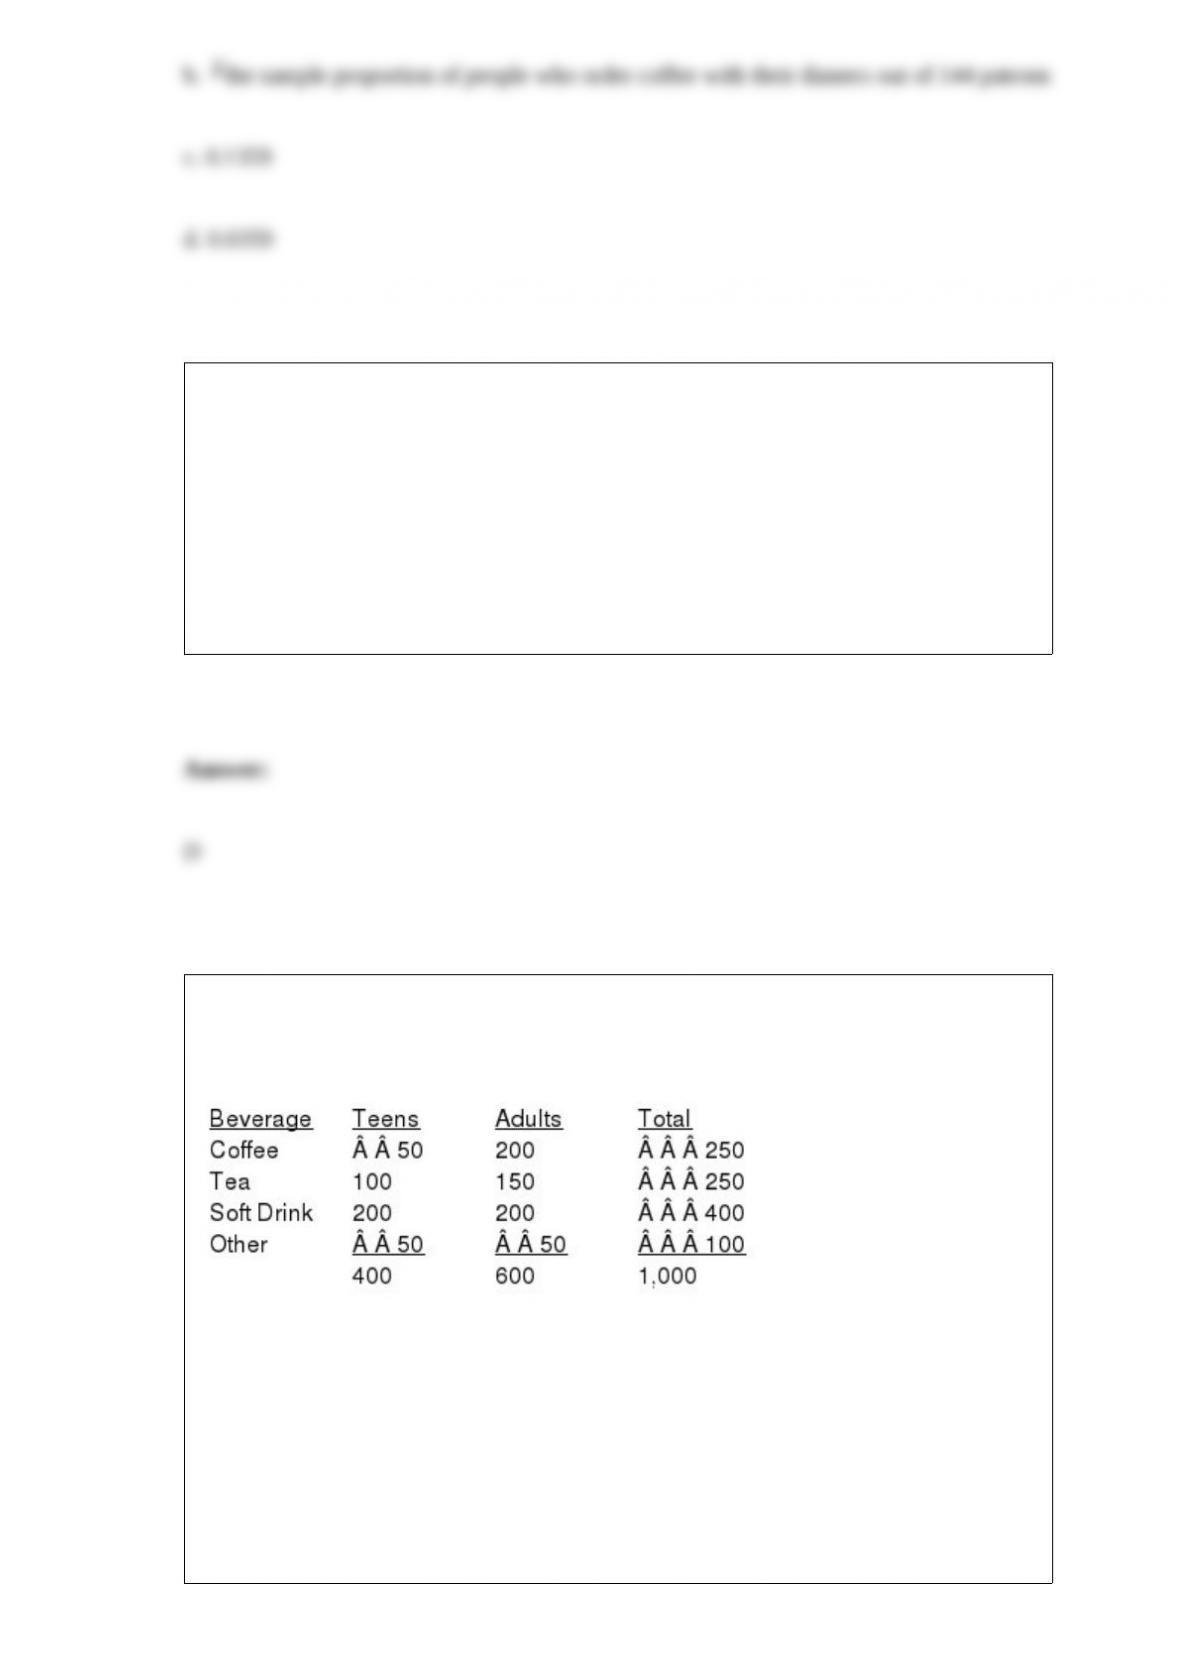
Exhibit 12-5
The table below gives beverage preferences for random samples of teens and adults.
We are asked to test for independence between age (i.e., adult and teen) and drink
preferences.
Refer to Exhibit 12-5. The expected number of adults who prefer coffee is
a. 0.25
b. 0.33
c. 150
d. 200
When the data are positively skewed, the mean will usually be
a. less than the median
b. greater than the median
c. less than the mode
d. greater than the mode
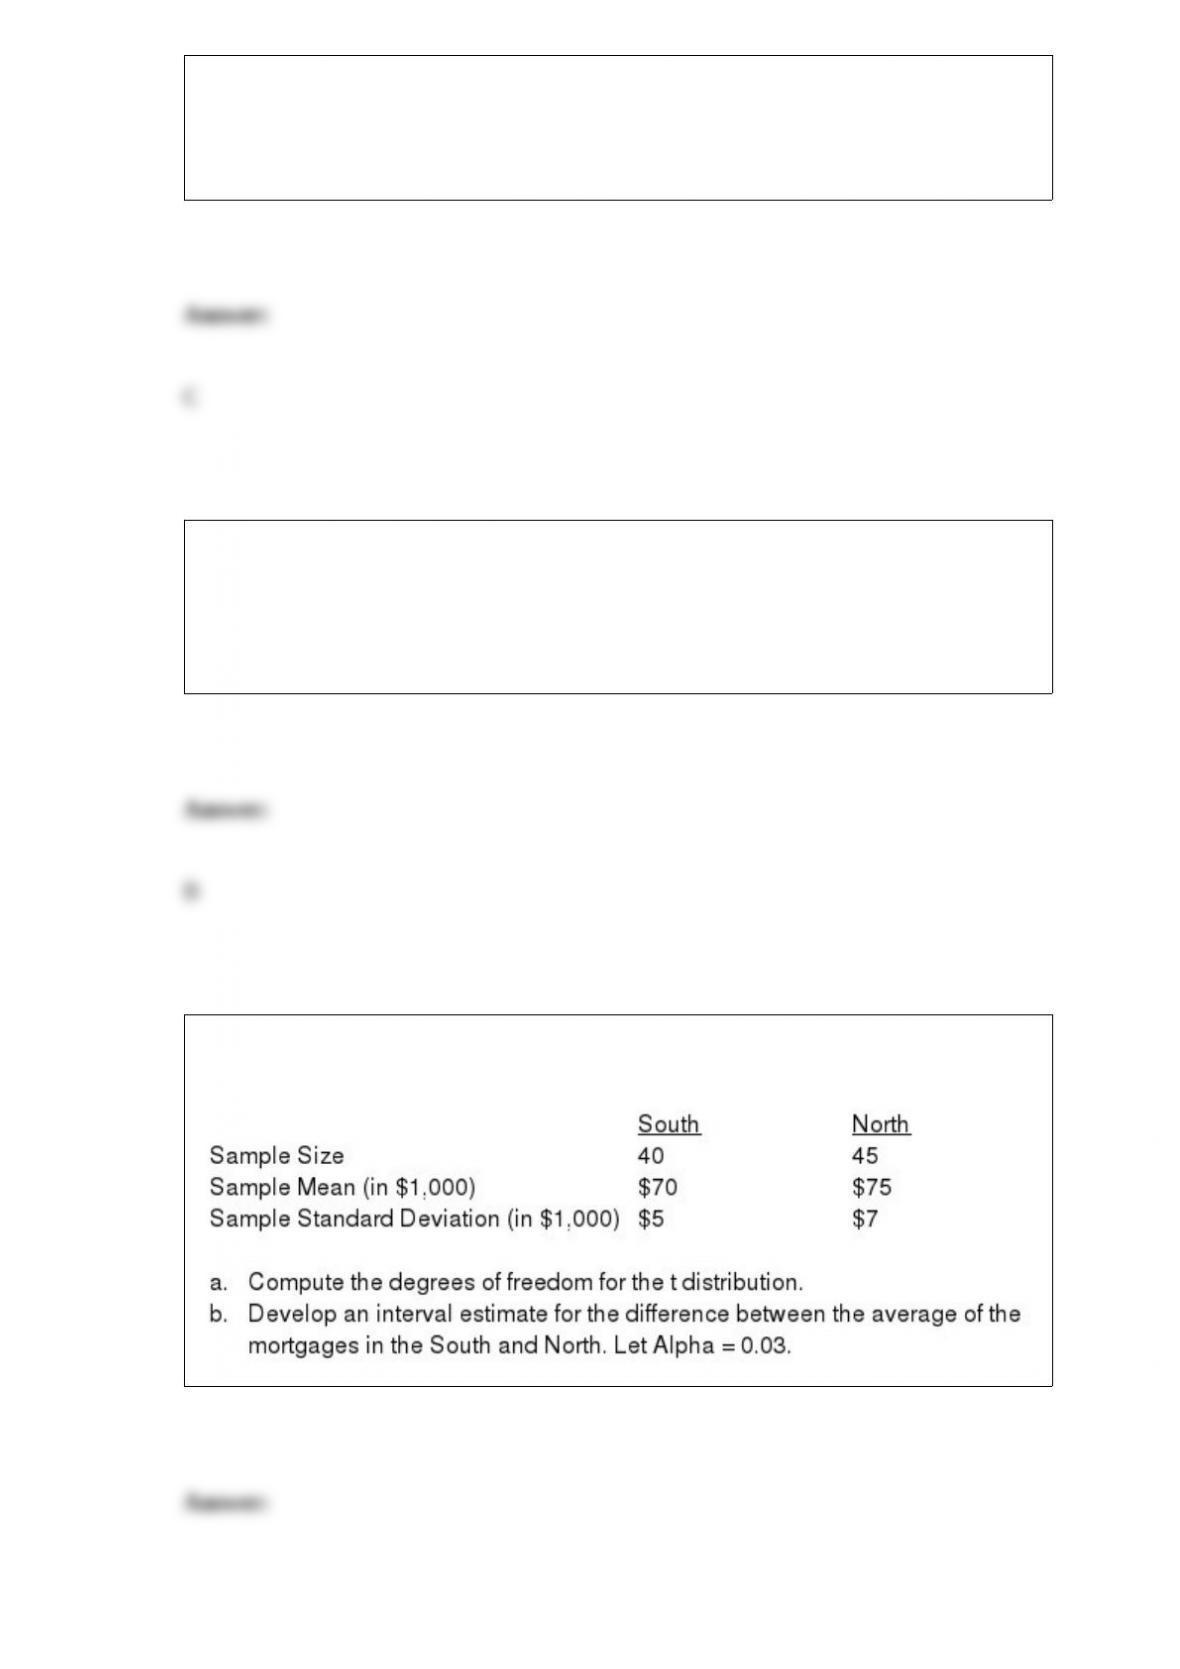
In order to estimate the difference between the average mortgages in the South and the
North of the United States, the following information was gathered.
If the coefficient of determination is 0.81, the coefficient of correlation
a. is 0.6561
b. must be 0.9
c. must be positive
d. None of these answers is correct.
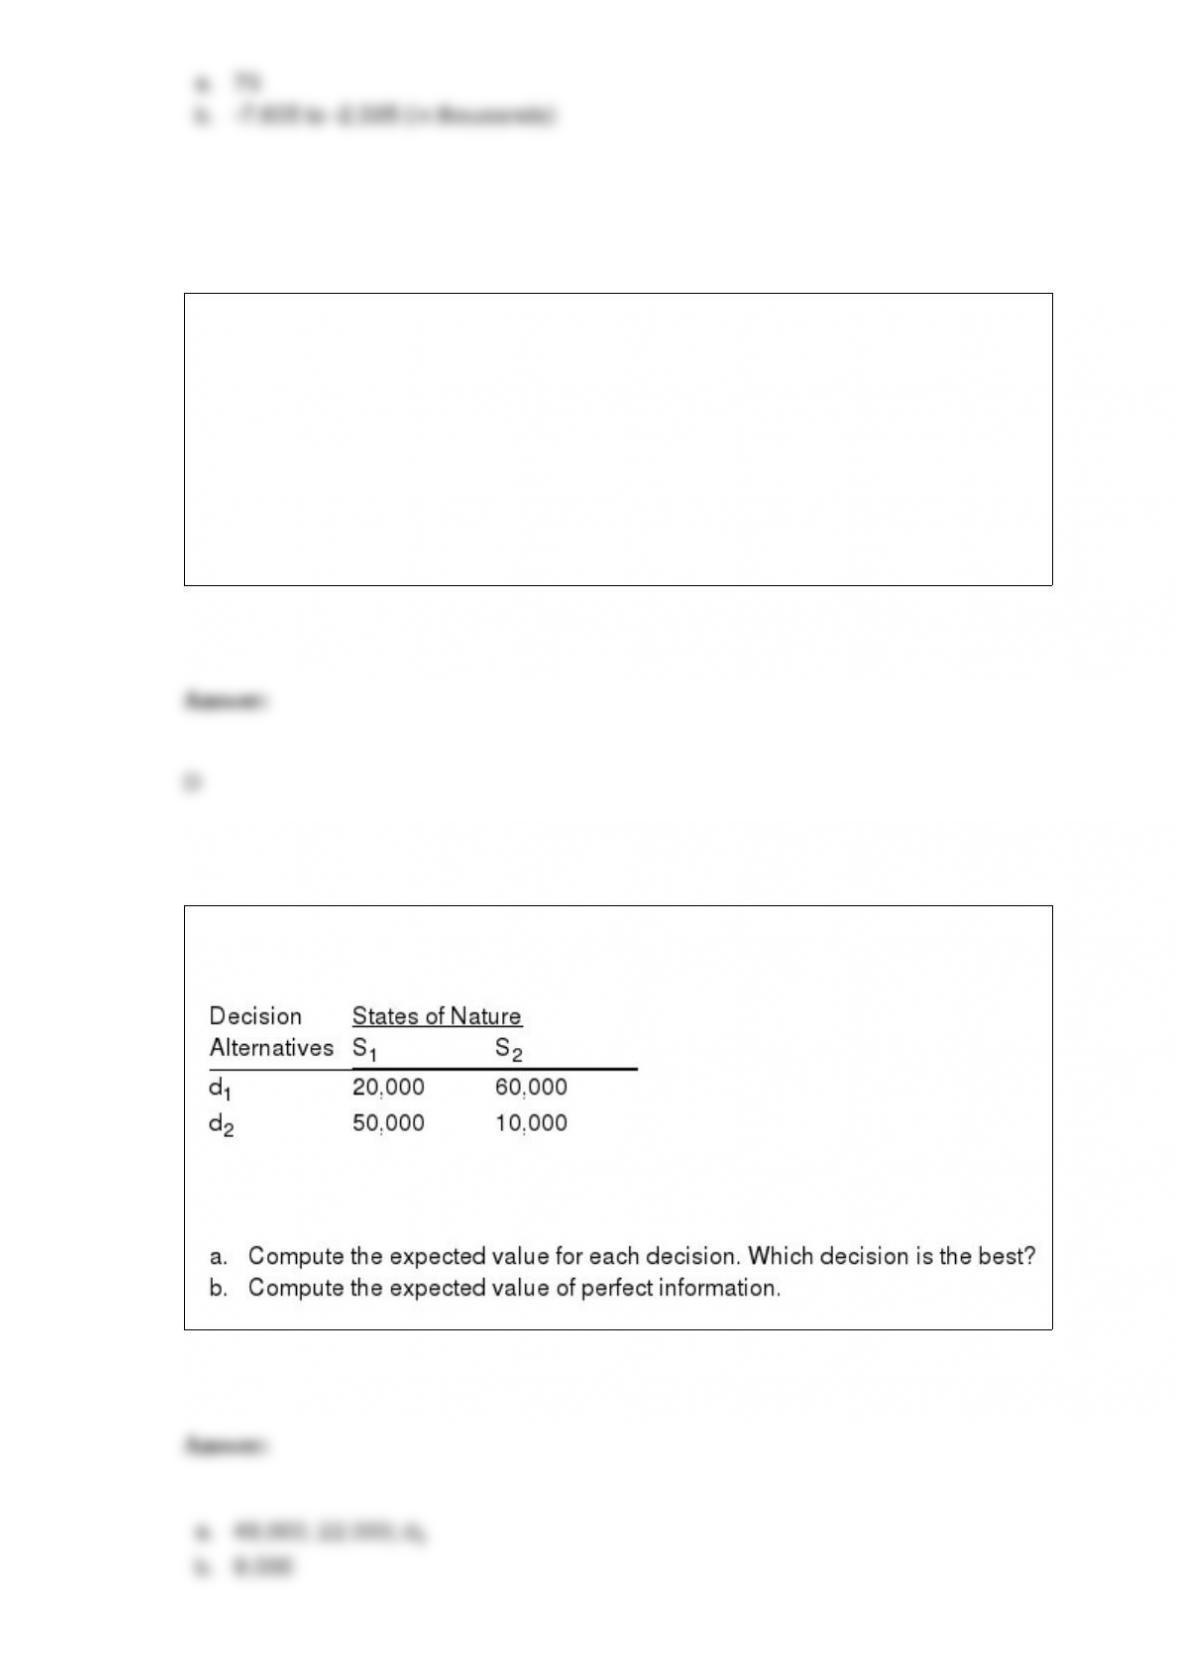
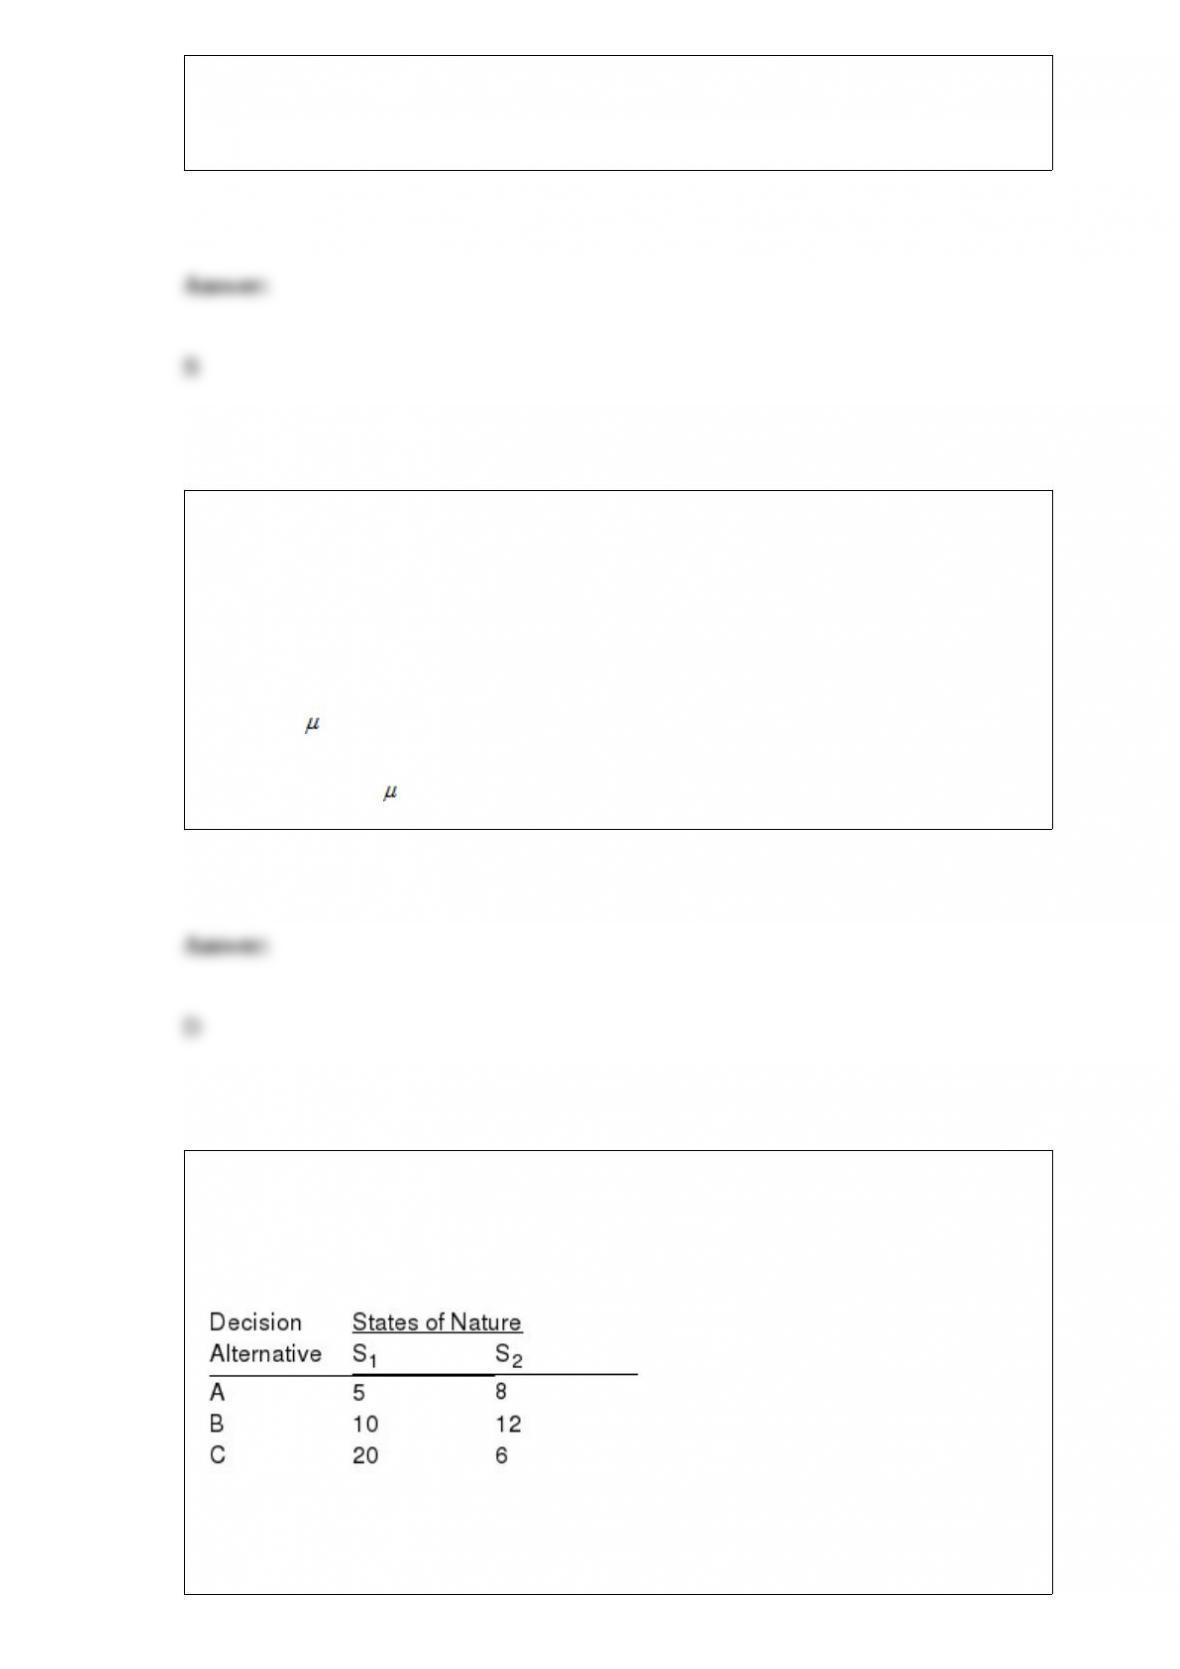
Below you are given a payoff table involving two states of nature and two decision
alternatives.
The probability of the occurrence of S1 is 0.3.
Events A and B are mutually exclusive. Which of the following statements is also true?
a. A and B are also independent.
b. P(A B) P(A)P(B)
c. P(A B) P(A) P(B)
d. P(A B) P(A) P(B)
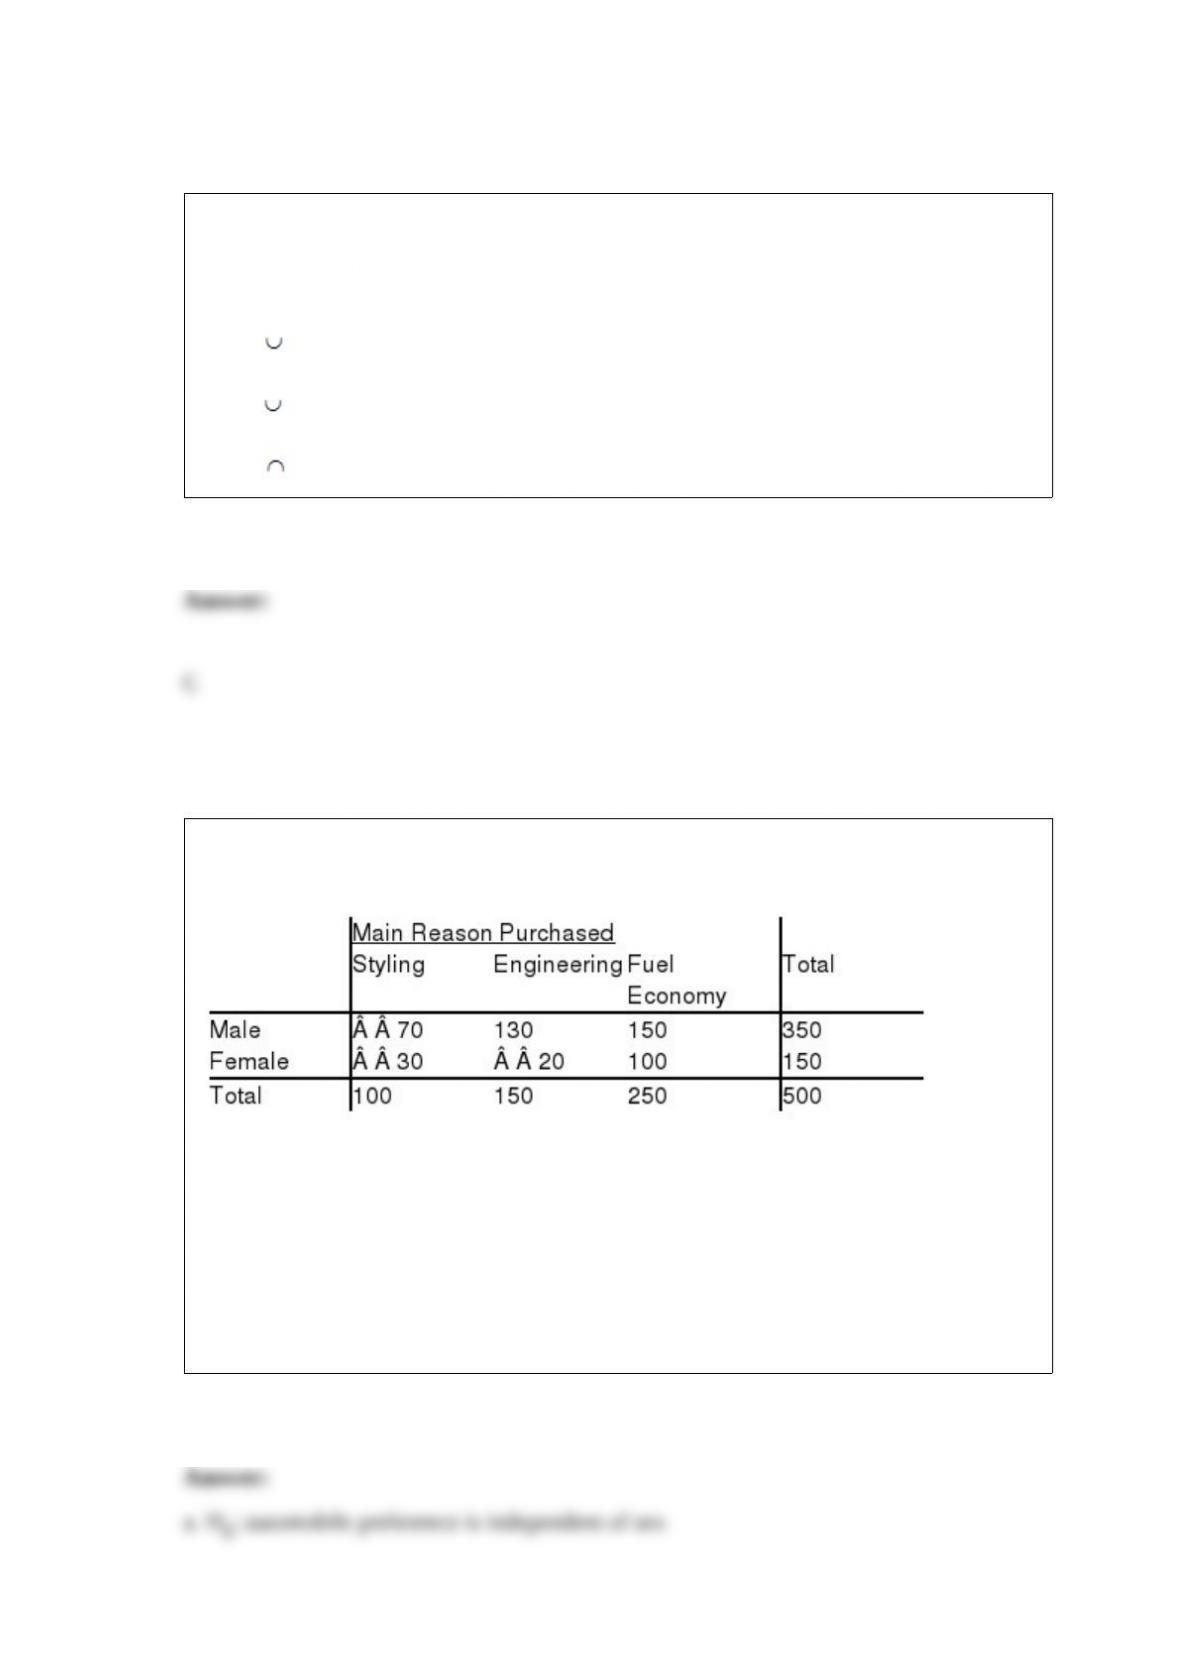
Five hundred randomly selected automobile owners were questioned on the main
reason they had purchased their current automobile. The results are given below.
a. State the null and alternative hypotheses for a contingency table test.
b. State the decision rule, using a .10 level of significance.
c. Calculate the chi-square test statistic.
d. Give your conclusion for this test.
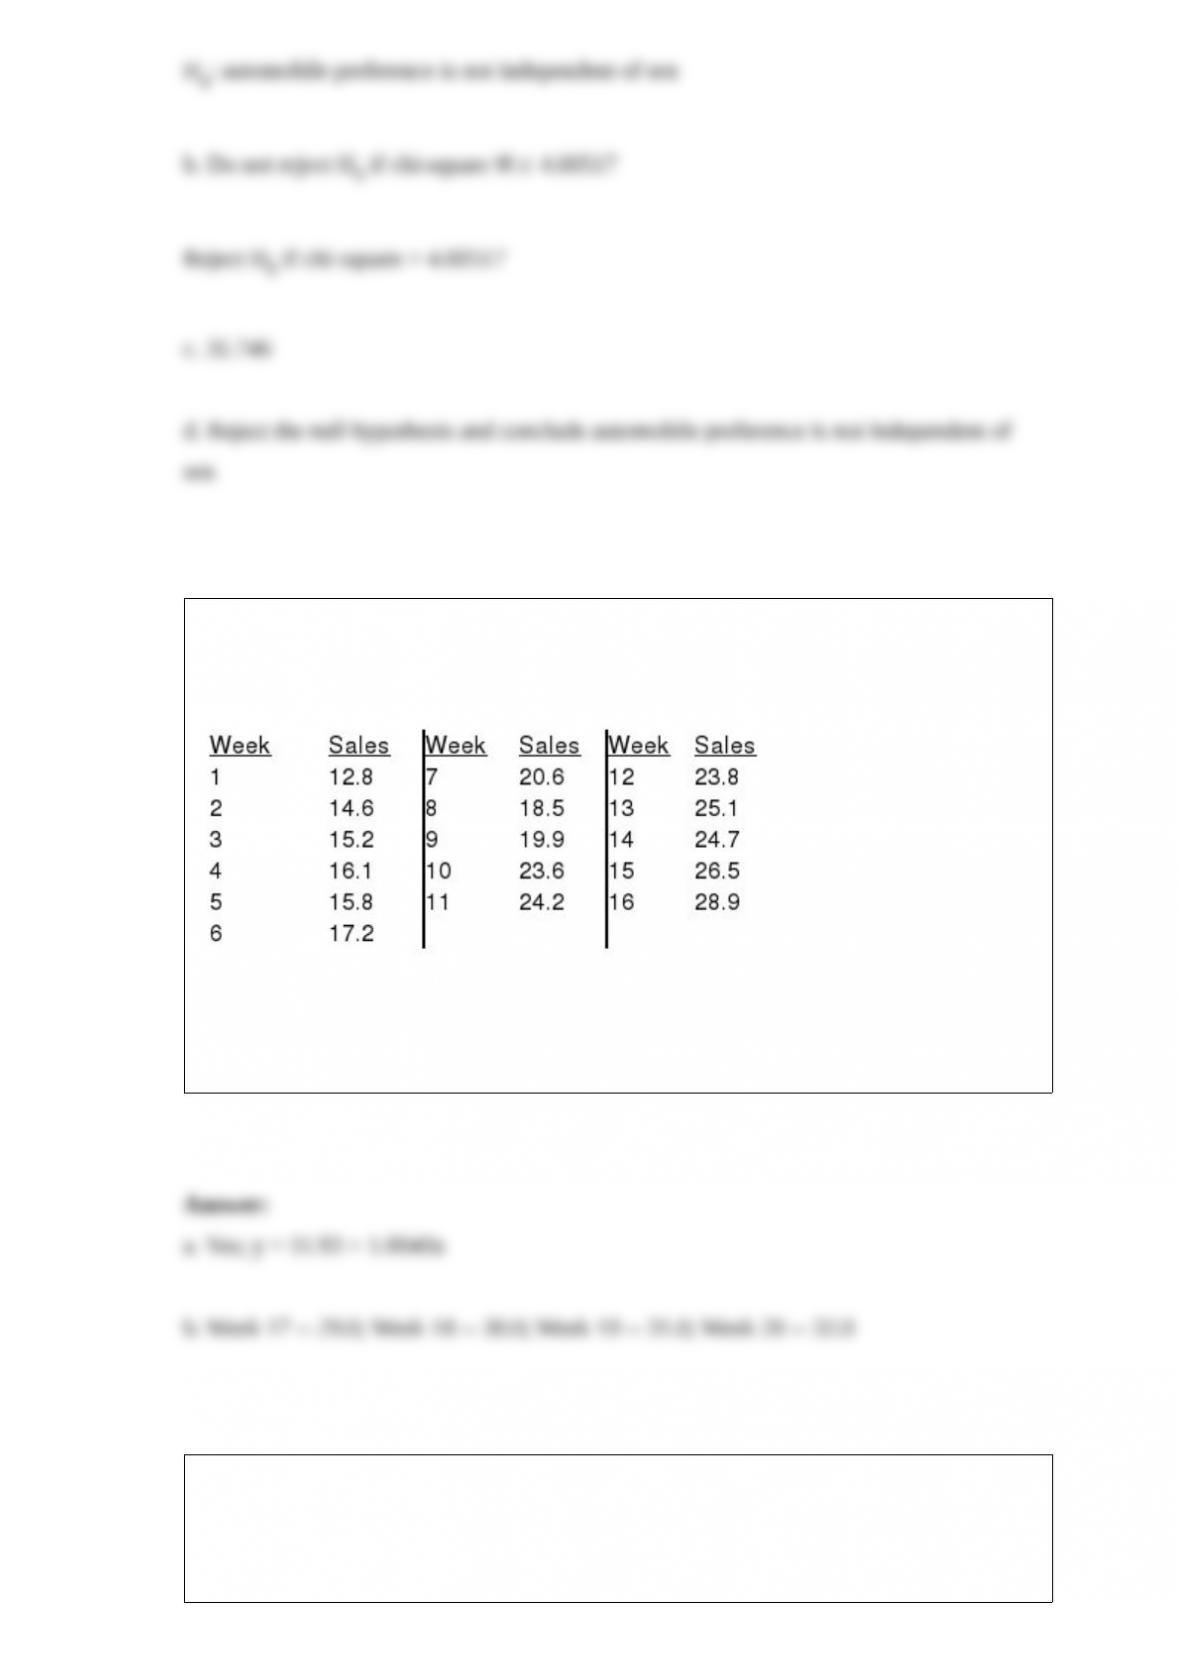
Four months ago, the Bank Drug Company introduced Jeffrey William brand designer
bandages. Advertised using the slogan, “What the best dressed cuts are wearing”,
weekly sales for this period (in 1000’s) have been as follows:
a) Plot a graph of sales vs. weeks. Does linear trend appear reasonable?
b) Assuming linear trend, forecast sales for weeks 17, 18, 19, and 20.
In a regression analysis if SSE 500 and SSR 300, then the coefficient of
determination is
a. 0.6000
b. 0.1666
c. 1.6666
d. 0.3750
Snipper, Inc. manufactures lawnmowers that require minor, final assembly by the
customer. A sealed plastic bag containing the hardware (nuts, bolts, washers, and so on)
needed for final assembly is included with each lawnmower shipped. During a week of
normal, in-control operation, twenty samples of 200 bags of hardware were examined
for content (hardware type and count) accuracy. A total of 104 bags of the 4000
examined failed to have the correct contents.
a. Compute the upper limit, center line, and lower limit for a p chart.
b. Compute the upper limit, center line, and lower limit for an np chart.
Exhibit 2-1
The numbers of hours worked (per week) by 400 statistics students are shown below.
Refer to Exhibit 2-1. The percentage of students working 19 hours or less is
a. 20%
b. 25%
c. 75%
d. 80%
For a two-tailed hypothesis test about a population mean, the null hypothesis can be
rejected if the confidence interval
a. is symmetric
b. is non-symmetric
c. includes 0
d. does not include 0
Exhibit 20-1
Below you are given a payoff table involving two states of nature and three decision
alternatives.
The probability of occurrence of S1 = 0.2.
Refer to Exhibit 20-1. The expected value of the best alternative is
a. 8.8
b. 9.6
c. 22.0
d. None of the answers are correct.
The general practice in quality control is to set the control chart’s upper and lower
control limit values equal to the variable’s mean value +/
a. 1 standard deviation
b. 2 standard deviations
c. 2.5 standard deviations
d. 3 standard deviations
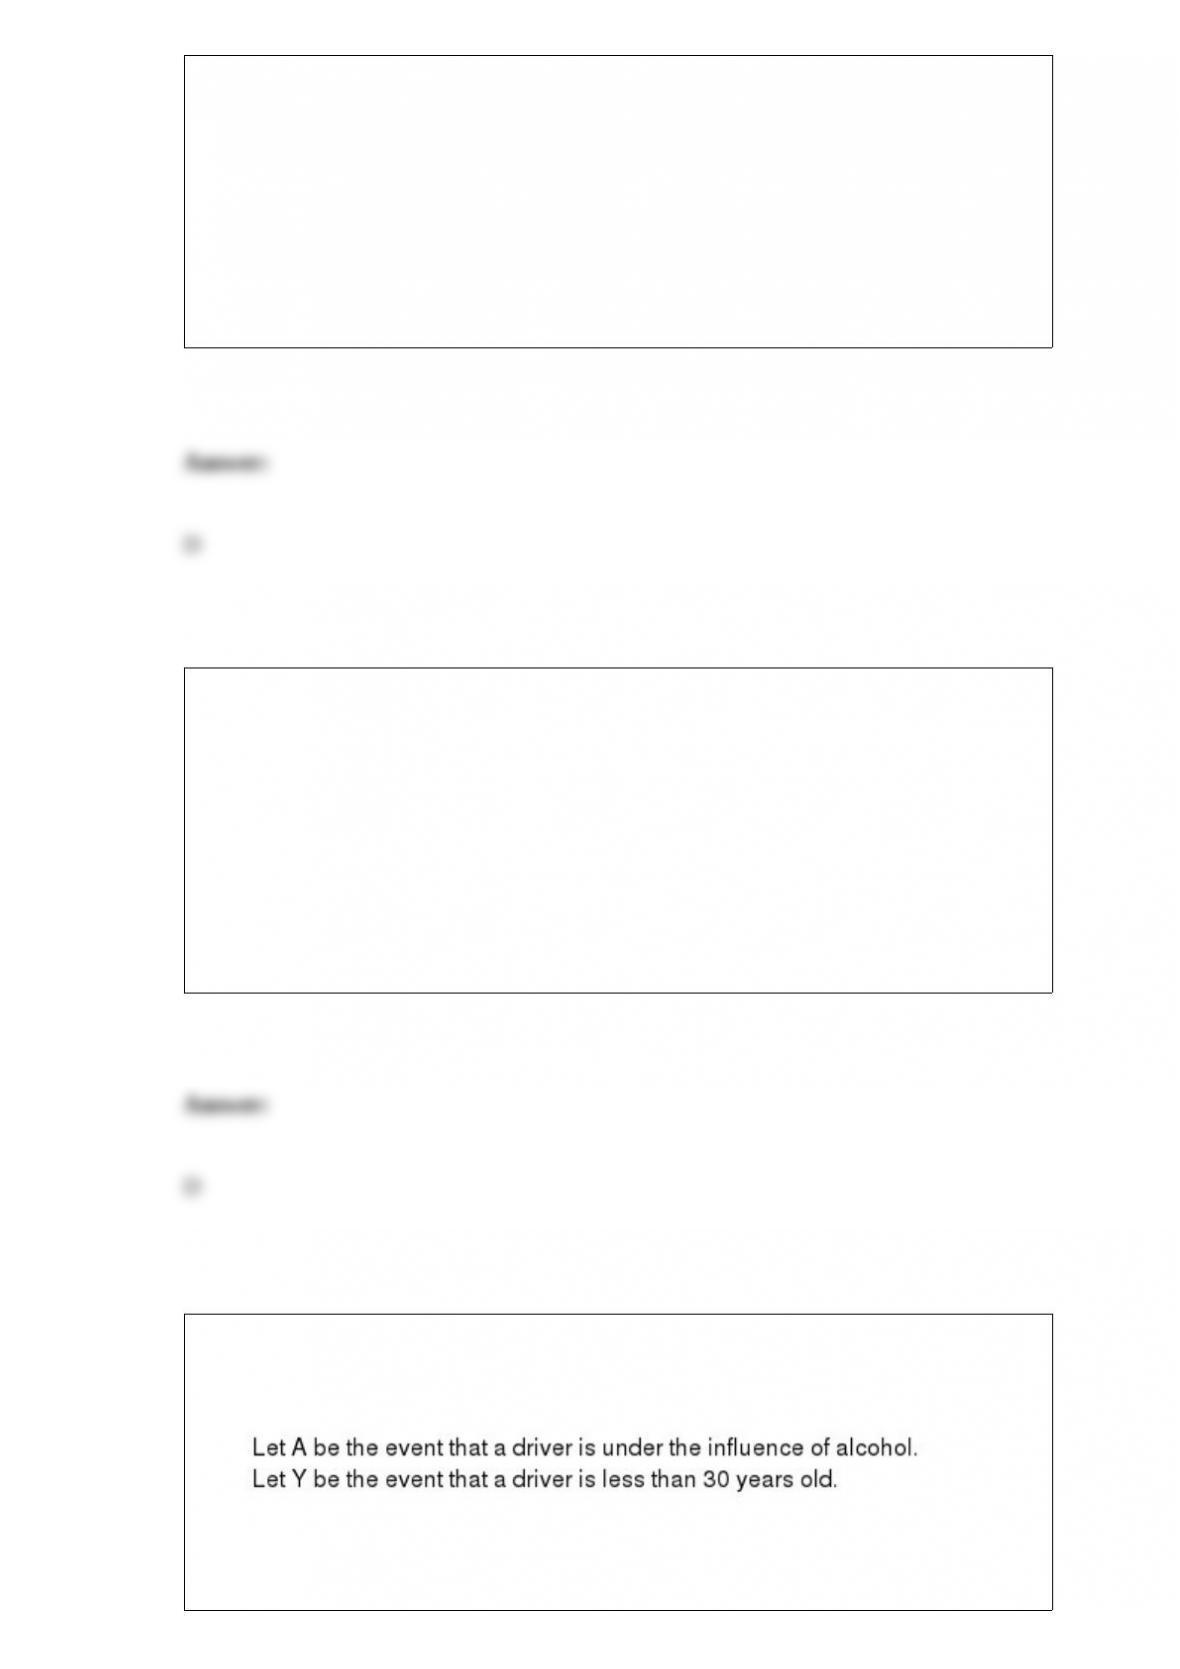
On a recent holiday evening, a sample of 500 drivers was stopped by the police. Three
hundred were under 30 years of age. A total of 250 were under the influence of alcohol.
Of the drivers under 30 years of age, 200 were under the influence of alcohol.
a. Determine P(A) and P(Y).
b. What is the probability that a driver is under 30 and not under the influence of
alcohol?
c. Given that a driver is not under 30, what is the probability that he/she is under the
influence of alcohol?
d. What is the probability that a driver is under the influence of alcohol if we know the
driver is under 30?
e. Show the joint probability table.
f. Are A and Y mutually exclusive events? Explain.
g. Are A and Y independent events? Explain.
A group of 2000 individuals from 3 different cities were asked whether they owned a
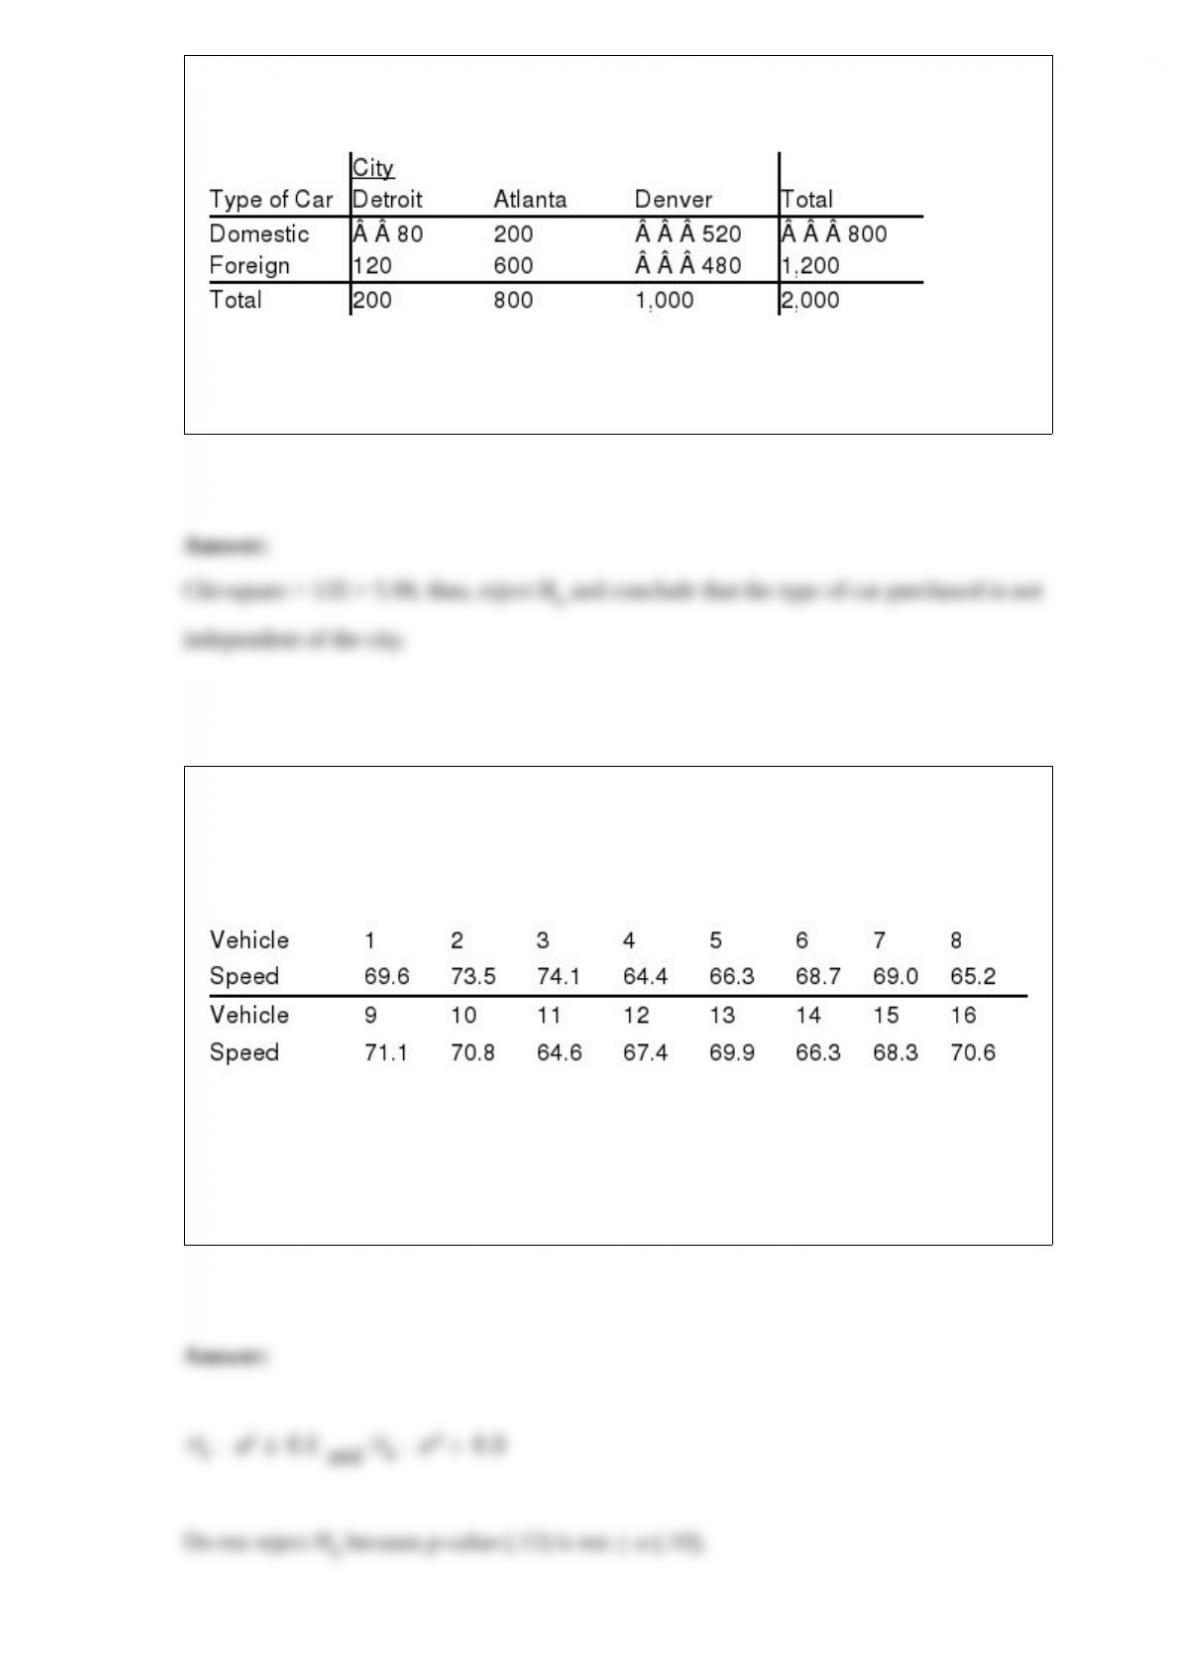
foreign or a domestic car. The following contingency table shows the results of the
survey.
At = 0.05, test to determine if the type of car purchased is independent of the city in
which the purchasers live.
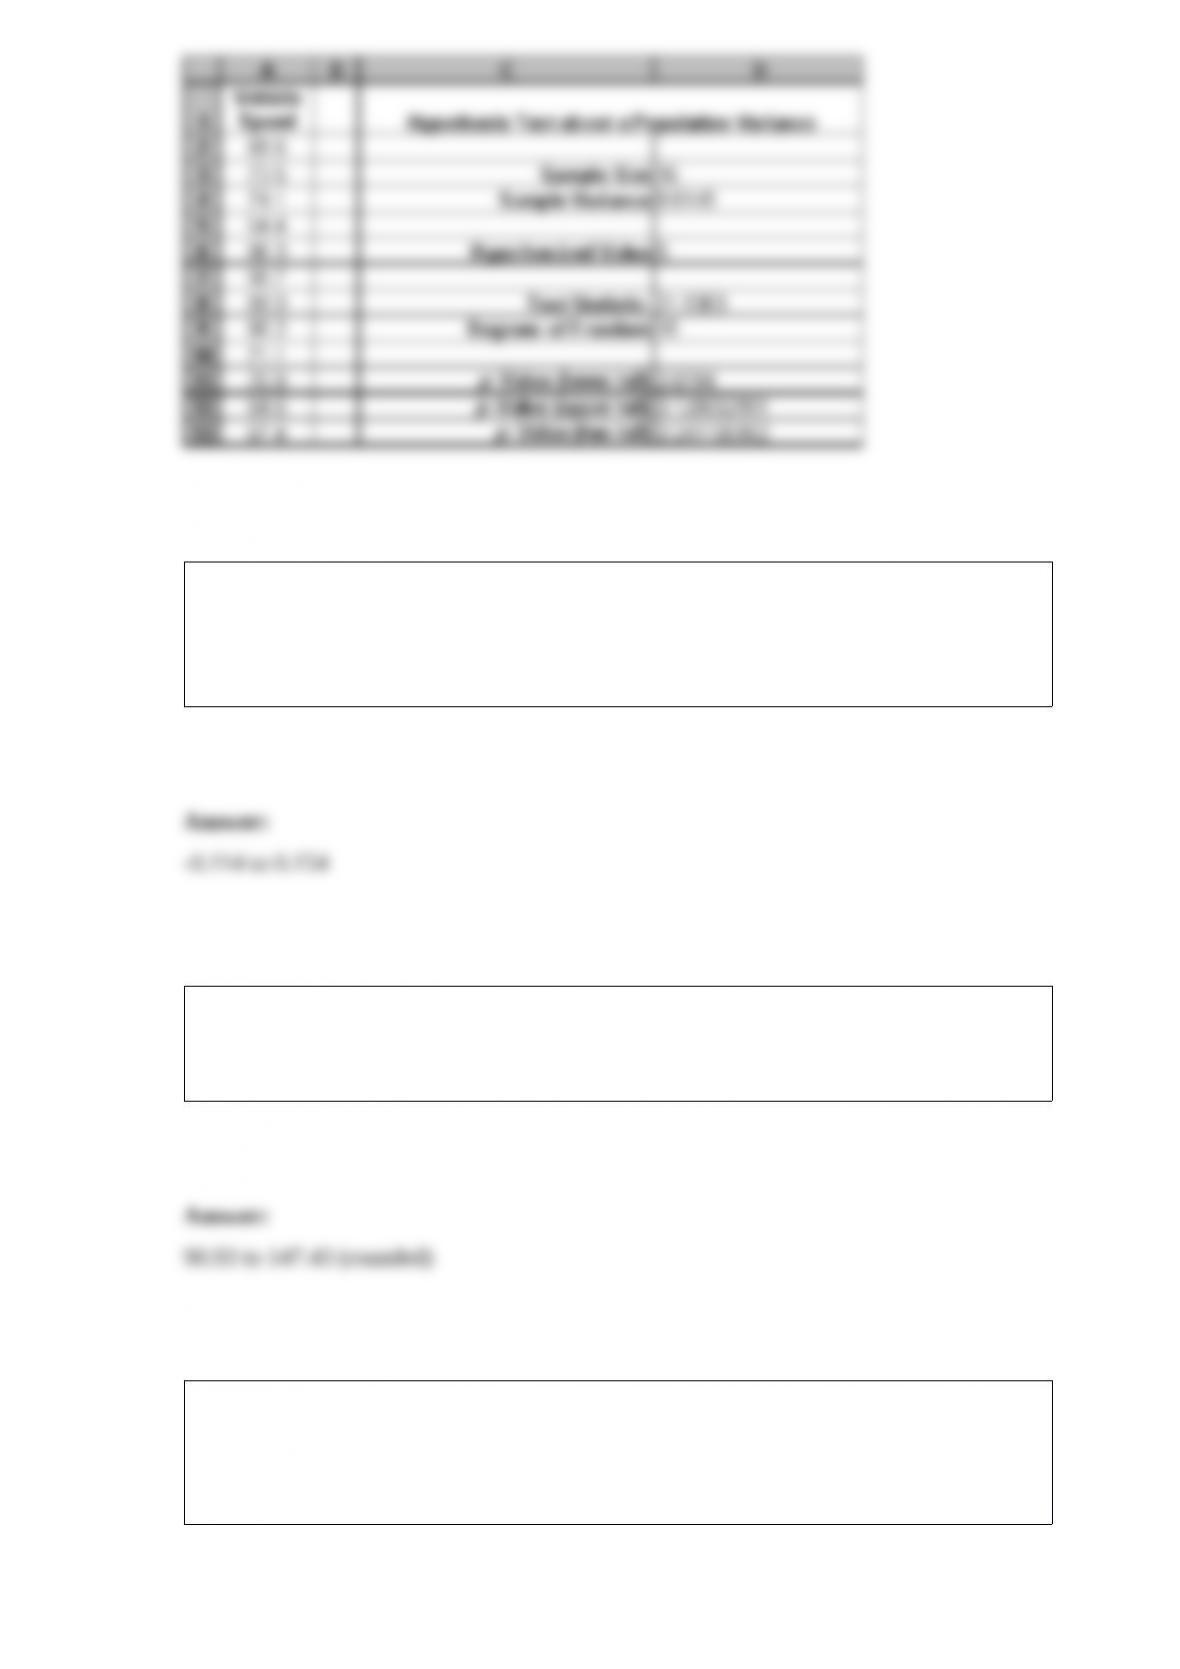
The State Highway Patrol (SHP) periodically samples vehicle speeds at Milepost 92 on
Interstate 17. The SHP is concerned about the dispersion of speeds of vehicles sharing
the same highway because significant difference in speed is a known cause of accidents.
The speeds of a random sample of 16 vehicles are shown below.
The SHP’s policy is to position a patrol car at Milepost 92 on Interstate 17 if the vehicle
speed variance at that location is believed to be greater than 6 miles per hour. Conduct a
hypothesis test (with a = .10) to determine whether the speed variance for all vehicles
passing Milepost 92 exceeds 6 mph.
Among a sample of 50 M.D.’s (medical doctors) in the city of Memphis, Tennessee, 10
indicated they make house calls; while among a sample of 100 M.D.’s in Atlanta,
Georgia, 18 said they make house calls. Determine a 95% interval estimate for the
difference between the proportion of doctors who make house calls in the two cities.
A random sample of 25 employees of a local utility firm showed that their monthly
incomes had a sample standard deviation of $112. Provide a 90% confidence interval
estimate for the standard deviation of the incomes for all the firm’s employees.
Three different models of automobiles (A, B, and C) were compared for gasoline
consumption. For each model of car, fifteen cars were randomly selected and subjected
to standard driving procedures. The average miles/gallon obtained for each model of car
and sample standard deviations are shown below.
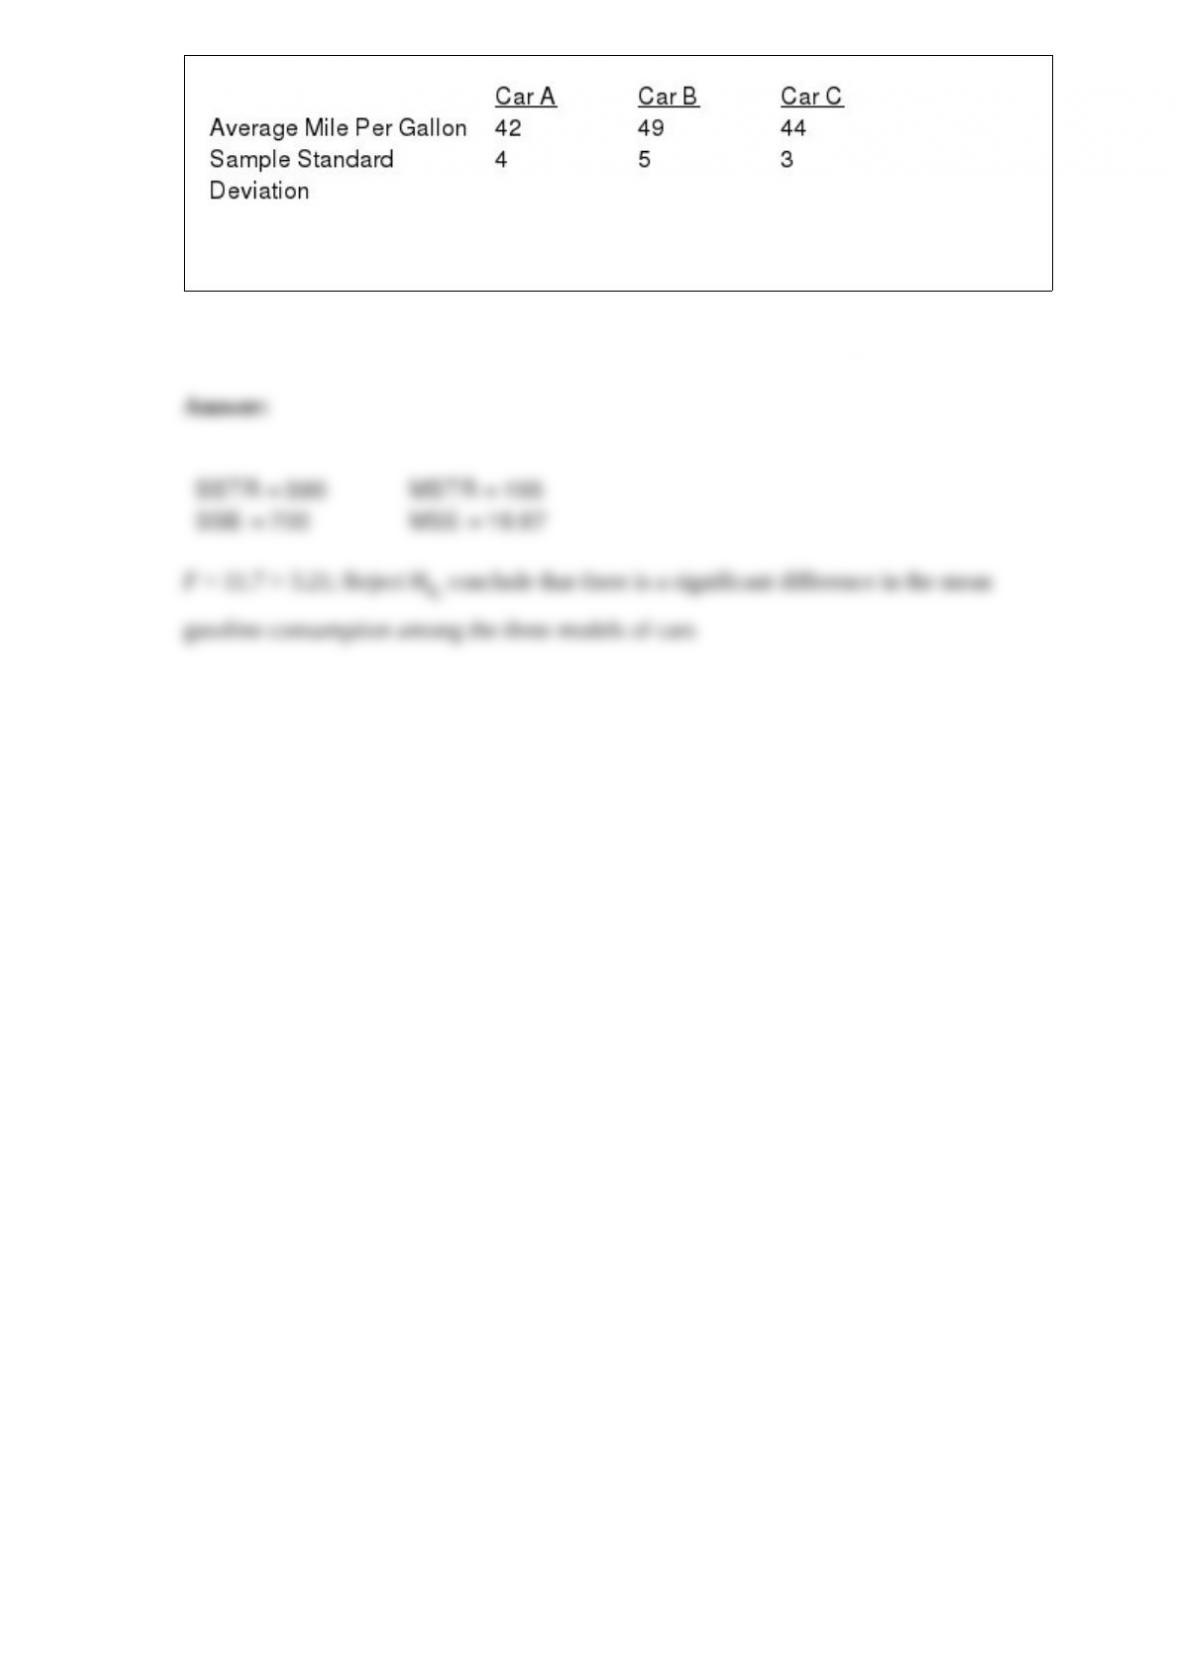
Use the above data and test to see if the mean gasoline consumption for all three models
of cars is the same. Let Alpha = 0.05.