
DFSS stands for
a. Defects Found Sifting and Sorting
b. Design For Six Sigma
c. Deviation From Specifications and Standards
d. Defer For Statistical Study
χ.9752 = 8.9066 indicates that
a. 97.5% of the chi-square values are greater than 8.9066.
b. 97.5% of the chi-square values are less than 8.9066.
c. 2.5% of the chi-square values are greater than 8.9066.
d. 5% of the chi-square values are more than 8.9066 from the mean.
In a sample of 800 students in a university, 360, or 45%, live in the dormitories. The
45% is an example of
a. a sample
b. a population
c. statistical inference

d. descriptive statistics
Using an 0.04, a confidence interval for a population proportion is determined to be
0.65 to 0.75. If the level of significance is decreased, the interval for the population
proportion
a. becomes narrower
b. becomes wider
c. does not change
d. Not enough information is provided to answer this question.
Data collected over several time periods are
a. time series data
b. time controlled data
c. cross-sectional data
d. time dependent data
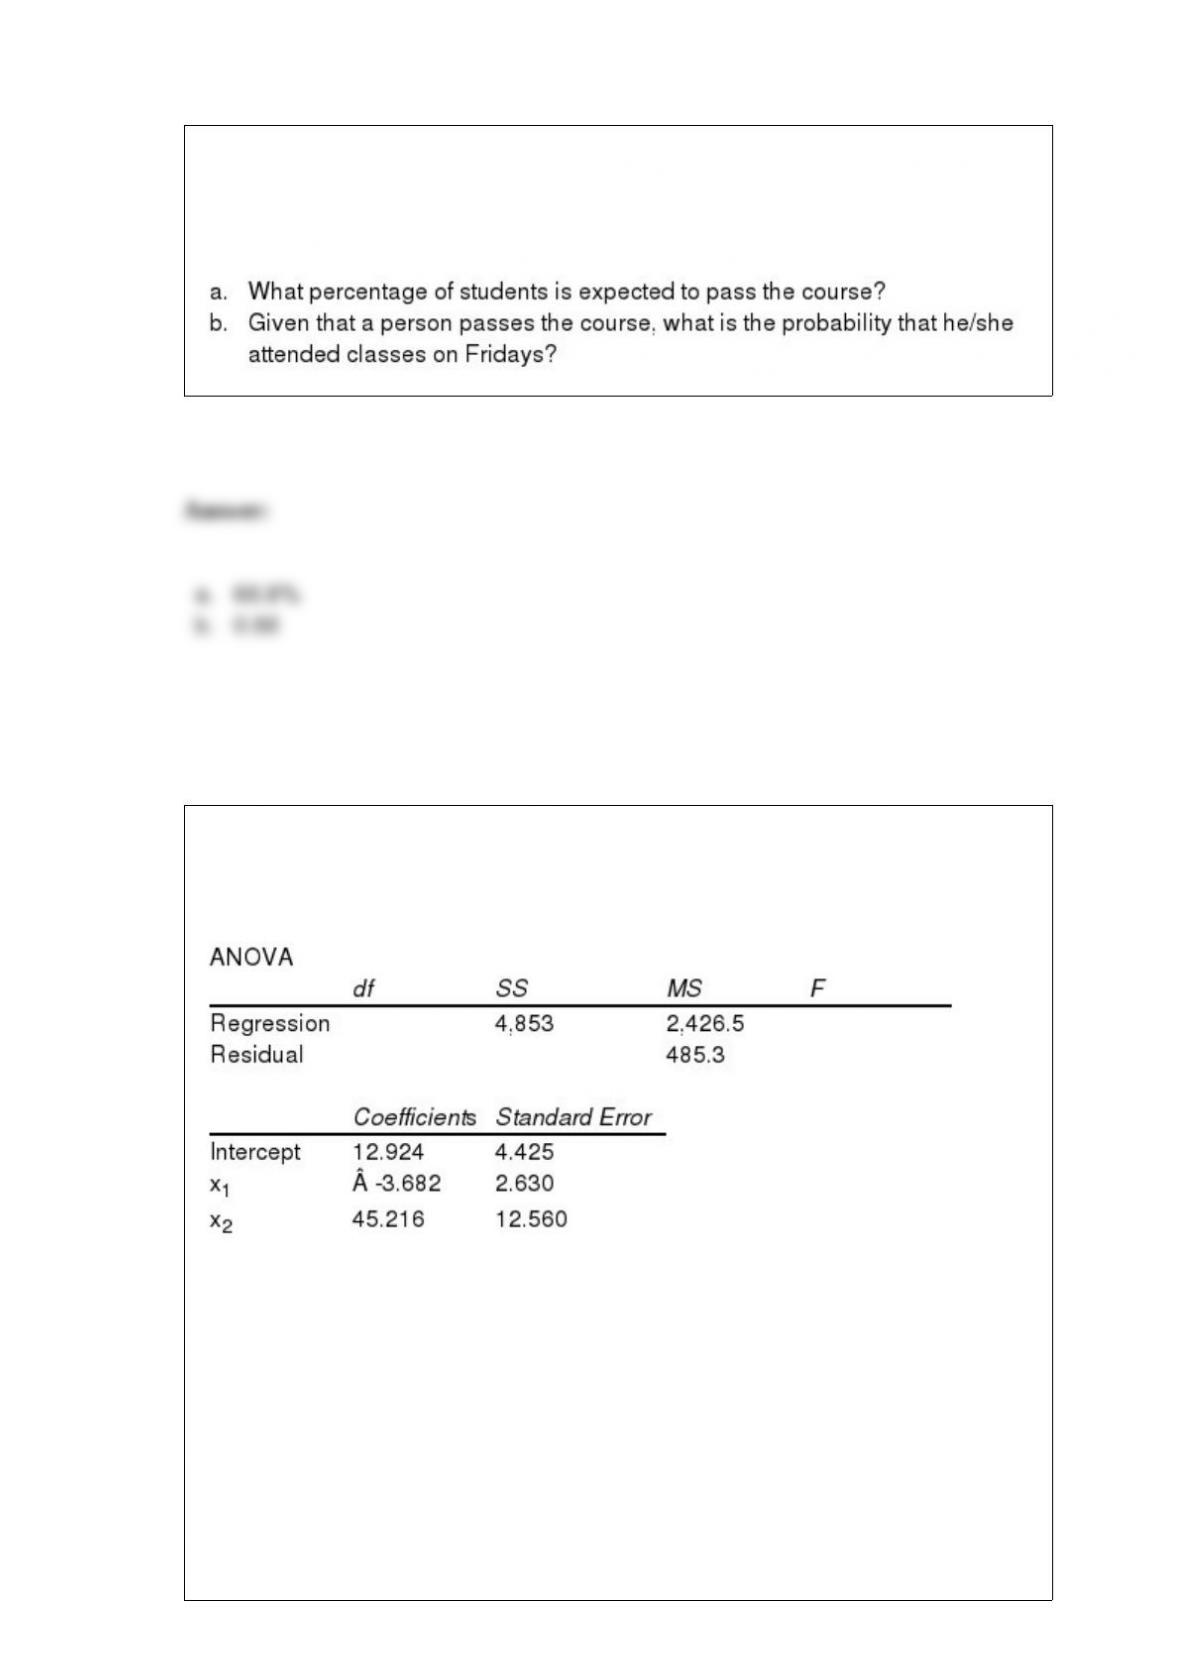
In a recent survey in a Statistics class, it was determined that only 60% of the students
attend class on Fridays. From past data it was noted that 98% of those who went to
class on Fridays pass the course, while only 20% of those who did not go to class on
Fridays passed the course.
Exhibit 15-6
Below you are given a partial Excel output based on a sample of 16 observations.
Refer to Exhibit 15-6. We want to test whether the parameter 1 is significant. The test
statistic equals
a. -1.4
b. 1.4
c. 3.6
d. 5

Exhibit 6-6
The life expectancy of a particular brand of tire is normally distributed with a mean of
40,000 and a standard deviation of 5,000 miles.
Refer to Exhibit 6-6. What is the probability that a randomly selected tire will have a
life of at least 47,500 miles?
a. 0.4332
b. 0.9332
c. 0.0668
d. None of the alternative answers is correct.
In practice, it is common to use the sample _____ to estimate the process _________.
a. variances, range
b. means, variance
c. standard deviations, mean
d. ranges, standard deviation

The correlation in error terms that arises when the error terms at successive points in
time are related is termed
a. leverage
b. multicorrelation
c. autocorrelation
d. parallel correlation
49. The forecasting model that makes use of the “least squares” method is
a. weighted moving average
b. exponential smoothing
c. moving average
d. regression
Exhibit 13-2

Refer to Exhibit 13-2. The null hypothesis
a. should be rejected
b. should not be rejected
c. should be revised
d. None of these alternatives is correct.
All of the following are true about a stationary time series except
a. its statistical properties are independent of time
b. a plot of the time series will always exhibit a horizontal pattern
c. the process generating the data has a constant mean
d. there is no variability in the time series over time
Whenever the population standard deviation is unknown, which distribution is used in
developing an interval estimate for a population mean?
a. standard distribution
b. z distribution

c. binomial distribution
d. t distribution
When using Excel’s BINOM.DIST function, one should choose TRUE for the fourth
input if
a. a probability is desired
b. a cumulative probability is desired
c. the expected value is desired
d. the correct answer is desired
The following results were obtained from a multiple regression analysis of supermarket
profitability. The dependent variable, y, is the profit (in thousands of dollars) and the
independent variables, x1 and x2, are the food sales and nonfood sales (also in
thousands of dollars).
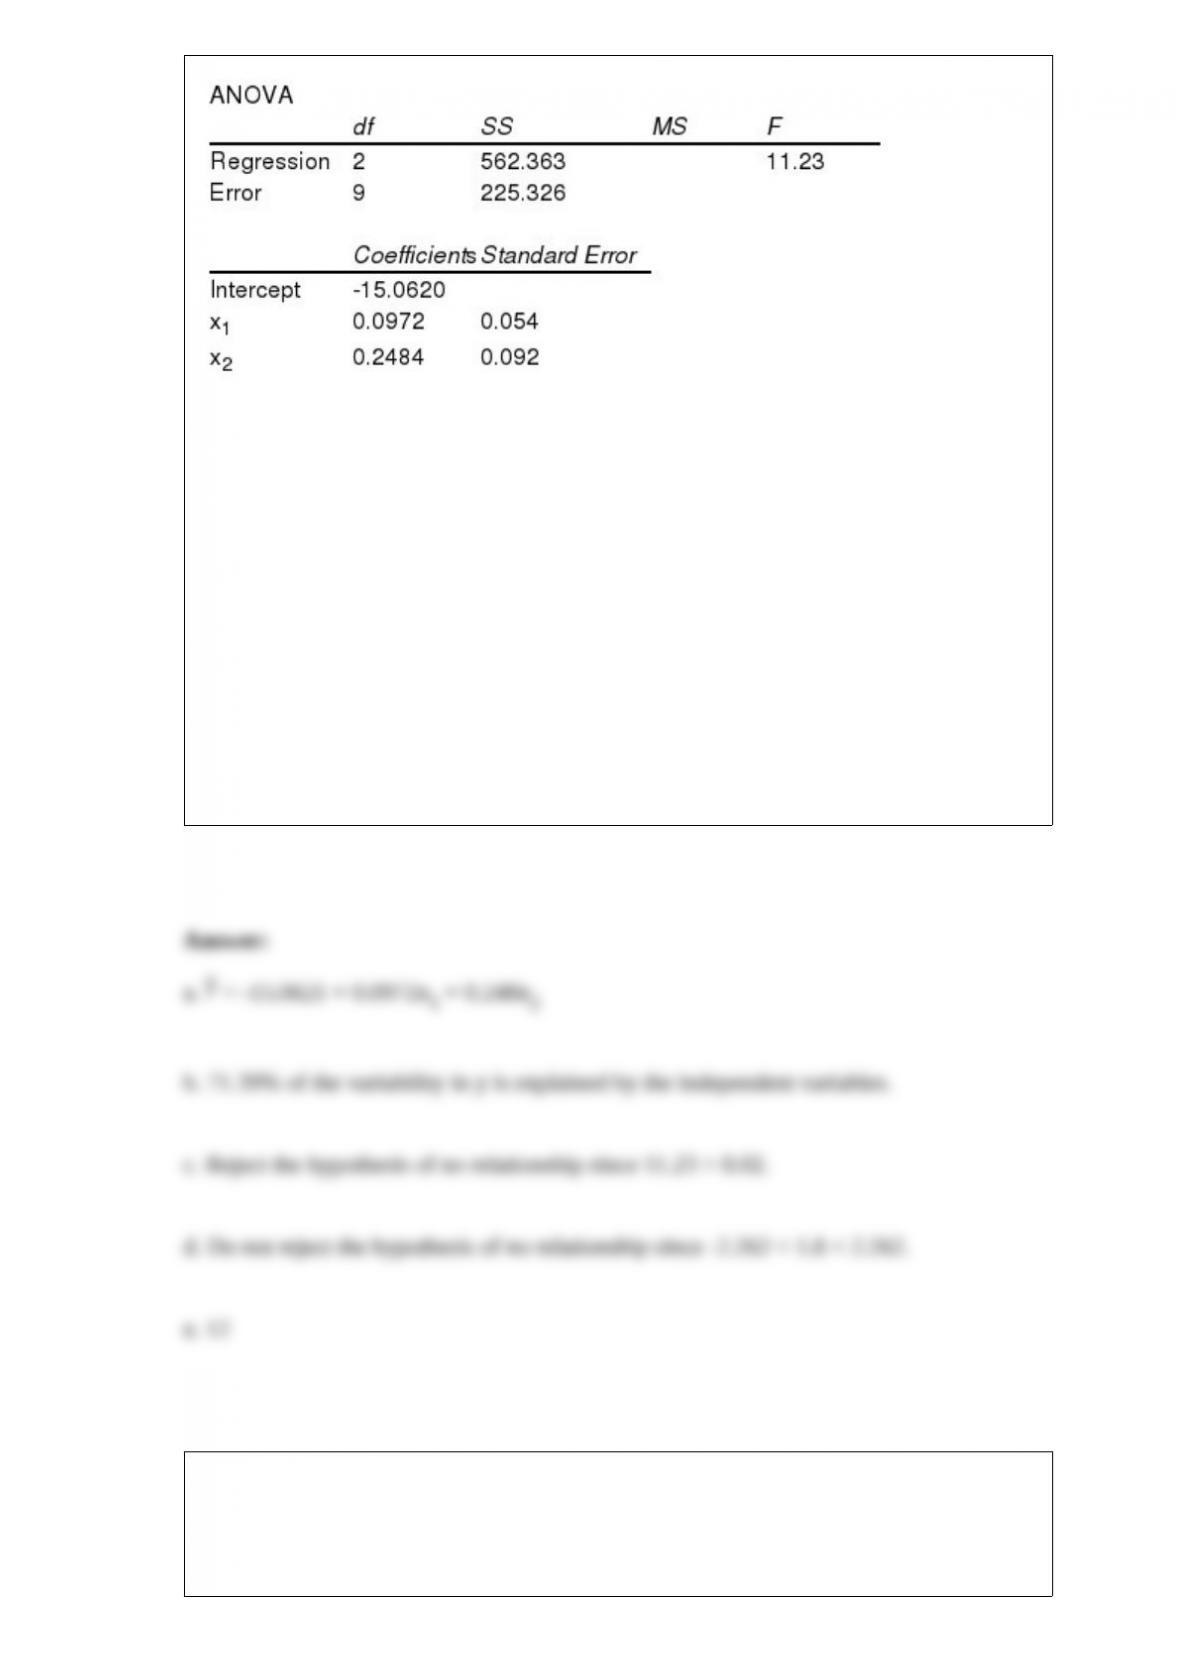
Coefficient of determination = 0.7139
a. Write the estimated regression equation for the relationship between the variables.
b. What can you say about the strength of this relationship?
c. Carry out a test of whether y is significantly related to the independent variables. Use
a .01 level of significance.
d. Carry out a test of whether x1 and y are significantly related. Use a .05 level of
significance.
e. How many supermarkets are in the sample used here?
The probability of an event is
a. the sum of the probabilities of the sample points in the event

b. the product of the probabilities of the sample points in the event
c. the minimum of the probabilities of the sample points in the event
d. the maximum of the probabilities of the sample points in the event
A production process produces 90% non-defective parts. A sample of 10 parts from the
production process is selected.
a. Define the random variable in words for this experiment.
b. What is the probability that the sample will contain 7 non-defective parts?
c. What is the probability that the sample will contain at least 4 defective parts?
d. What is the probability that the sample will contain less than 5 non-defective parts?
e. What is the probability that the sample will contain no defective parts?