15. It is believed that the median age of college students is 21 years. A sample of 80 college students is
taken. Thirty of the students were under 21, 45 of the students were over 21, and 10 were 21 years old.
a.
State the null and alternative hypotheses.
b.
Test the null hypothesis at the 1% level of significance.
a.
b.
Do not reject the null hypothesis since z = 1.73
16. We want to see if the workers on the day and night shifts differ significantly in their productivity
levels. A sample of workers from both shifts was taken.
Day Shift
Night Shift
Worker
Output
Worker
Output
1
31
1
31
2
32
2
25
3
26
3
29
4
34
4
30
5
24
5
27
6
35
6
33
7
39
7
37
8
28
8
39
9
44
9
38
10
42
10
36
11
40
a.
State the null and alternative hypotheses.
b.
Test the null hypothesis at the 5% level of significance.
a.
significantly in their productivity levels
17. The manager of a company believes that differences in sales performance depend upon the
salesperson’s age. Independent samples of salespeople were taken and their weekly sales record is
reported below.
Below 30 Years
Number of Sales
Between 30 & 45 Years
Number of Sales
Over 45 Years
Number of Sales
24
23
30
b.
Reject the null hypothesis since z = 2.94.
16
17
20
21
22
23
15
25
25
19
18
34
26
29
36
27
28
a.
State the null and alternative hypotheses.
b.
Test the null hypothesis at the 5% level.
18. Two faculty members ranked 12 candidates for scholarships. Calculate the Spearman rank-correlation
coefficient and test whether the professors had significantly different rankings. Use the .02 level of
significance.
Candidate
Rank by
Professor A
Rank by
Professor B
1
6
5
2
10
11
3
2
6
4
1
3
5
5
4
6
11
12
7
4
2
8
3
1
9
7
7
10
12
10
11
9
8
12
8
9
19. A comprehensive statistics examination is given to 16 students in order to determine whether or not
there is a significant difference in the performance of students majoring in the various disciplines of
Business Administration. The following data show the scores of the 16 students (5 majoring in
accounting, 6 majoring in management, and 5 majoring in marketing).
Accounting
Management
Marketing
91
63
95
80
92
80
70
86
70
a.
salesperson’s age

60
75
60
85
70
90
99
At = 0.05 level of significance, test to see if there is a significant difference in the performance of
the students in the three majors.
20. A survey of male and female students showed the following ranking of 12 professors in the
management department:
Professor
Ranking by
Female Students
Ranking by
Male Students
1
7
8
2
8
7
3
1
2
4
2
3
5
9
1
6
3
10
7
10
9
8
11
4
9
4
6
10
6
11
11
12
5
12
5
12
Do the rankings given by the female students agree with the rankings given by the male students? Use
= 0.05.
21. Two individuals were asked to rank the performances of eight different automobiles. The following
show their rankings.
Automobile
Ranking by
First Person
Ranking by
Second Person
1
3
2
2
5
1
3
1
4
4
6
7
5
2
5
6
4
8
7
7
6
8
8
3

Determine the Spearman rank-correlation coefficient and test for a significant correlation with =
0.05.
22. Two groups of students were asked to rank the activities sponsored by the Student Government
Association on campus. The following show their rankings.
Activity
Resident
Student Ranking
Nonresident
Student Ranking
1
3
6
2
1
2
3
8
5
4
2
1
5
5
7
6
7
8
7
4
3
8
6
4
Determine the Spearman rank-correlation coefficient and test for a significant correlation with =
0.05.
23. Two faculty members (X and Y) ranked five candidates for scholarships. The rankings are shown
below.
Candidate
Rank By X
Rank By Y
Peter
5
1
Nancy
2
2
Michael
1
3
Mary
3
5
Judy
4
4
Compute the Spearman rank-correlation and test it for significance. Let = 0.05.
24. Three universities in your state have decided to administer the same comprehensive examination to the
recipients of MBA degrees. From each institution, a random sample of MBA recipients has been
selected and given the test. The following table shows the scores of the students from each university.
Northern
University
Central
University
Southern
University
56
62
94
85
97
72
65
91
93
86
82
78
93
54
77
Use the Kruskal-Wallis test to determine if there is a significant difference in the average scores of the
students from the three universities. Let = 0.01.
25. A market research firm is conducting a study to determine which of two package designs for a liquid
soap product potential customers prefer, the current design (A) or a new design (B). A sample of 20
potential customers is taken. The results follow.
Design Preferences
A
B
B
B
A
B
B
A
B
A
B
B
B
A
A
B
B
B
A
A
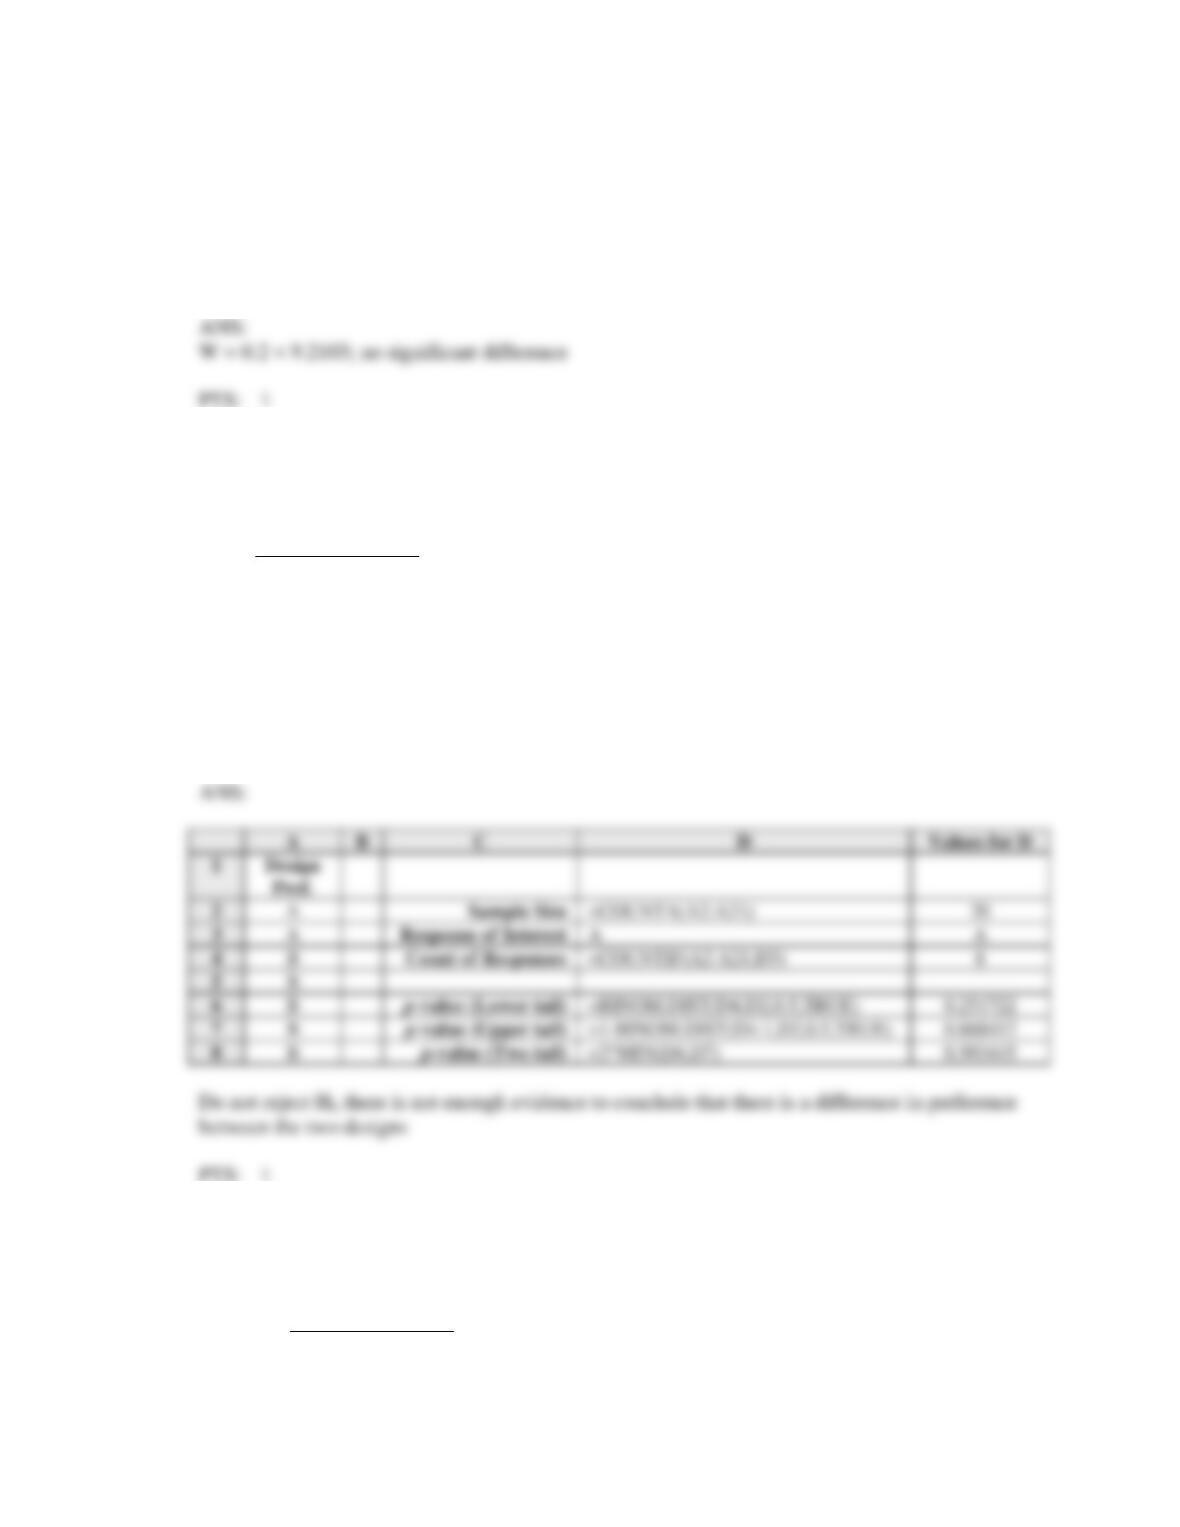
Use Excel to conduct the appropriate hypothesis test at = .05 to determine if the data indicate that
there is a difference in preference between the two designs.
26. A market research firm is conducting a study to determine which of two package designs for a liquid
soap product potential customers prefer, the current design (A) or a new design (B). A sample of 40
potential customers is taken. The results follow.
Design Preferences
A
A
A
A
B
A
B
B
A
B
B
B
B
B
B
B
B
A
A
B
B
B
B
A
A
B
A
B
A
A
B
A
B
B
B
A
B
B
A
B
Use Excel to conduct the appropriate hypothesis test at = .05 to determine if the data indicate that
there is a difference in preference between the two designs.
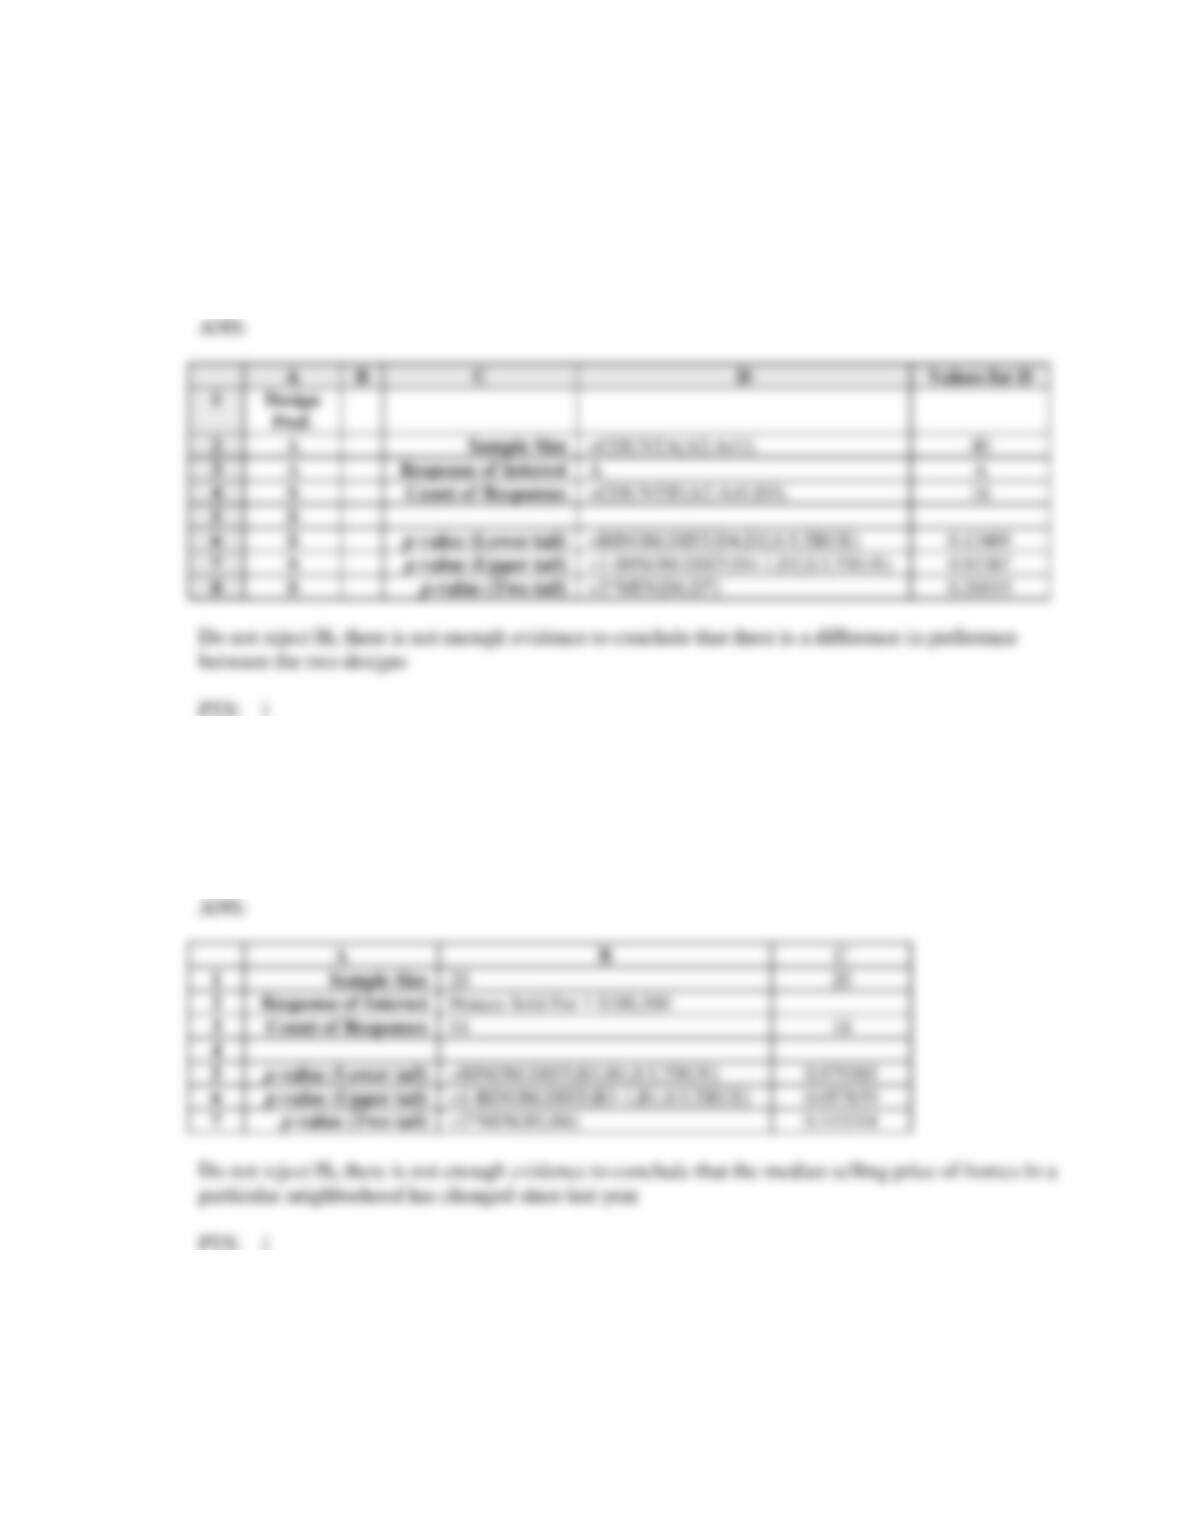
27. A real estate agency conducts a study to determine if the median selling price of homes in a particular
neighborhood has changed since last year. Last year the median selling price was $188,500. The
agency randomly selects 20 recently sold homes in that particular neighborhood and finds that 14 of
the homes sold for more than $188,500 and that 6 of the homes sold for less than $188,500. Use Excel
to conduct the appropriate hypothesis test at = .10.
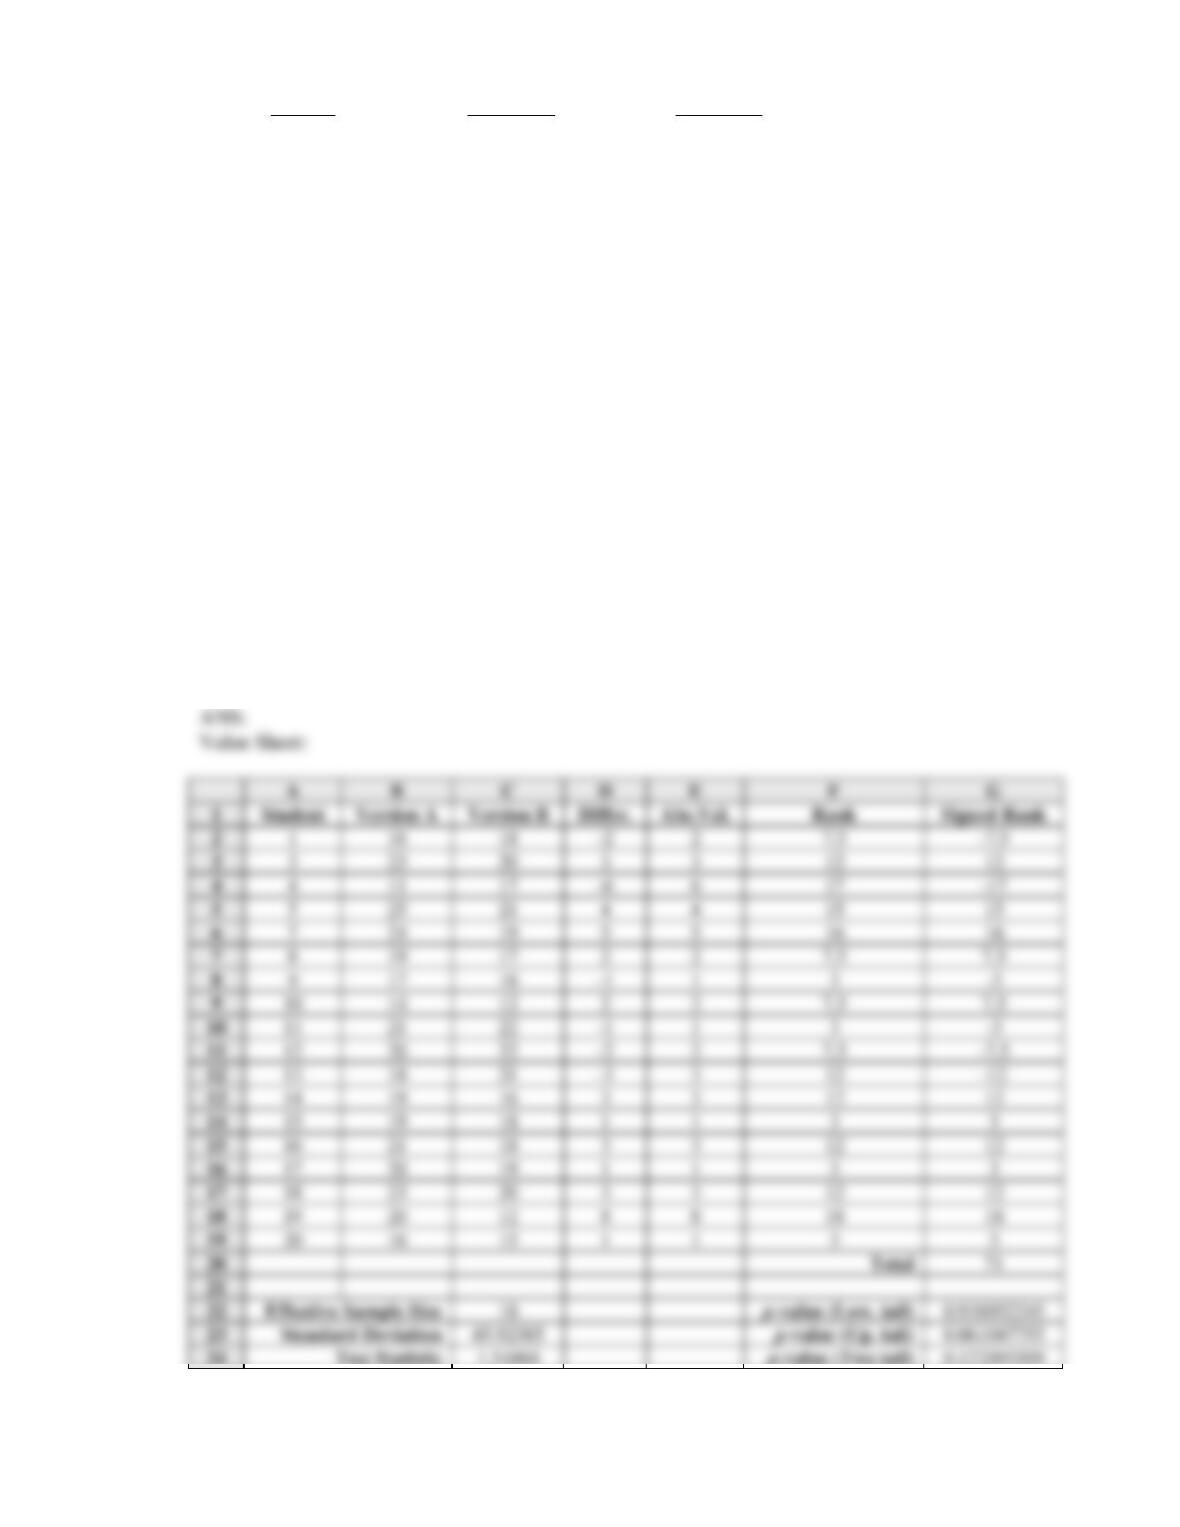
28. A large company that develops, distributes, and grades national standardized examinations wants to
pilot test a new examination. A group of 20 students is used for the study. Each student is given two
versions of the examination. The order in which the students take the examinations is randomly
assigned. The students’ scores follow.
Student
Version A
Version B
1
16
18
2
20
20
3
23
20
4
11
17
5
25
21
6
21
21
7
24
19
8
19
17
9
17
18
10
14
12
11
21
22
12
20
22
13
18
21
14
19
16
15
19
18
16
21
18
17
20
19
18
23
20
19
20
12
20
16
15
Use Excel to test to determine if the differences in the students’ scores between the two versions of the
examination are significantly different. Use = .10.
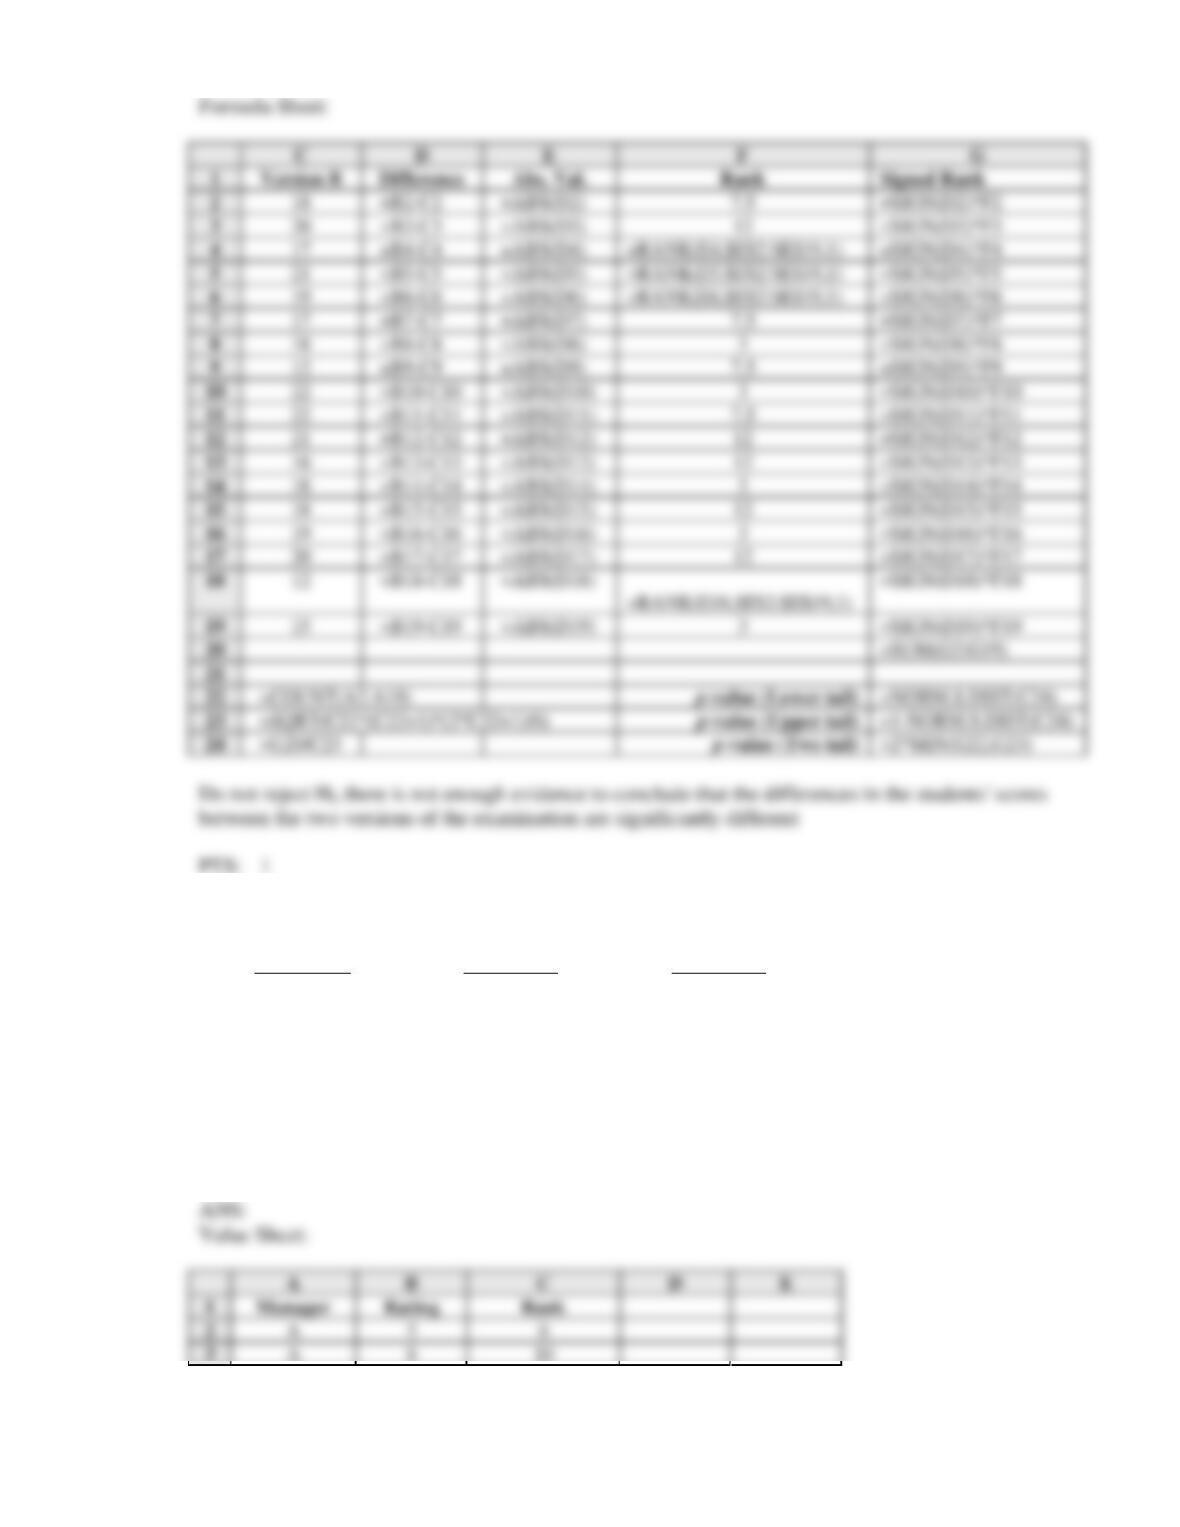
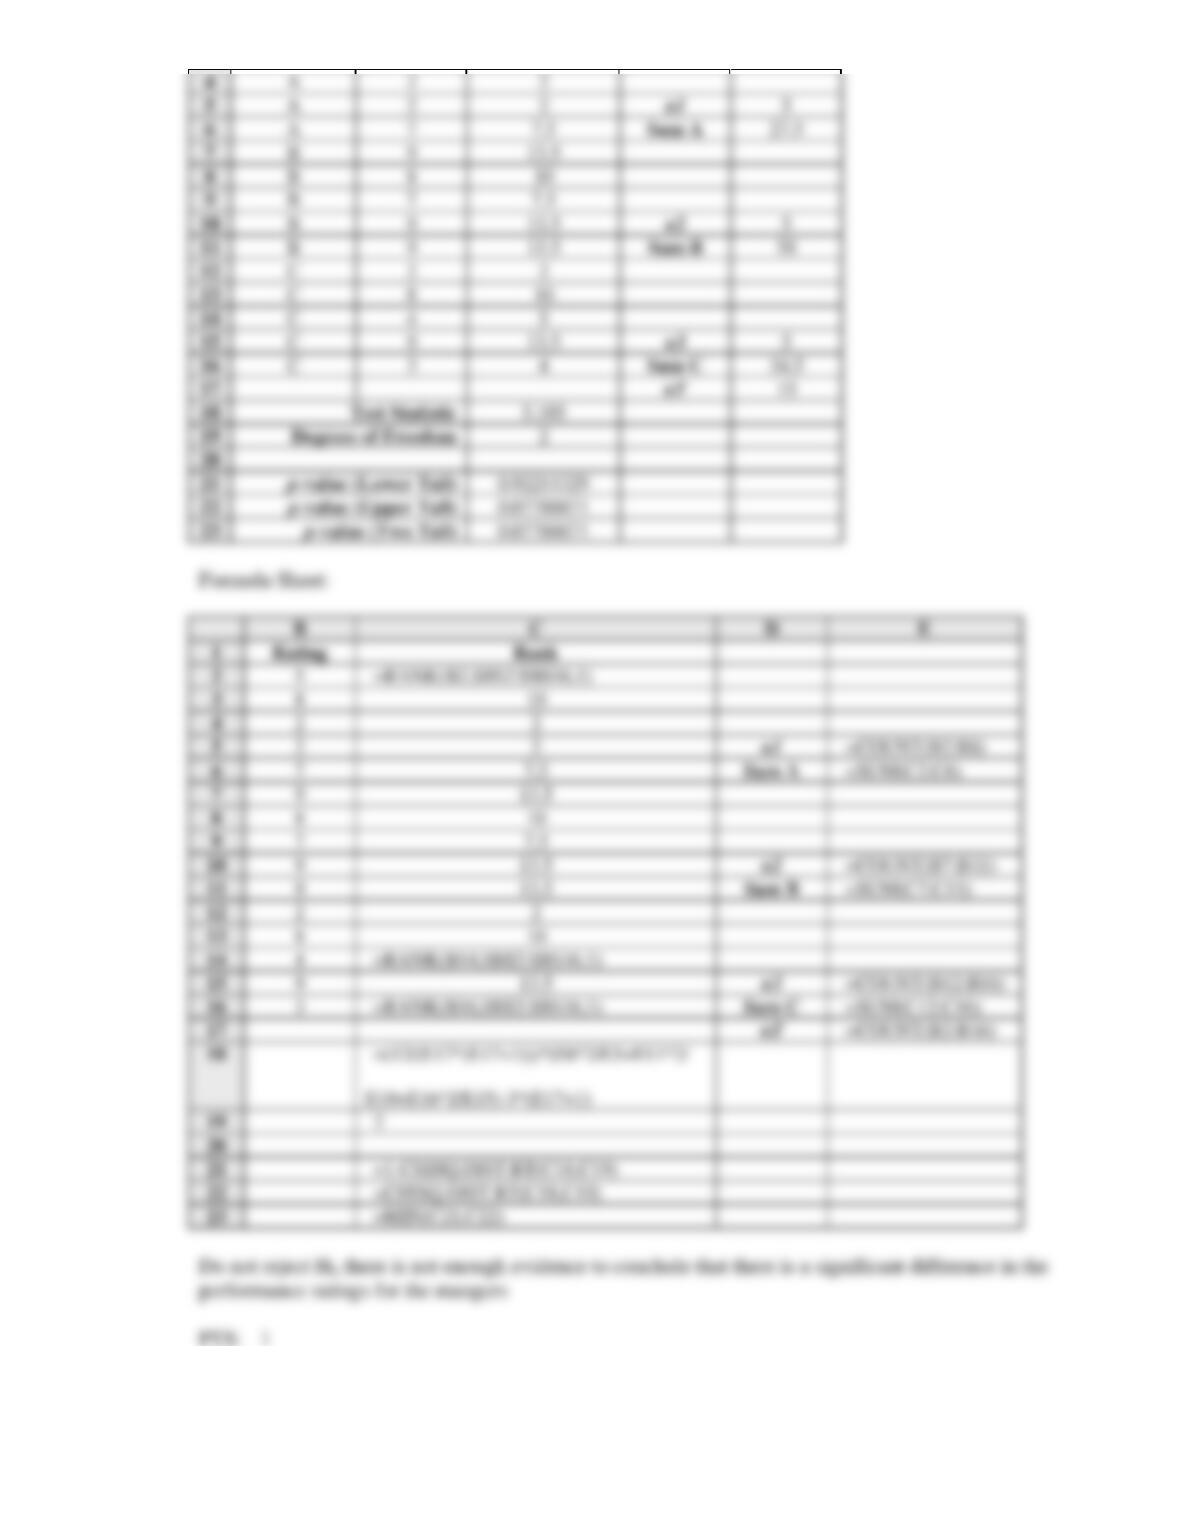
29. Three managers received the following performance ratings from a group of 15 employees.
Manager A
Manager B
Manager C
5
9
2
8
8
8
2
7
4
2
9
9
7
9
3
Use Excel to perform the appropriate test at = .05 to determine whether there is a significant
difference in the performance ratings for the mangers.
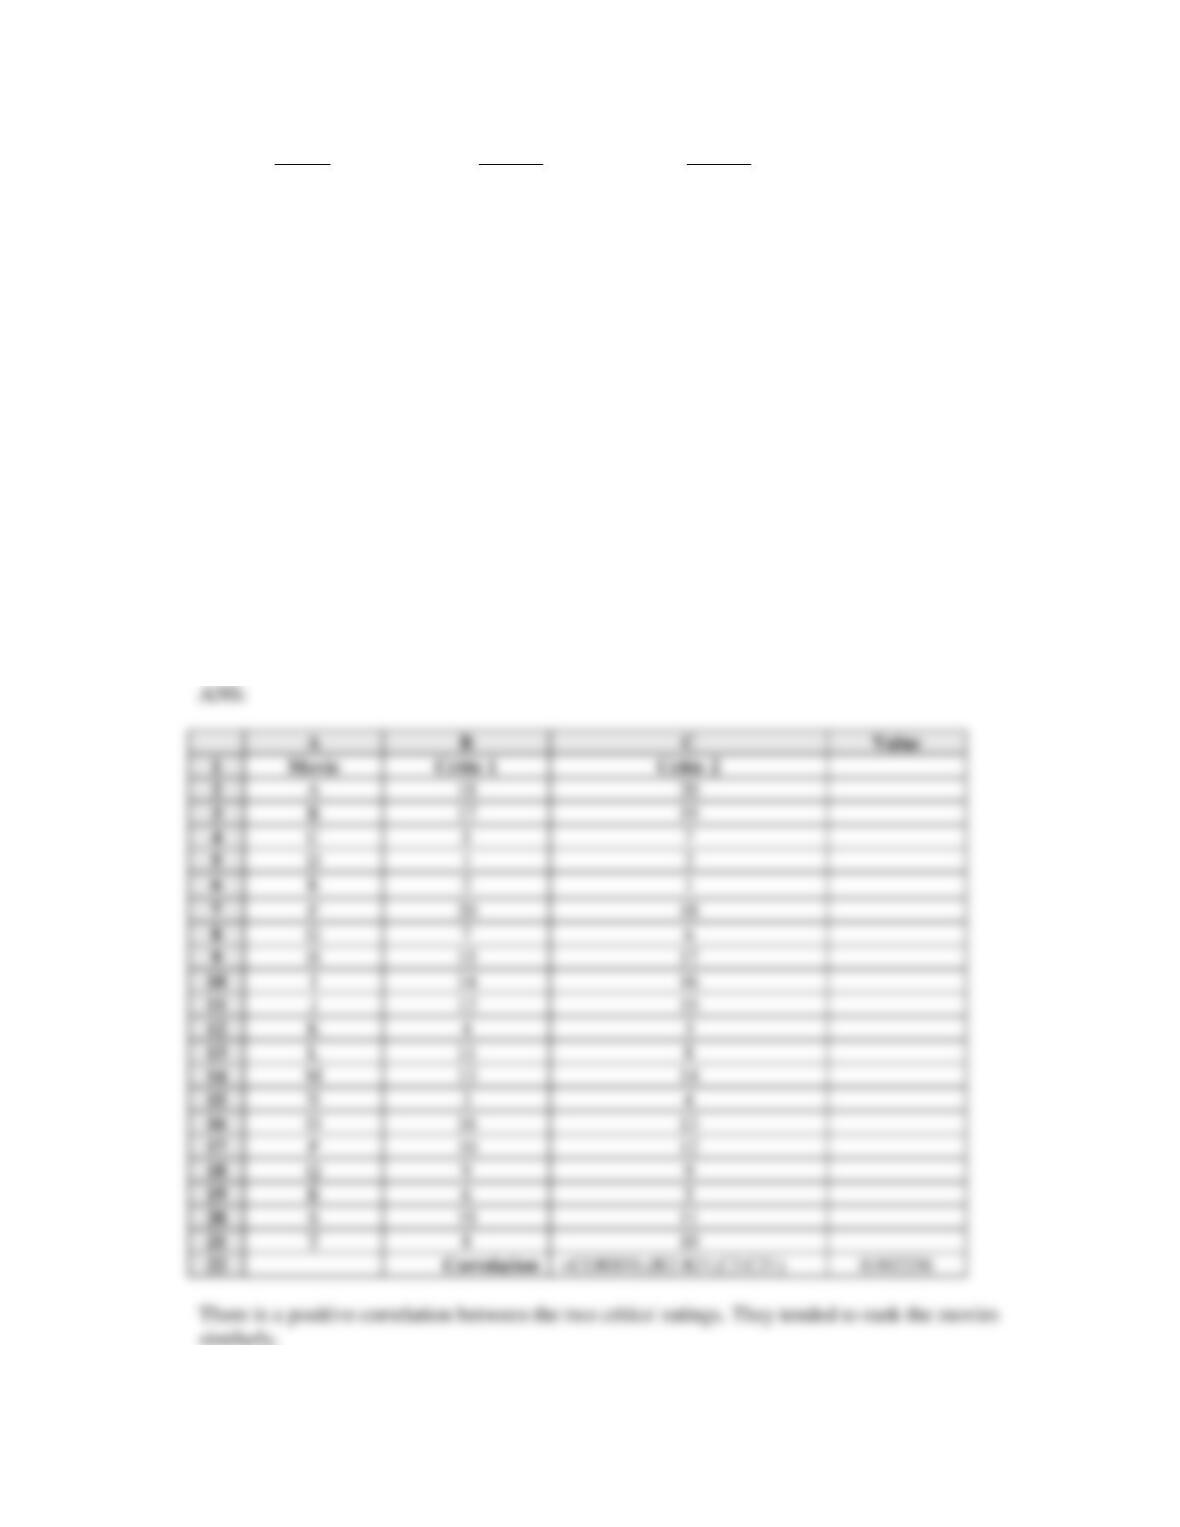
30. Two movie critics have independently ranked the top 20 movies of the year. Their rankings follow.
Use Excel to calculate the Spearman correlation coefficient and then interpret its value.
Movie
Critic 1
Critic 2
A
18
20
B
17
19
C
5
7
D
1
2
E
2
1
F
20
18
G
7
6
H
15
17
I
14
16
J
12
15
K
4
3
L
11
8
M
13
14
N
3
4
O
16
13
P
10
12
Q
9
9
R
6
5
S
19
11
T
8
10
31. A market researcher is asked to compare the responses to two questions on a customer satisfaction
survey that was completed by 20 consumers. The first question asks the respondents to rate the
product’s quality and the second question asks the respondents to rate the product’s ease of use. The
results follow. Use Excel to calculate the Spearman correlation coefficient and then interpret its value.
Respondent
Quality
Ease
A
7
1
B
2
6
C
2
5
D
5
5
E
6
4
F
4
4
G
1
5
H
1
4
I
7
3
J
3
5
K
5
5
L
4
4
M
6
2
N
6
2
O
2
5
P
4
4
Q
5
6
R
2
6
S
2
6
T
2
7
32. The Suburbia Health Department inspects restaurants for compliance to laws regulating the storage,
preparation, and serving of food to the public. Two of the department’s inspectors ranked ten
restaurants in terms of cleanliness as shown below (with a 1 indicating cleanest and 10 indicating least
clean). Use rank correlation, with
= .05, to comment on the agreement of the two inspectors’
rankings.
Restaurant
A
B
C
D
E
F
G
H
I
J
Inspector #1
3
6
10
4
1
5
2
8
7
9
Inspector #2
1
5
9
2
3
7
6
10
4
8
33. Rebecca Roush, Manager of the Home Square (home improvement) store in Athens, would like to
determine whether an employee’s number of years practicing his/her trade prior to working in retail is
the same for employees in the plumbing, electrical, and paint departments.
Data on the number of trade-practice years were available for 20 employees and are listed below.
Test whether the three populations are identical in terms of number of years of trade-practical
experience. Use
= .05.
Plumbing
Electrical
Paint
13
17
11
9
22
5
21
14
8
17
9
17
8
18
10
11
28
6
16
12
34. The print capacity of ink cartridges in computer printers is a concern to many buyers due to the cost of
cartridges. The observed print capacities (in number of pages) of black ink cartridges in a sample of
12 Epsmark printers and a sample of 12 Lexson printers are shown below. Do the data indicate, using
= .10, that a difference exists in the print capacities associated with the two brands of printers?
Epsmark
Lexson
912
855
854
912
903
877
909
893
878
922
866
874
934
866
881
859
890
880
898
897
906
909
905
882