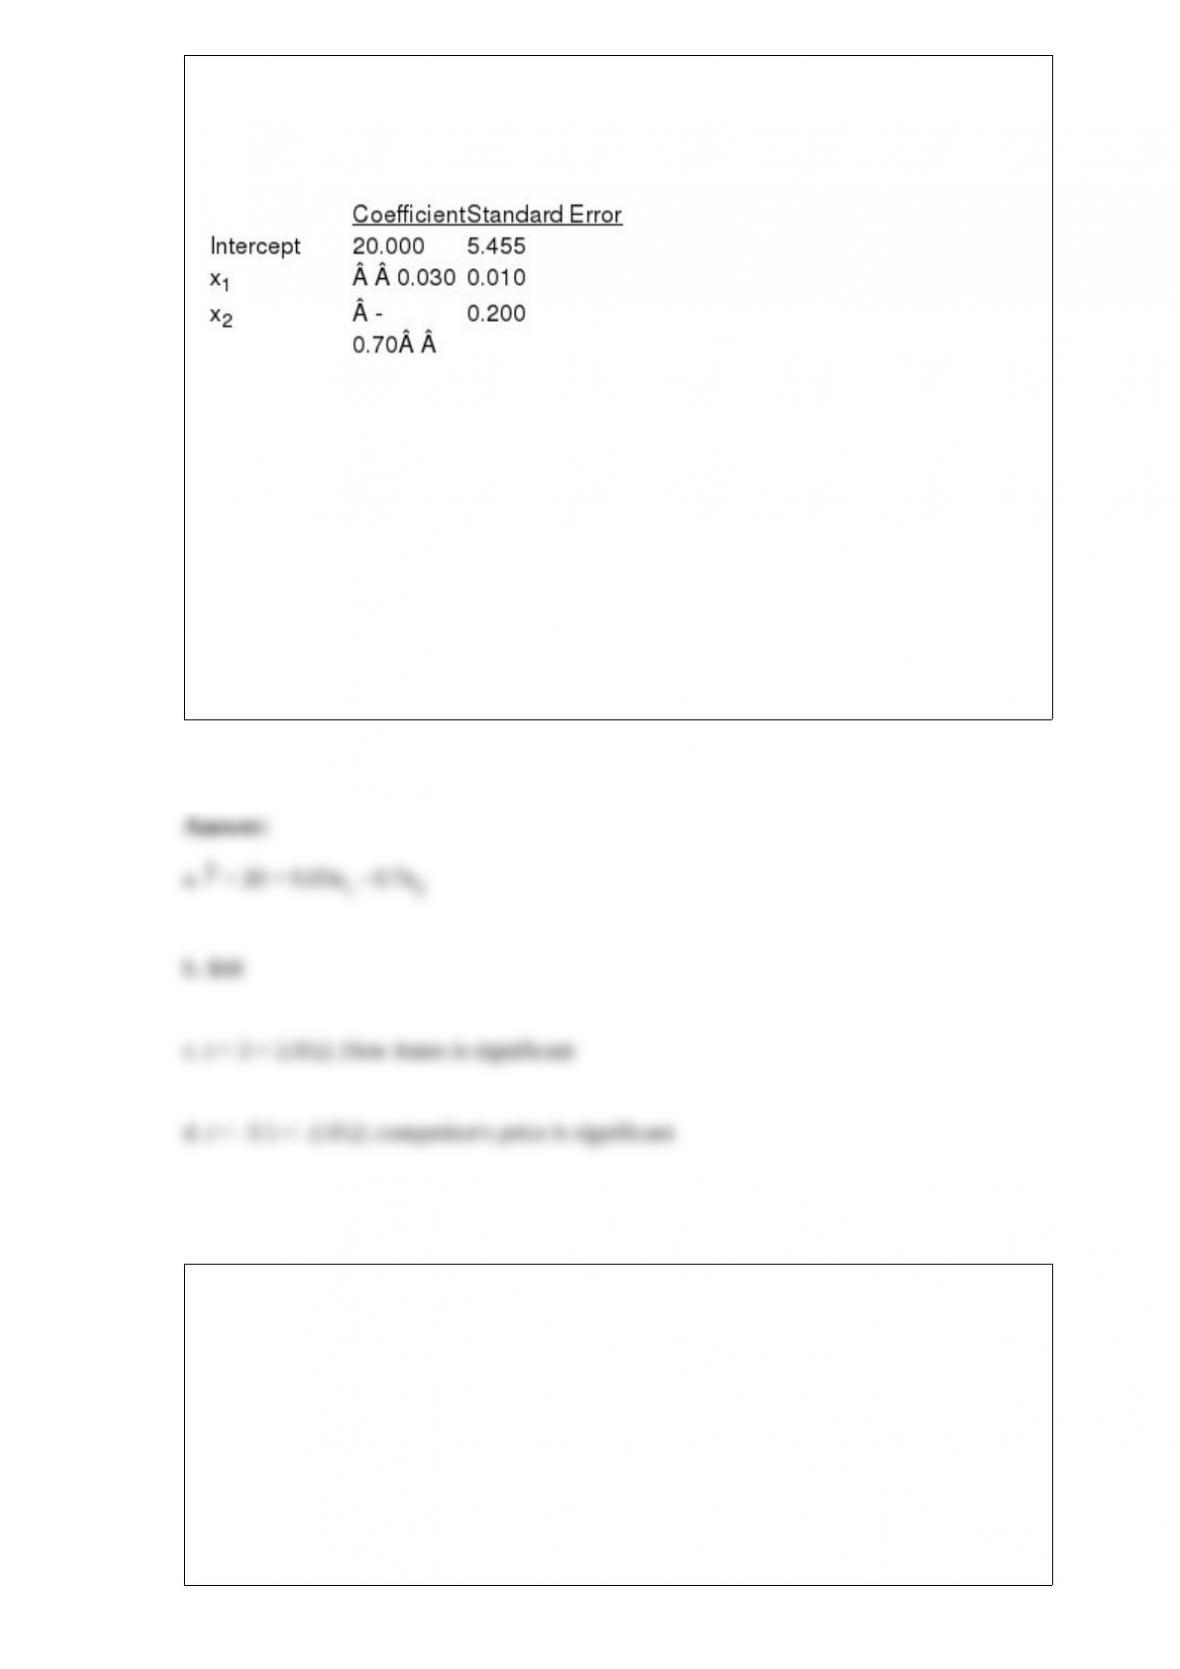
Below you are given a partial Excel output based on a sample of 30 days of the price of
a company’s stock (y in dollars), the Dow Jones industrial average (x1), and the stock
price of the company’s major competitor (x2 in dollars).
a. Use the output shown above and write an equation that can be used to predict the
price of the stock.
b. If the Dow Jones Industrial Average is 2650 and the price of the competitor is $45,
what would you expect the price of the stock to be?
c. At = 0.05, test to determine if the Dow Jones average is a significant variable.
d. At = 0.05, test to determine if the stock price of the major competitor is a
significant variable.
Exhibit 11-1
Last year, the standard deviation of the ages of the students at UA was 1.81 years.
Recently, a sample of 10 students had a standard deviation of 2.1 years. We are
interested in testing to see if there has been a significant change in the standard
deviation of the ages of the students at UA.
Refer to Exhibit 11-1. At 95% confidence the null hypothesis
a. should be rejected

b. should not be rejected
c. should be revised
d. None of these alternatives is correct.
A nonparametric version of the Parametric analysis of variance test is the
a. Kruskal-Wallis Test
b. Mann-Whitney-Wilcoxon Test
c. sign test
d. Wilcoxon signed-rank test
__________ is a spreadsheet package.
a. Statistical inference
b. The bar chart
c. The New York Stock Exchange
d. Microsoft Excel
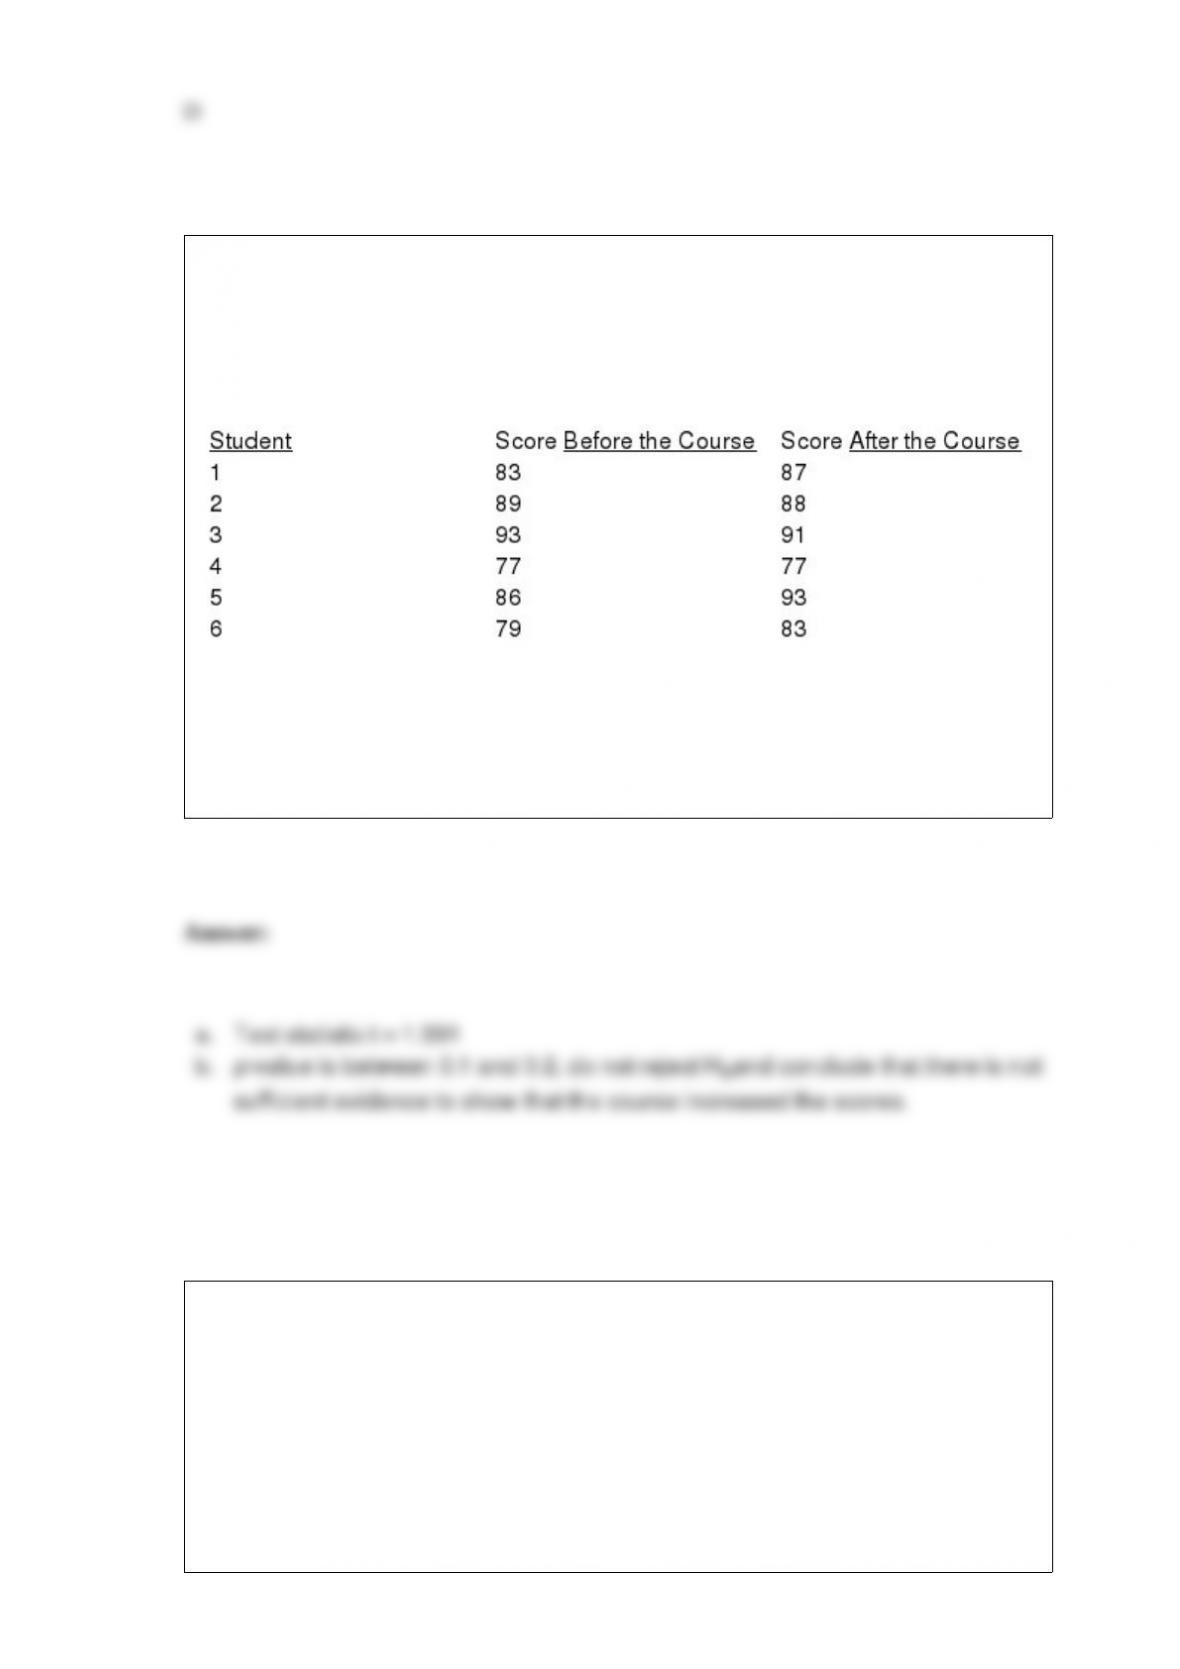
In order to determine whether or not a driver’s education course improves the scores on
a driving exam, a sample of 6 students were given the exam before and after taking the
course. The results are shown below.
Let d = Score After – Score Before.
a. Compute the test statistic.
b. At 95% confidence using the p-value approach, test to see if taking the course
actually increased scores on the driving exam.
Excel’s RAND function
a. determines sample size
b. selects a simple random sample
c. randomizes a population
d. generates random numbers

Regression analysis is a statistical procedure for developing a mathematical equation
that describes how
a. one independent and one or more dependent variables are related
b. several independent and several dependent variables are related
c. one dependent and one or more independent variables are related
d. None of these answers is correct.
38. Excel’s CHISQ.DIST function can be used to perform
a. a multinomial goodness of fit test
b. a Poisson distribution goodness of fit test
c. a Normal distribution goodness of fit test
d. All of the other ANSWERs are correct
A machine is used in a production process. From past data, it is known that 97% of the
time the machine is set up correctly. Furthermore, it is known that if the machine is set
up correctly, it produces 95% acceptable (non-defective) items. However, when it is set
up incorrectly, it produces only 40% acceptable items.
a. An item from the production line is selected. What is the probability that the selected
item is non-defective?
b. Given that the selected item is non-defective, what is the probability that the machine
is set up correctly?
c. What method of assigning probabilities was used here?
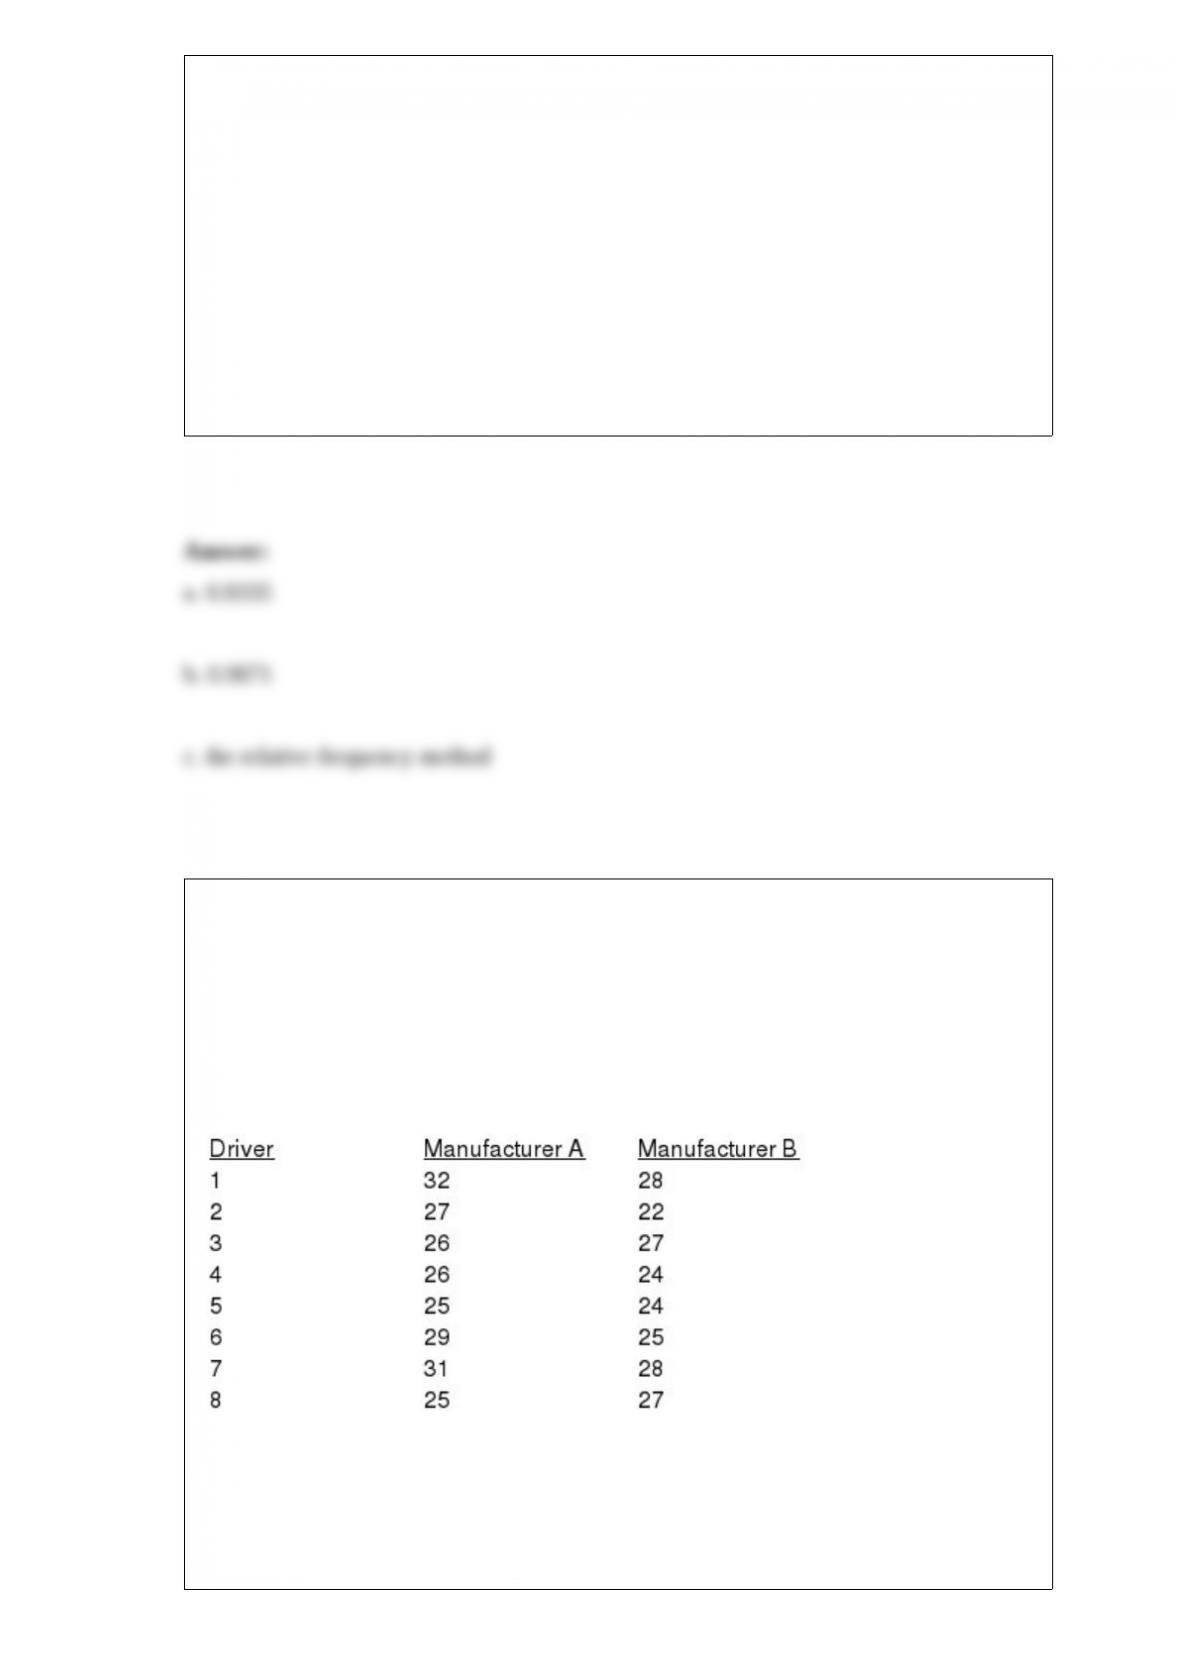
Exhibit 10-9
Two major automobile manufacturers have produced compact cars with the same size
engines. We are interested in determining whether or not there is a significant difference
in the MPG (miles per gallon) of the two brands of automobiles. A random sample of
eight cars from each manufacturer is selected, and eight drivers are selected to drive
each automobile for a specified distance. The following data show the results of the test.
Refer to Exhibit 10-9. The test statistic is
a. 1.645

b. 1.96
c. 2.096
d. 2.256
Exhibit 8-2
The manager of a grocery store has taken a random sample of 100 customers. The
average length of time it took these 100 customers to check out was 3.0 minutes. It is
known that the standard deviation of the checkout time is one minute.
Refer to Exhibit 8-2. The 95% confidence interval for the average checkout time of all
customers is
a. 3 to 5
b. 1.36 to 4.64
c. 2.804 to 3.196
d. 1.04 to 4.96
A numerical measure of linear association between two variables is the
a. variance
b. z-score
c. correlation coefficient
d. None of the other answers are correct.

Nonparametric methods which can be used to make inferences about a population
without requiring an assumption about the distribution of the population are called
a. continuity-correction methods
b. non-probabilistic methods
c. distribution-free methods
d. non-quantitative methods
Exhibit 11-2
We are interested in determining whether or not the variances of the sales at two music
stores (A and B) are equal. A sample of 25 days of sales at store A has a sample
standard deviation of 30 while a sample of 16 days of sales from store B has a sample
standard deviation of 20.
Refer to Exhibit 11-2. The test statistic is
a. 1.50
b. 0.67
c. 1.56
d. 2.25
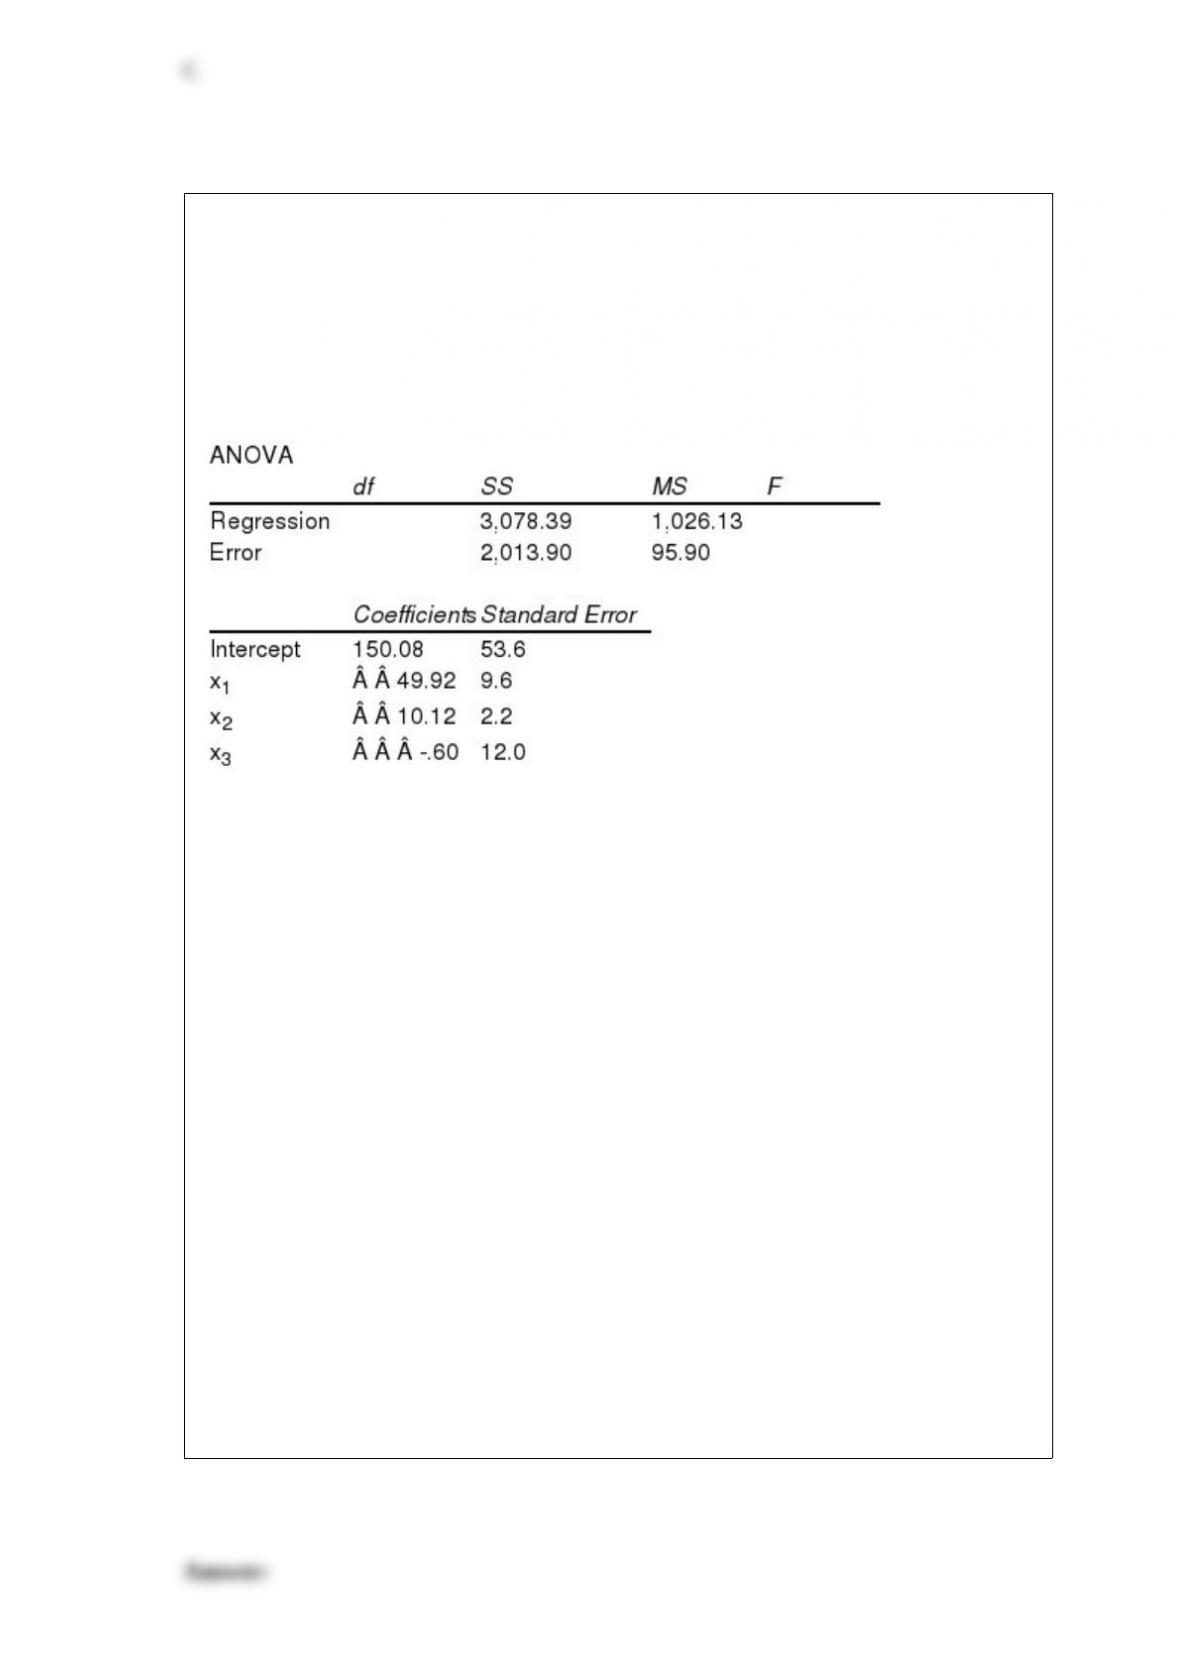
A sample of 25 families was taken. The objective of the study was to estimate the
factors that determine the monthly expenditure on food for families. The independent
variables included in the analysis were the number of members in the family (x1), the
number of meals eaten outside the home (x2), and a dummy variable (x3) that equals 1
if a family member is on a diet and equals 0 if there is no family member on a diet. The
following results were obtained.
a. Write out the estimated regression equation.
b. Interpret all coefficients.
c. Compute the appropriate t ratios.
d. Test for the significance of 1, 2, and 3 at the 1% level of significance.
e. What are the degrees of freedom for the sum of squares explained by the regression
(SSR) and the sum of squares due to error (SSE)?
f. Test whether or not there is a significant relationship between the monthly
expenditure on food and the independent variables. Use a .01 level of significance. Be
sure to state the null and alternative hypotheses.
g. Compute the coefficient of determination and explain its meaning.
h. Estimate the monthly expenditure on food for a family that has 4 members, eats out 3
times, and does not have any member of the family on a diet.
i. At 95% confidence determine which parameter is not statistically significant.
A sample point refers to a(n)
a. numerical measure of the likelihood of the occurrence of an event

b. set of all possible experimental outcomes
c. individual outcome of an experiment
d. All of these answers are correct.