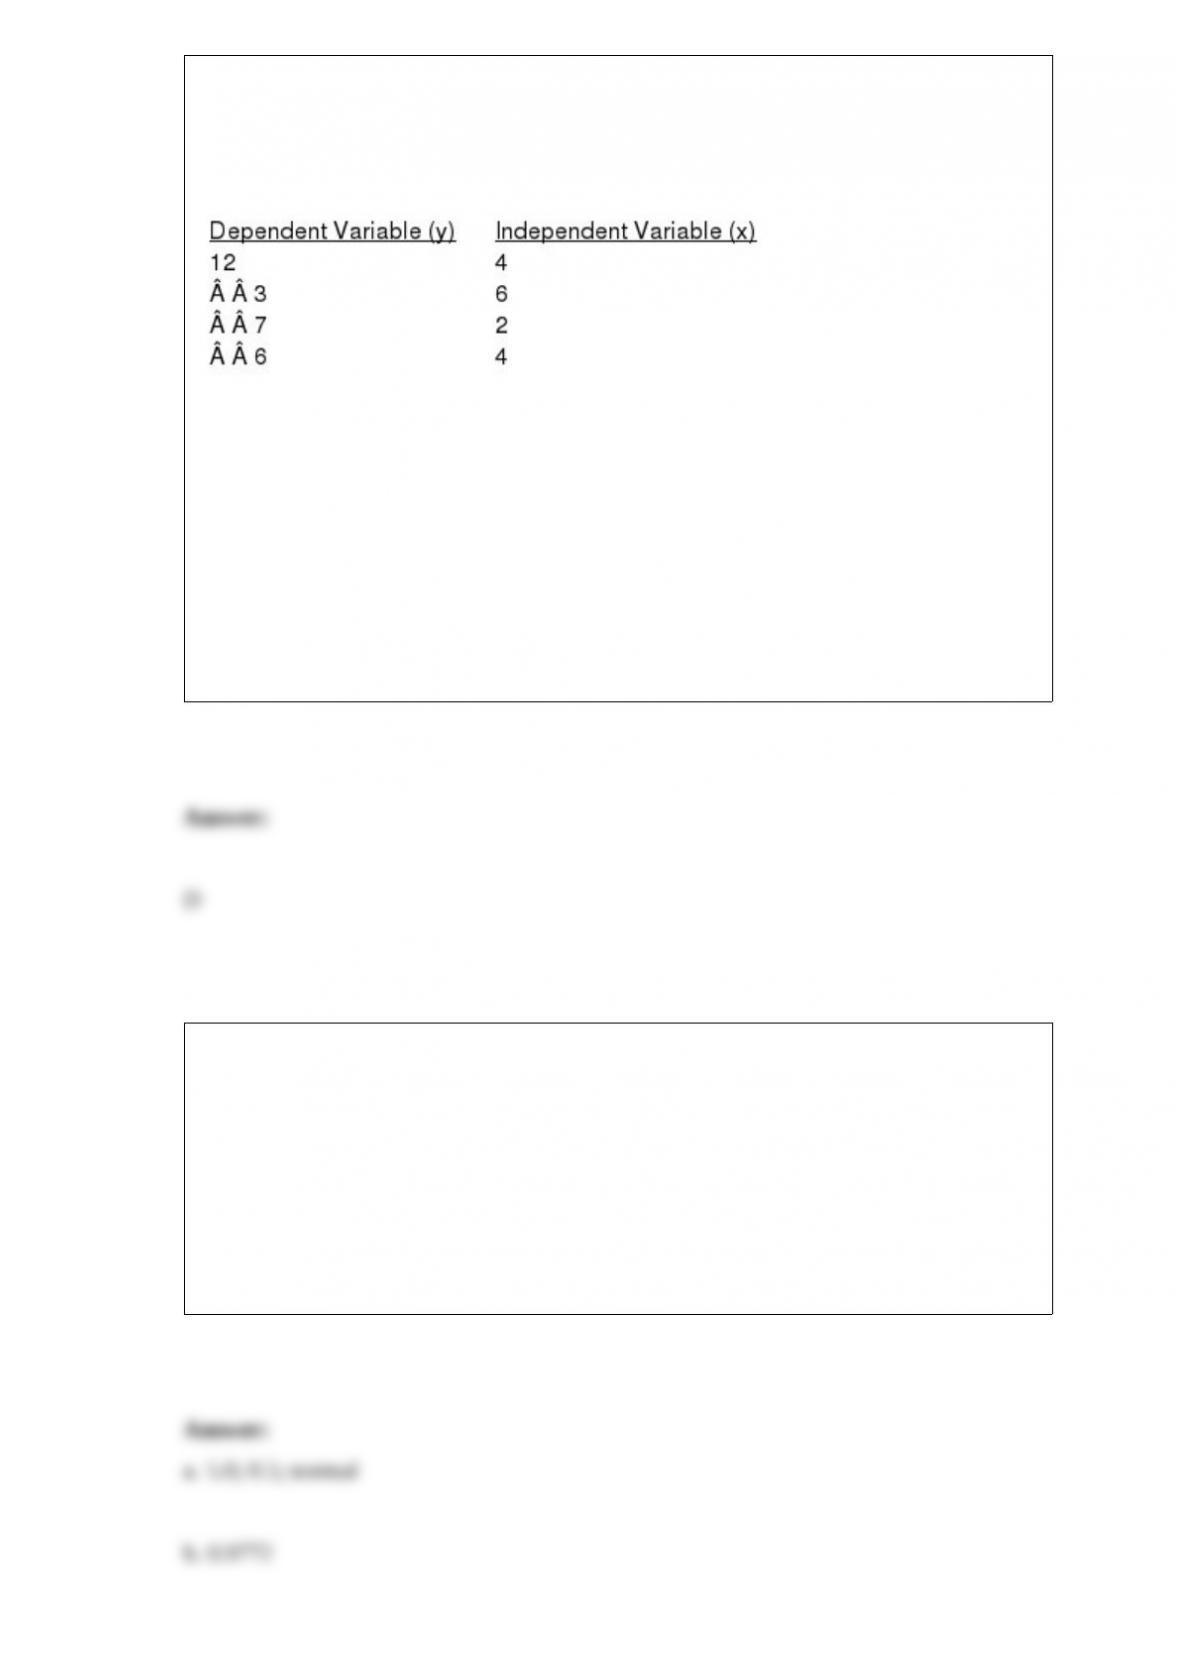
Exhibit 14-6
You are given the following information about y and x.
Refer to Exhibit 14-6. The least squares estimate of b0 equals
a. 1
b. -1
c. -11
d. 11
Students of a large university spend an average of $5 a day on lunch. The standard
deviation of the expenditure is $3. A simple random sample of 36 students is taken.
a. What are the expected value, standard deviation, and shape of the sampling
distribution of the sample mean?
b. What is the probability that the sample mean will be at least $4?
c. What is the probability that the sample mean will be at least $5.90?

If P(A) 0.5 and P(B) 0.5, then P(A ‡ B) is
a. 0.00
b. 0.25
c. 1.00
d. cannot be determined from the information given
Which of the following is not a measure of location?
a. mean
b. median
c. variance
d. mode
As a company manager for Claimstat Corporation there is a 0.40 probability that you
will be promoted this year. There is a 0.72 probability that you will get a promotion or a
raise. The probability of getting a promotion and a raise is 0.25.
a. If you get a promotion, what is the probability that you will also get a raise?
b. What is the probability of getting a raise?
c. Are getting a raise and being promoted independent events? Explain using
probabilities.
d. Are these two events mutually exclusive? Explain using probabilities.
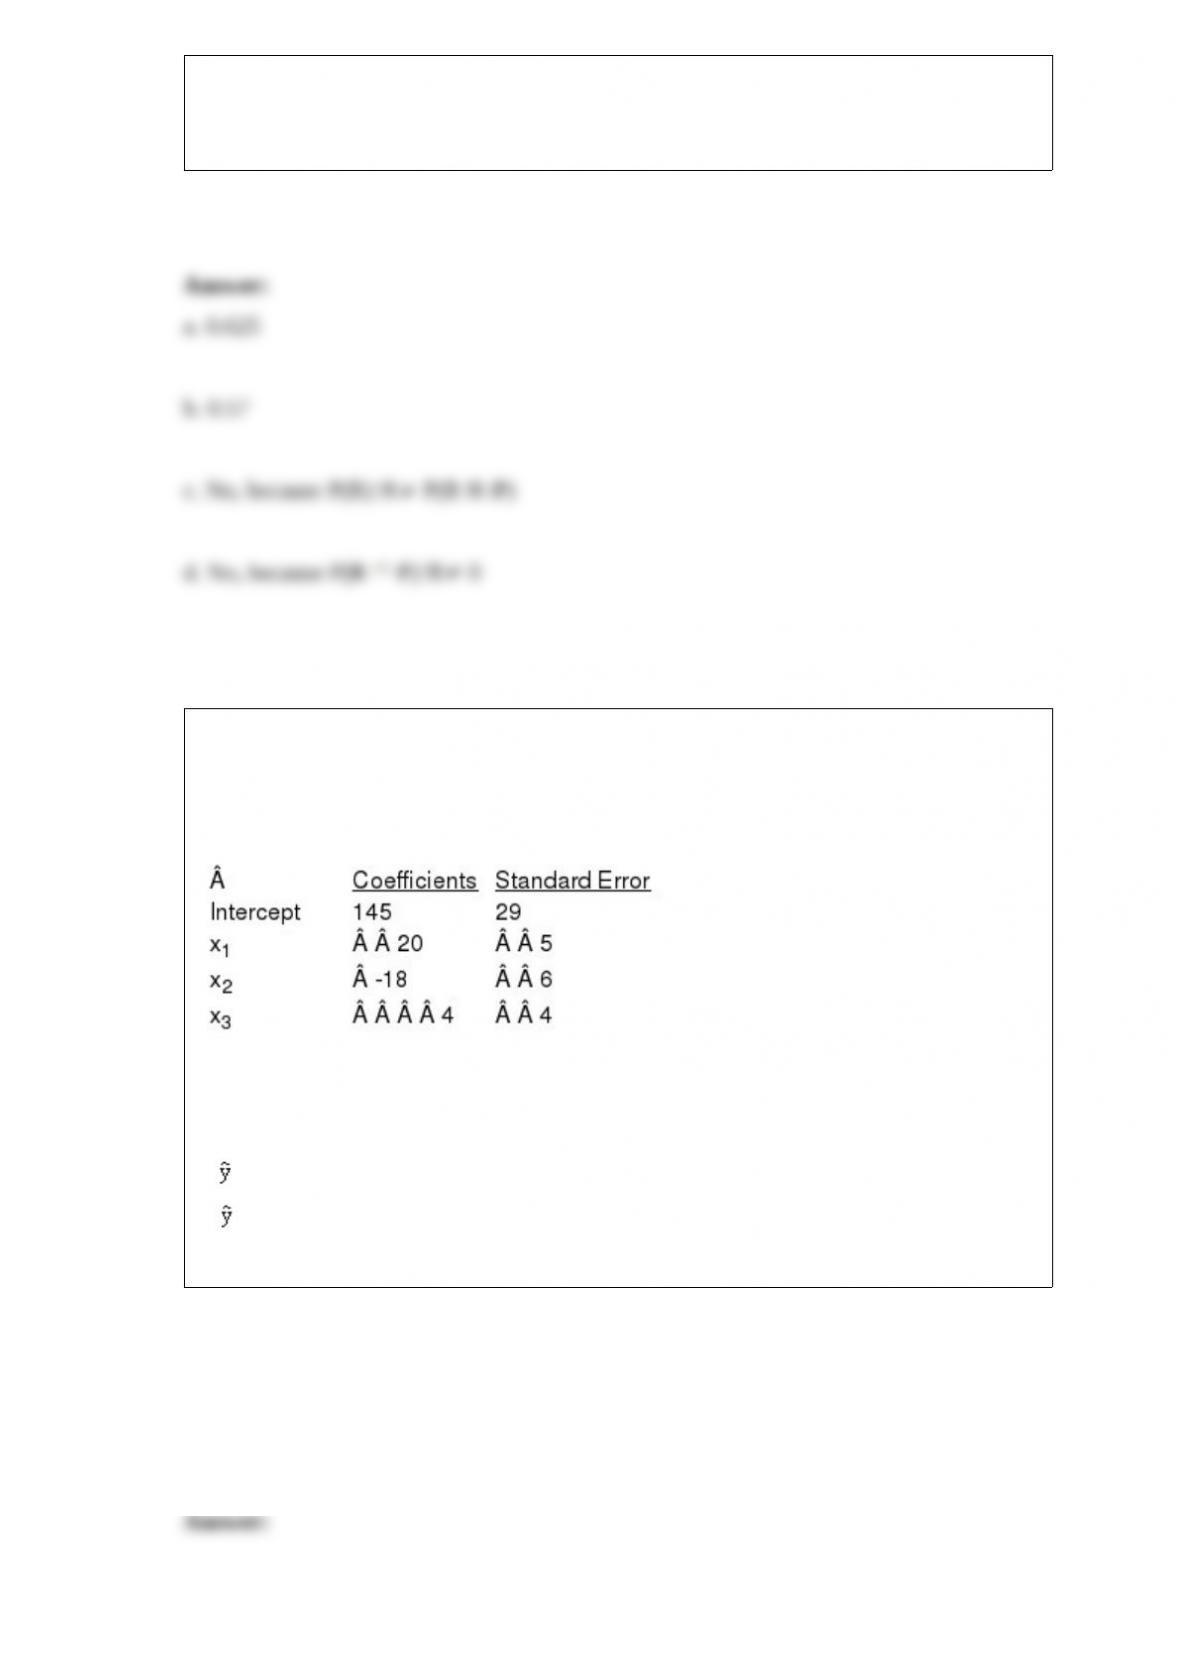
Exhibit 16-3
Below you are given a partial Excel output based on a sample of 25 observations.
Refer to Exhibit 16-3. The estimated regression equation is
a. y = 0 + 1x1 + 2x2 + 3x3 +
b. E(y) = 0 + 1x1 + 2x2 + 3x3
c. = 29 + 5x1 + 6x2 + 4x3
d. = 145 + 20x1 – 18x2 + 4x3
e. None of the above answers are correct.
The level of measurement that allows for the rank ordering of data items is
a. nominal measurement
b. ratio measurement
c. interval measurement
d. ordinal measurement
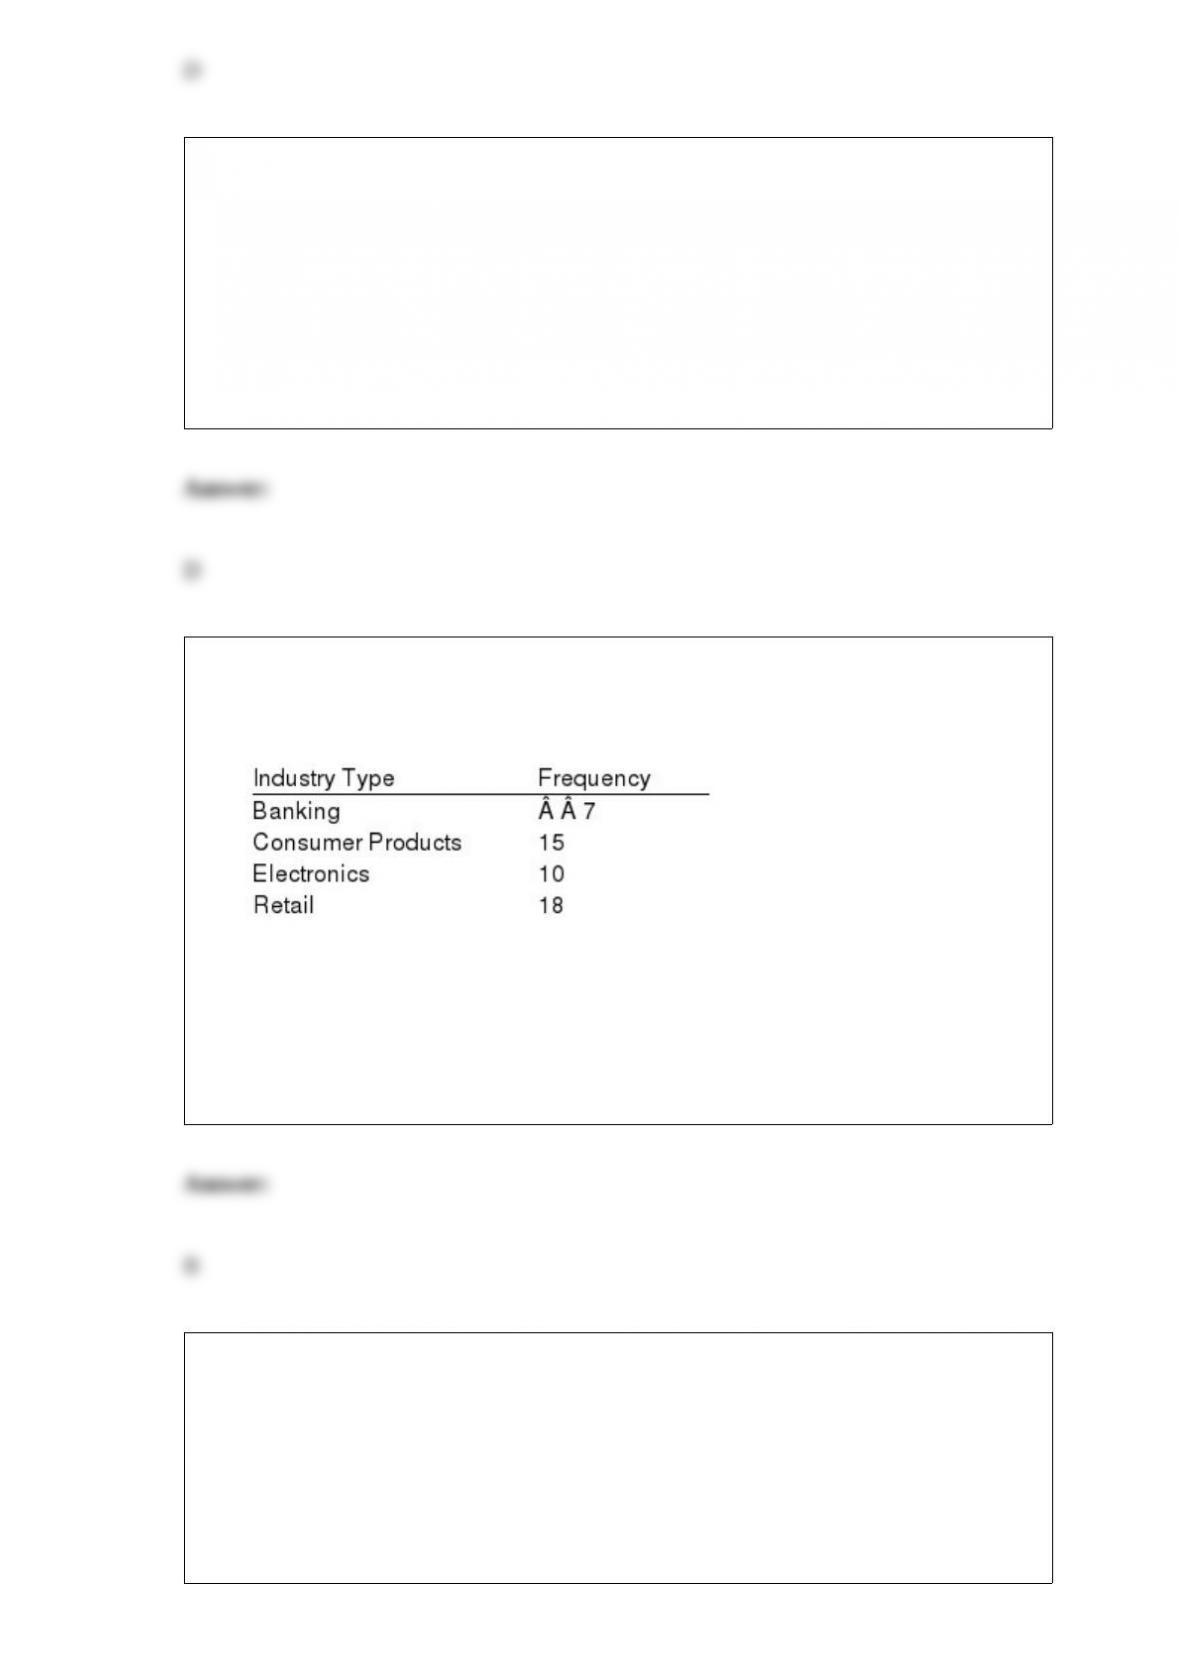
Exhibit 2-2
Information on the type of industry is provided for a sample of 50 Fortune 500
companies.
Refer to Exhibit 2-2. The percent frequency of industries that are classified as
electronics is
a. 10
b. 20
c. 0.10
d. 0.20
An experiment consists of four outcomes with P(E1) 0.2, P(E2) 0.3, and P(E3) 0.4.
The probability of outcome E4 is
a. 0.500
b. 0.024
c. 0.100
d. 0.900
An unbiased estimate of the population total is given by the
a. sample mean multiplied by the size of the sample
b. sample mean multiplied by the size of the population
c. sample size multiplied by the standard error
d. standard deviation divided by the square root of the sample size
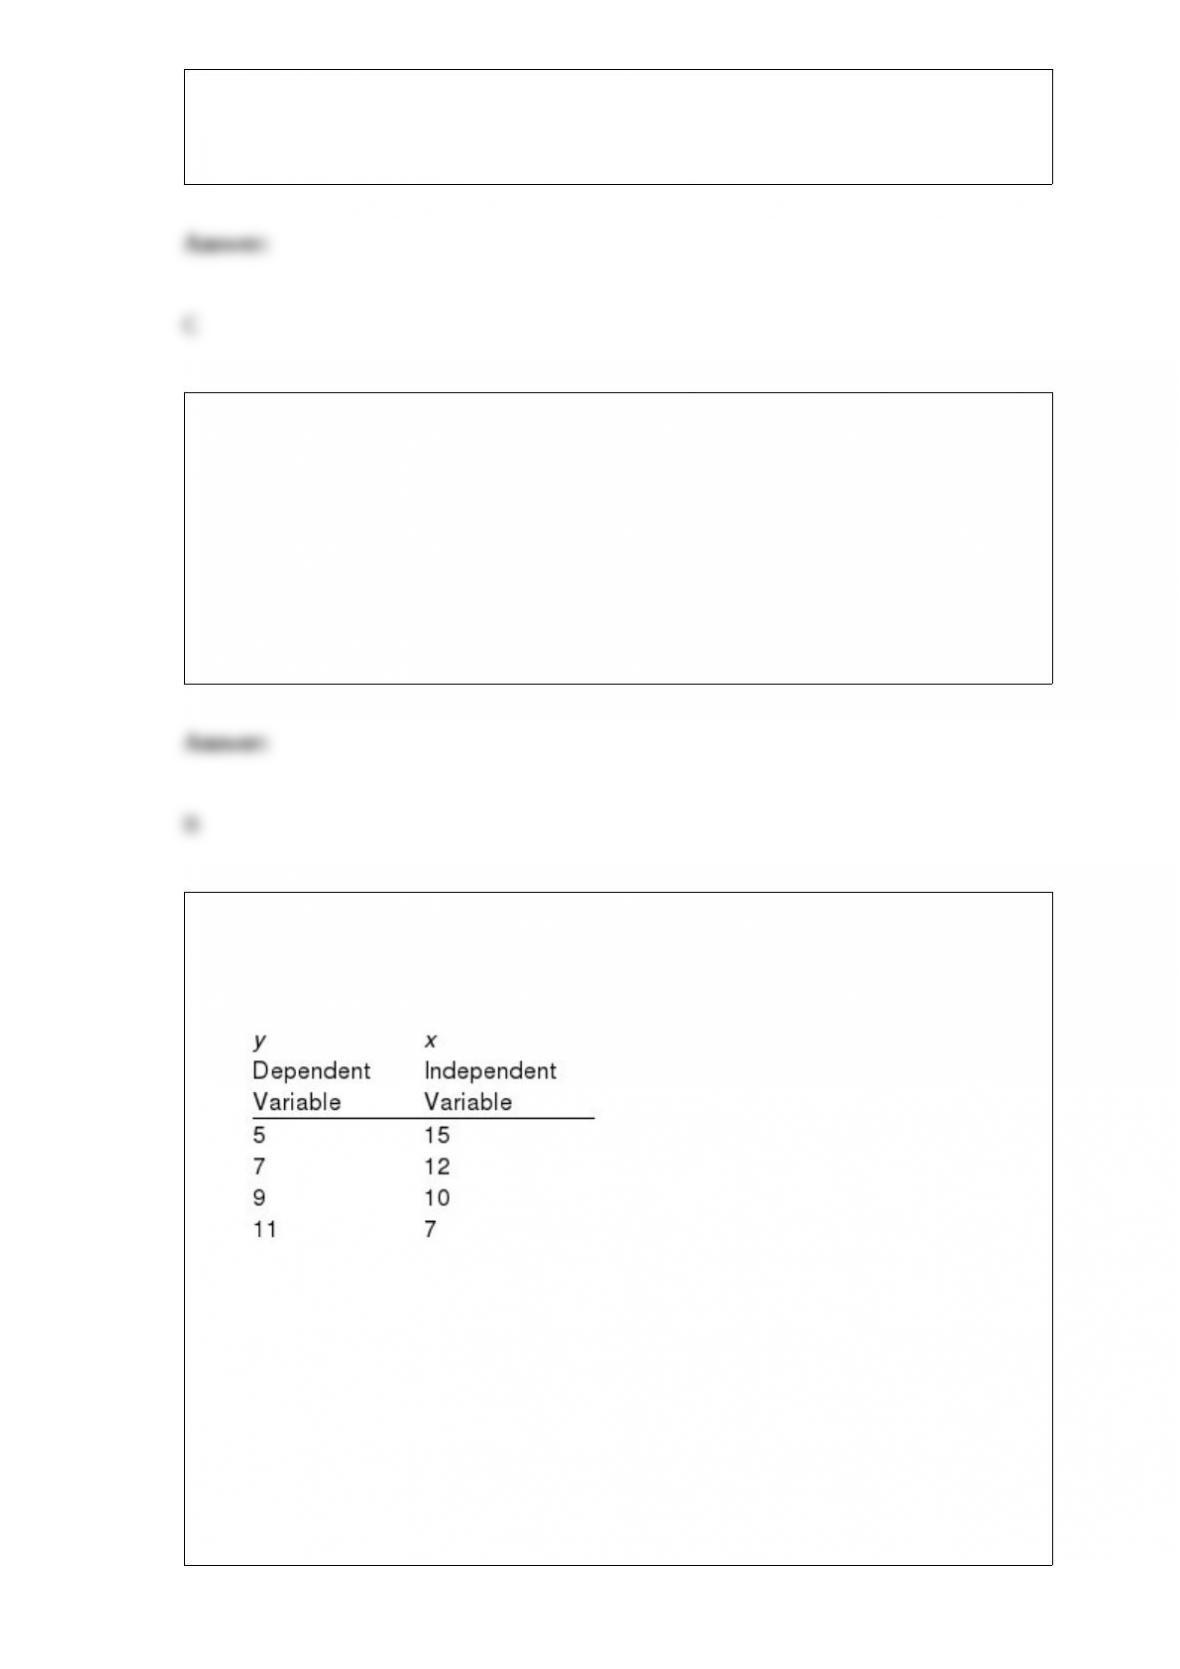
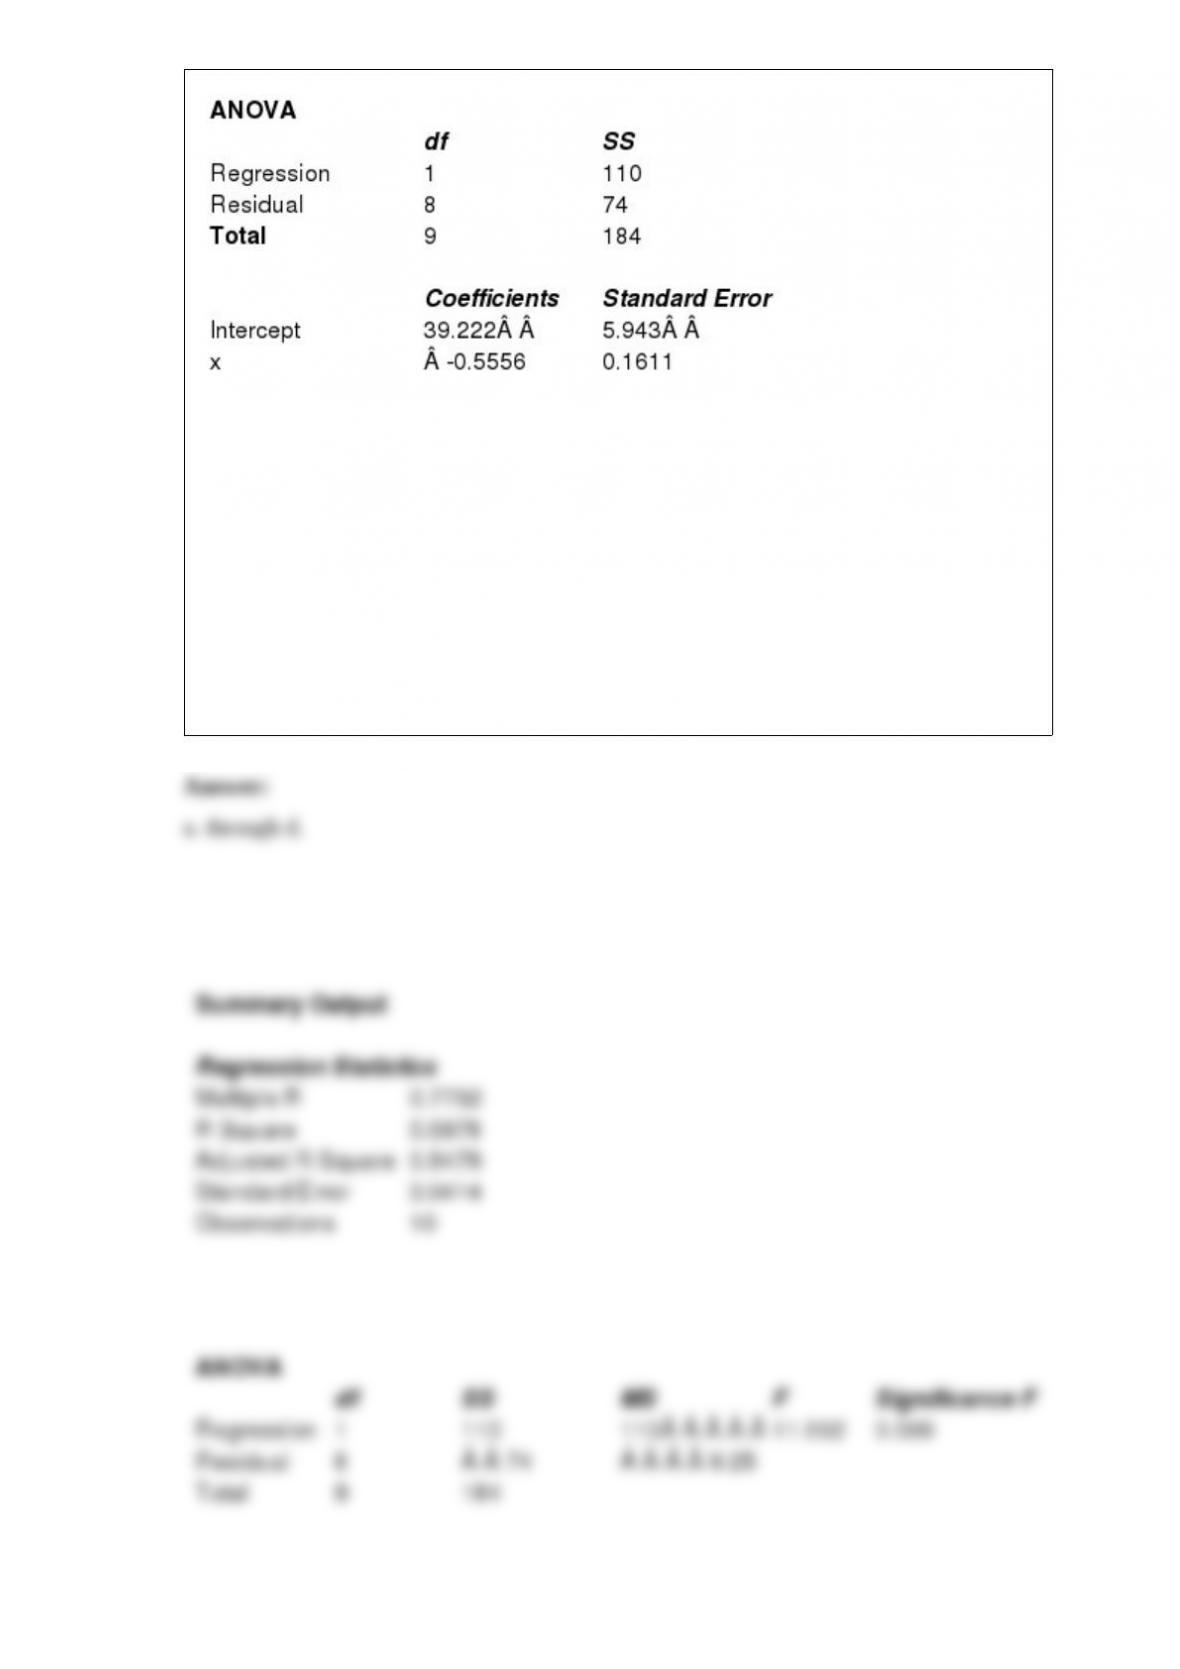
Exhibit 14-2
You are given the following information about y and x.
Refer to Exhibit 14-2. The coefficient of determination equals
a. -0.99705
b. -0.9941
c. 0.9941
d. 0.99705

The basis for using a normal probability distribution to approximate the sampling
distribution of is
a. Chebyshev’s theorem
b. the empirical rule
c. the central limit theorem
d. Bayes’ theorem
Exhibit 6-1
Consider the continuous random variable x, which has a uniform distribution over the
interval from 20 to 28.
Refer to Exhibit 6-1. The variance of x is approximately
a. 2.309
b. 5.333
c. 32
d. 0.667
Which of the following is not a characteristic of an experiment where the binomial
probability distribution is applicable?
a. the experiment has a sequence of n identical trials
b. exactly two outcomes are possible on each trial
c. the trials are dependent
d. the probabilities of the outcomes do not change from one trial to another
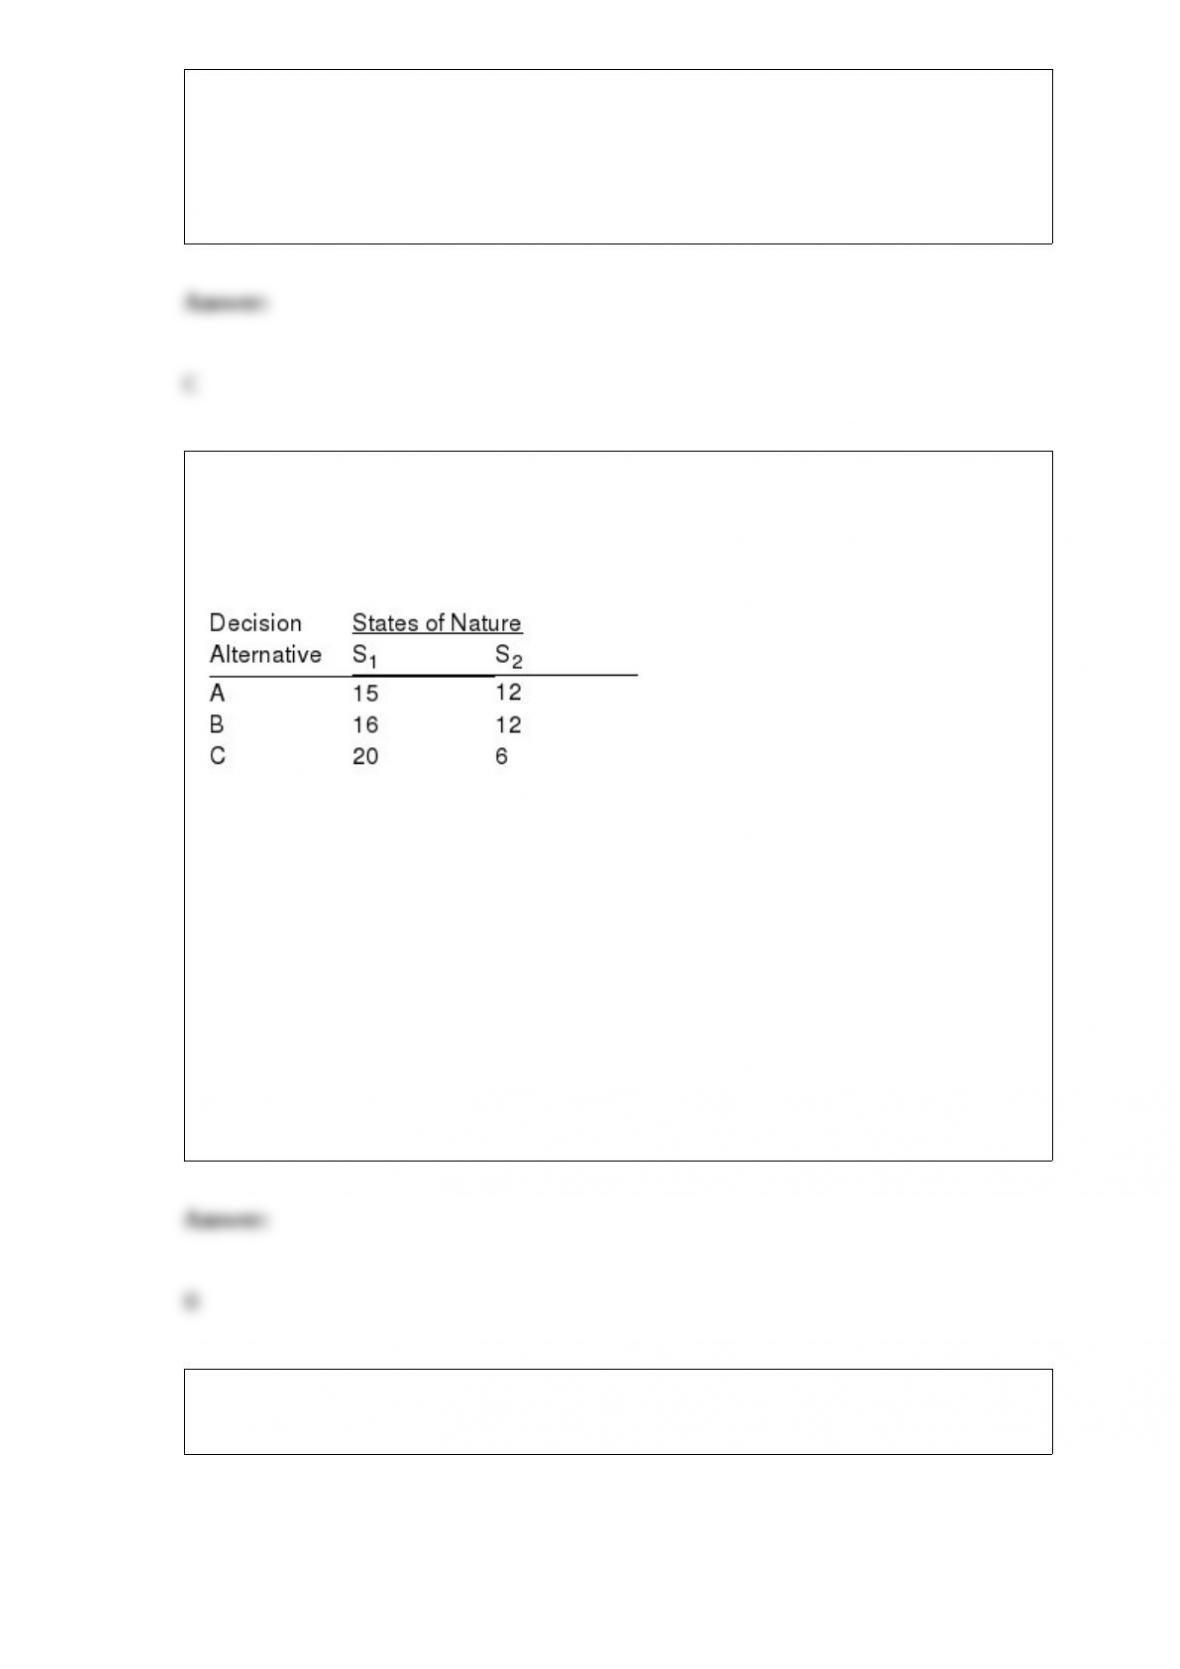
Exhibit 20-4
Below you are given a payoff table involving two states of nature and three decision
alternatives.
The probability of occurrence of S1 = 0.3.
Refer to Exhibit 20-4. The expected value of perfect information is
a. 1.5
b. 1.2
c. 1.0
d. 4.8
Shown below is a portion of an Excel output for regression analysis relating Y
(dependent variable) and X (independent variable).
a. What has been the sample size for the above?
b. Perform a t test and determine whether or not X and Y are related. Let = 0.05.
c. Perform an F test and determine whether or not X and Y are related. Let = 0.05.
d. Compute the coefficient of determination.
e. Interpret the meaning of the value of the coefficient of determination that you found
in d. Be very specific.

In a multiple regression analysis involving 15 independent variables and 200
observations, SST = 800 and SSE = 240. The coefficient of determination is
a. 0.300
b. 0.192
c. 0.500
d. 0.700
Information about a state of nature is known as
a. natural information
b. states information
c. a sampling method
d. an indicator
Exhibit 18-6
It is believed that the median yearly income in a suburb of Atlanta is $70,000. A sample
of 67 residents was taken. Thirty-eight had yearly incomes above $70,000, 26 had
yearly incomes below $70,000, and 3 had yearly incomes equal to $70,000. The null
hypothesis to be tested is H0: median = $70,000.
Refer to Exhibit 18-6. To test the null hypothesis, the appropriate probability
distribution to use is
a. normal
b. chi-square
c. t distribution
d. binomial
Heavy emphasis on statistical analysis and careful measurement are closely associated
with
a. Total Quality
b. ISO 9000
c. Baldrige National Quality Program
d. Six Sigma
The time between arrivals of customers at the drive-up window of a bank follows an
exponential probability distribution with a mean of 10 minutes.

Which of the following smoothing constants would make an exponential smoothing
forecast equivalent to a naive forecast?
a. 0
b. 1 divided by the number of periods
c. 0.5
d. 1.0