
When should measures of location and dispersion be computed from grouped data
rather than from individual data values?
a. as much as possible since computations are easier
b. only when individual data values are unavailable
c. whenever computer packages for descriptive statistics are unavailable
d. only when the data are from a population
The expected value of a random variable is the
a. most probable value
b. simple average of all the possible values
c. median value
d. mean value
In a regression analysis if r2 1, then
a. SSE SST
b. SSE 1
c. SSR SSE
d. SSR SST

Exhibit 11-7
We want to test the hypothesis that population B has a smaller variance than population
A.
Refer to Exhibit 11-7. The null hypothesis is to be tested at the 5% level of significance.
The critical value from the table is
a. 3.07
b. 3.29
c. 3.35
d. 3.68
An investor has a choice between four investments. The profitability of the investments
depends upon the market. The payoff table is given below for different market
conditions.

Bayes’ theorem is used to compute
a. the prior probabilities
b. the union of events
c. both the prior probabilities and the union of events
d. the posterior probabilities
The assembly time for a product is uniformly distributed between 6 to 10 minutes. The
probability density function has what value in the interval between 6 and 10?
a. 0.25
b. 4.00
c. 5.00
d. zero

Data points having high leverage are often
a. residuals
b. sum of squares error
c. influential
d. None of the other answers is correct.
A survey of a subset of a population is called a
a. sample survey
b. target survey
c. sampled population
d. survey of element

Exhibit 18-3
A company advertises that food preparation time can be significantly reduced with the
Handy Dandy Slicer. A sample of 12 individuals prepared the ingredients for a meal
with and without the slicer. You are given the preparation times below.
Refer to Exhibit 18-3. To test the null hypothesis, the appropriate probability
distribution to use is
a. normal
b. chi-square
c. t distribution
d. binomial
In a multiple regression model, the error term is assumed to
a. have a mean of 1
b. have a variance of zero

c. have a standard deviation of 1
d. be normally distributed
A sample selected in such a manner that each sample of size n has the same probability
of being selected is
a. a convenience sample
b. a judgment sample
c. nonprobabilistic sampling
d. a simple random sample
For a multiple regression model, SSR = 600 and SSE = 200. The multiple coefficient of
determination is
a. 0.333
b. 0.275
c. 0.300
d. 0.75
There are 500 employees in a firm, 45% are female. A sample of 60 employees is
selected randomly.
Exhibit 5-5
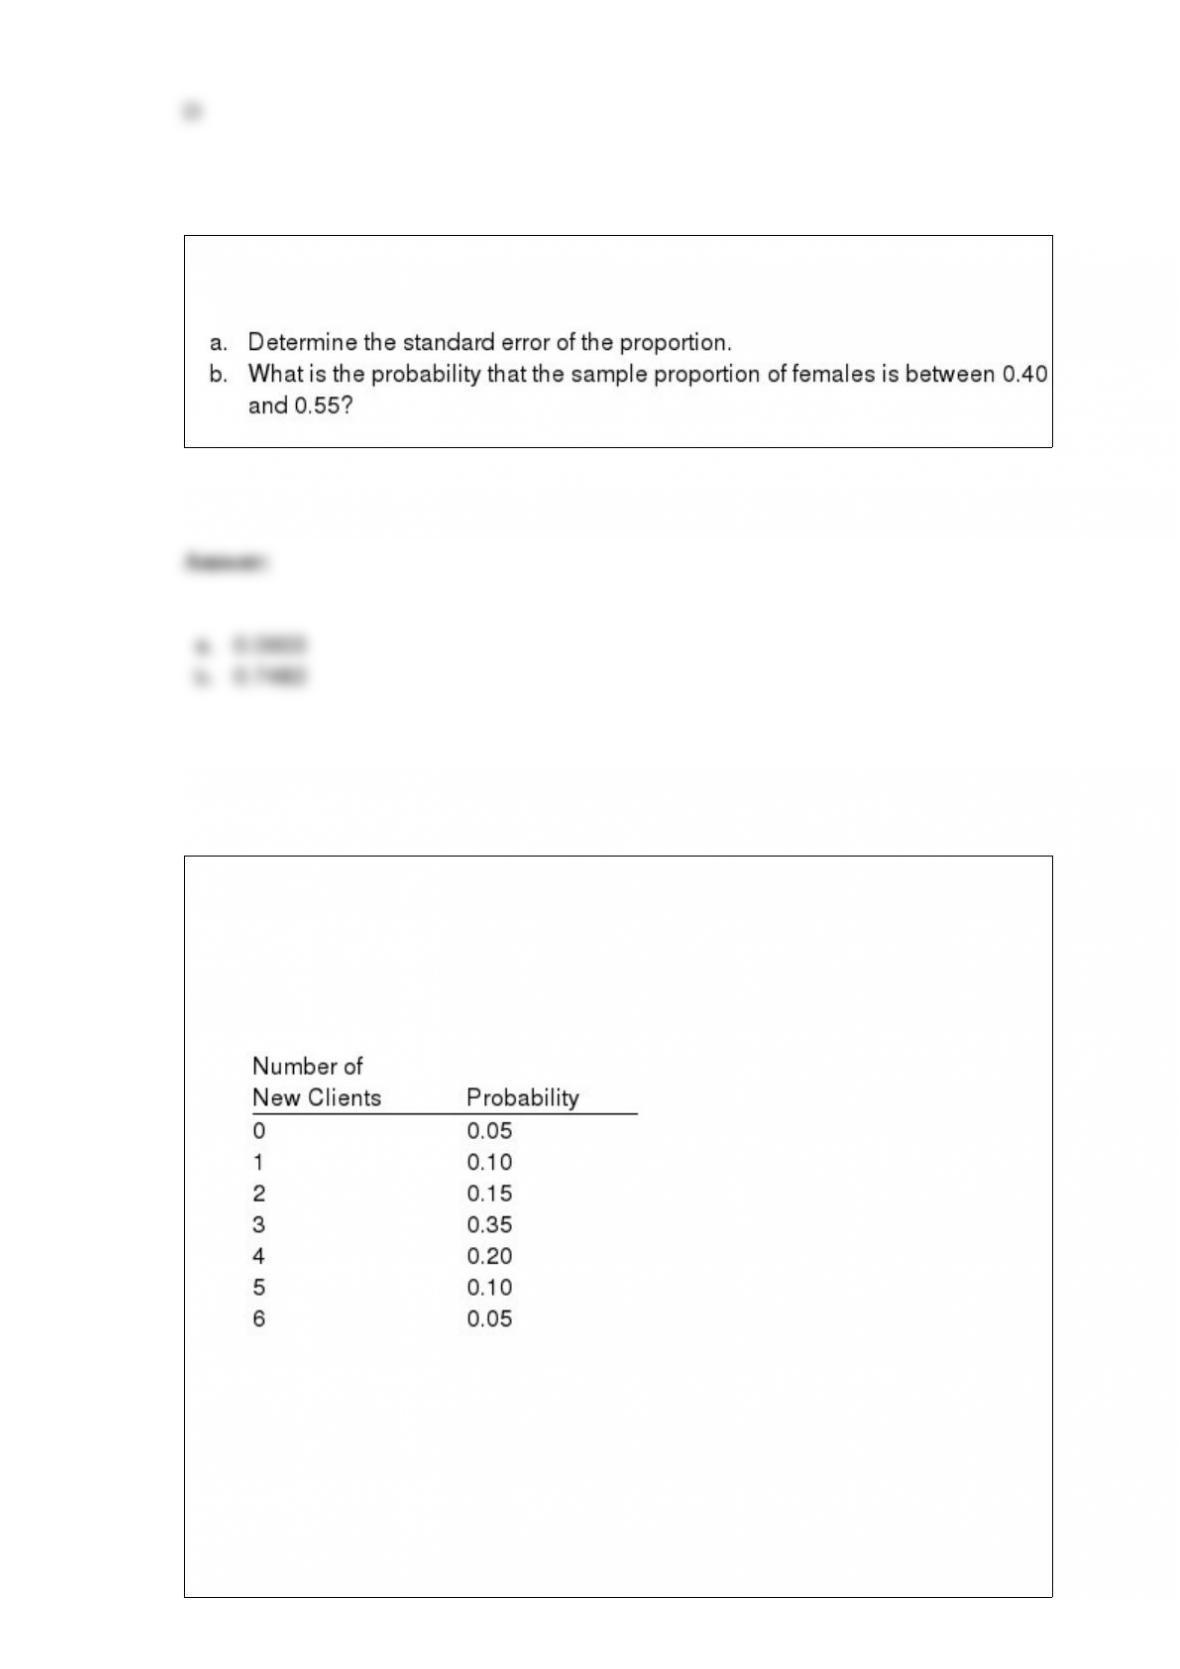
AMR is a computer-consulting firm. The number of new clients that they have obtained
each month has ranged from 0 to 6. The number of new clients has the probability
distribution that is shown below.
Refer to Exhibit 5-5. The standard deviation is
a. 1.431
b. 2.047
c. 3.05
d. 21
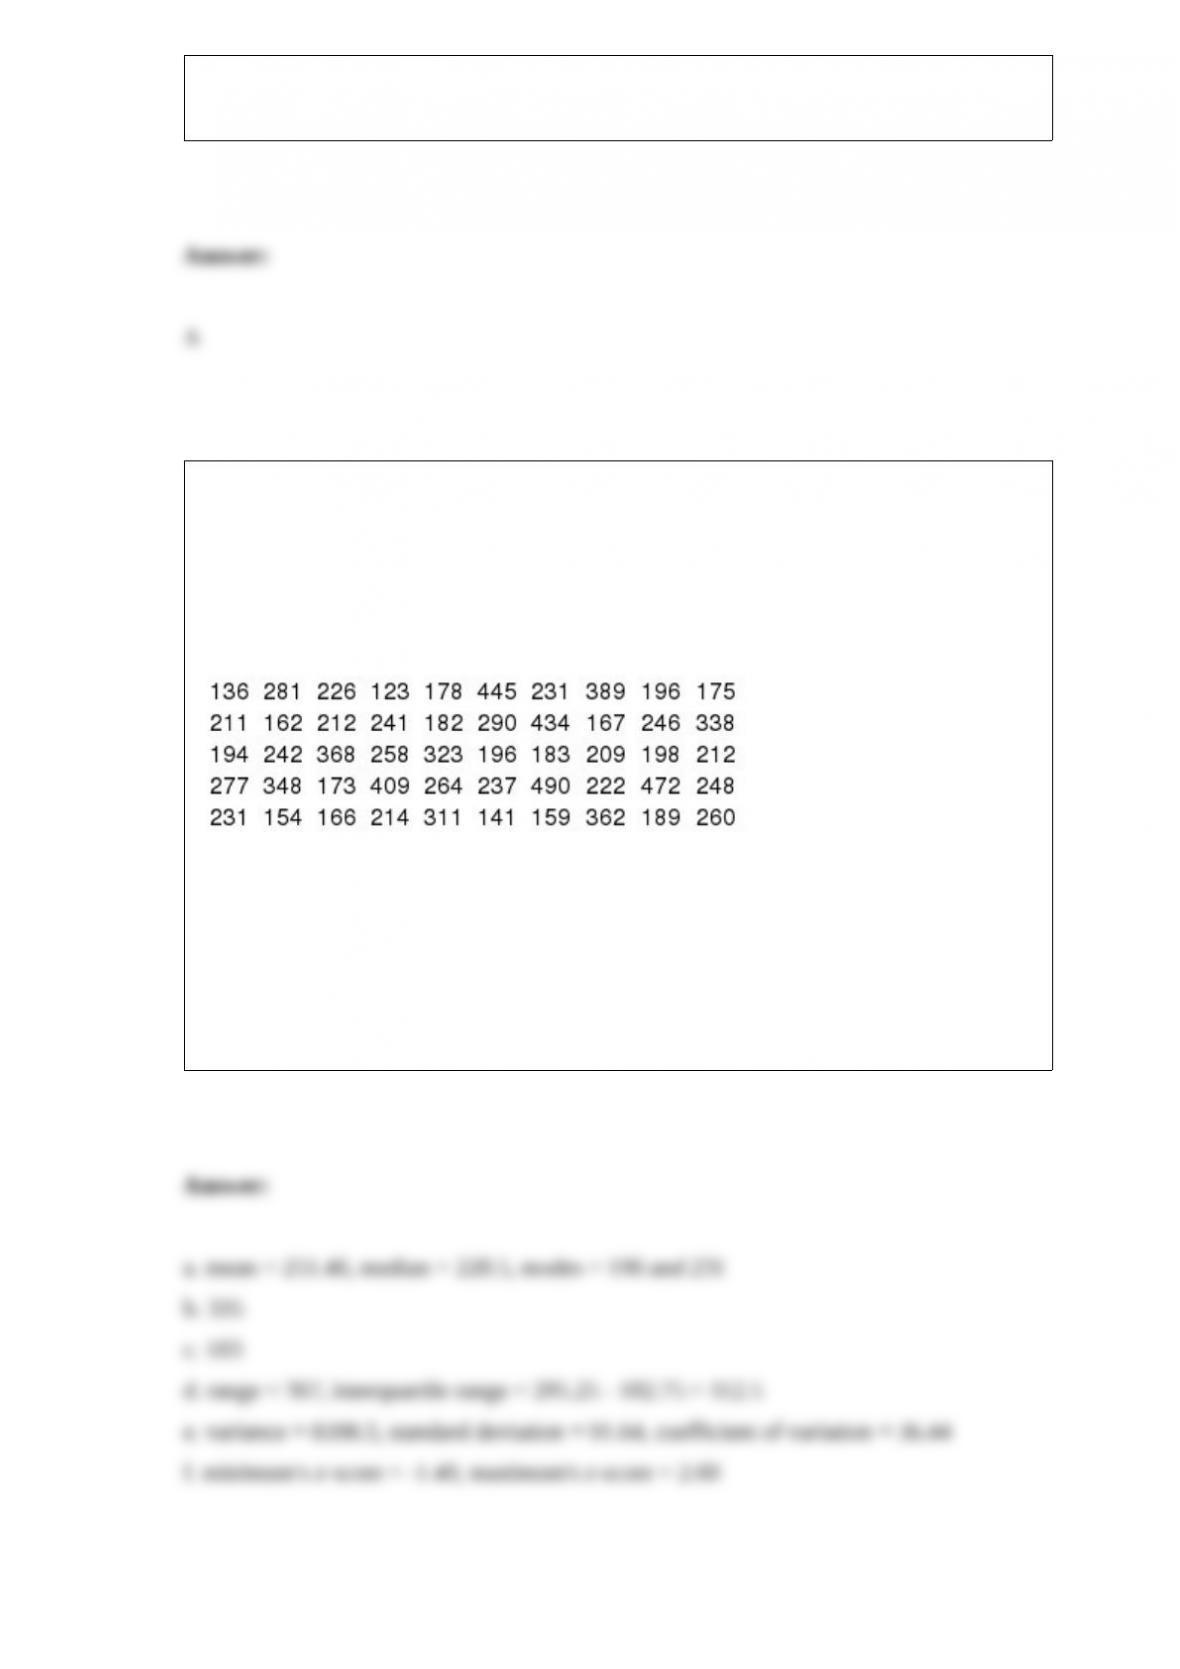
Missy Walters owns a mail-order business specializing in baby clothes. She is
considering offering her customers a discount on shipping charges based on the
dollar-amount of the mail order. Before Missy decides the discount policy, she needs a
better understanding of the dollar-amount distribution of the mail orders she receives.
Missy had an assistant randomly select 50 recent orders and record the value, to the
nearest dollar, of each order as shown below.
a. Determine the mean, median, and mode for this data set.
b. Determine the 80th percentile.
c. Determine the first quartile.
d. Determine the range and interquartile range.
e. Determine the sample variance, sample standard deviation, and coefficient of
variation.
f. Determine the z-scores for the minimum and maximum values in the data set.

The symbol ˆ shows the
a. union of events
b. intersection of events
c. sum of the probabilities of events
d. sample space
Excel’s __________ can be used to construct a crosstabulation.
a. Chart Tools
b. SUM function
c. PivotTable Report
d. COUNTIF function
Exhibit 11-7
We want to test the hypothesis that population B has a smaller variance than population
A.
Refer to Exhibit 11-7. The null hypothesis

a. should be rejected
b. should not be rejected
c. should be revised
d. None of these alternatives is correct.
The expected opportunity loss of the best decision alternative is the
a. expected value
b. payoff
c. expected value of perfect information
d. None of the answers are correct.
Consumer’s risk is
a. the same concept as the producer’s risk
b. a Type II error
c. a Type I error
d. None of the other answers is correct.

Exhibit 15-4
a. y = 0 + 1x1 + 2x2 +
b. E(y) = 0 + 1x1 + 2x2
c. = bo + b1 x1 + b2 x2
d. E(y) = 0 + 1x1 + 2x2
Refer to Exhibit 15-4. Which equation describes the multiple regression model?
a. equation a
b. equation b
c. equation c
d. equation d
x is a random variable with the probability function: f(x) x/6 for x 1,2 or 3. The
expected value of x is
a. 0.333
b. 0.500
c. 2.000
d. 2.333

When the population has a normal distribution, the sampling distribution of is
normally distributed
a. for any sample size
b. for any sample size of 30 or more
c. for any sample size of 50 or more
d. for any sample from a finite population
For any continuous random variable, the probability that the random variable takes on
exactly a specific value is
a. 1.00
b. 0.50
c. any value between 0 to 1
d. zero