Exhibit 13-1
Refer to Exhibit 13-1. The null hypothesis is to be tested at the 5% level of significance.
The critical value from the table is
a. 2.87
b. 3.24
c. 4.08
d. 8.7
The measure of variability easiest to compute, but seldom used as the only measure, is
the
a. range
b. interquartile range
c. standard deviation
d. variance
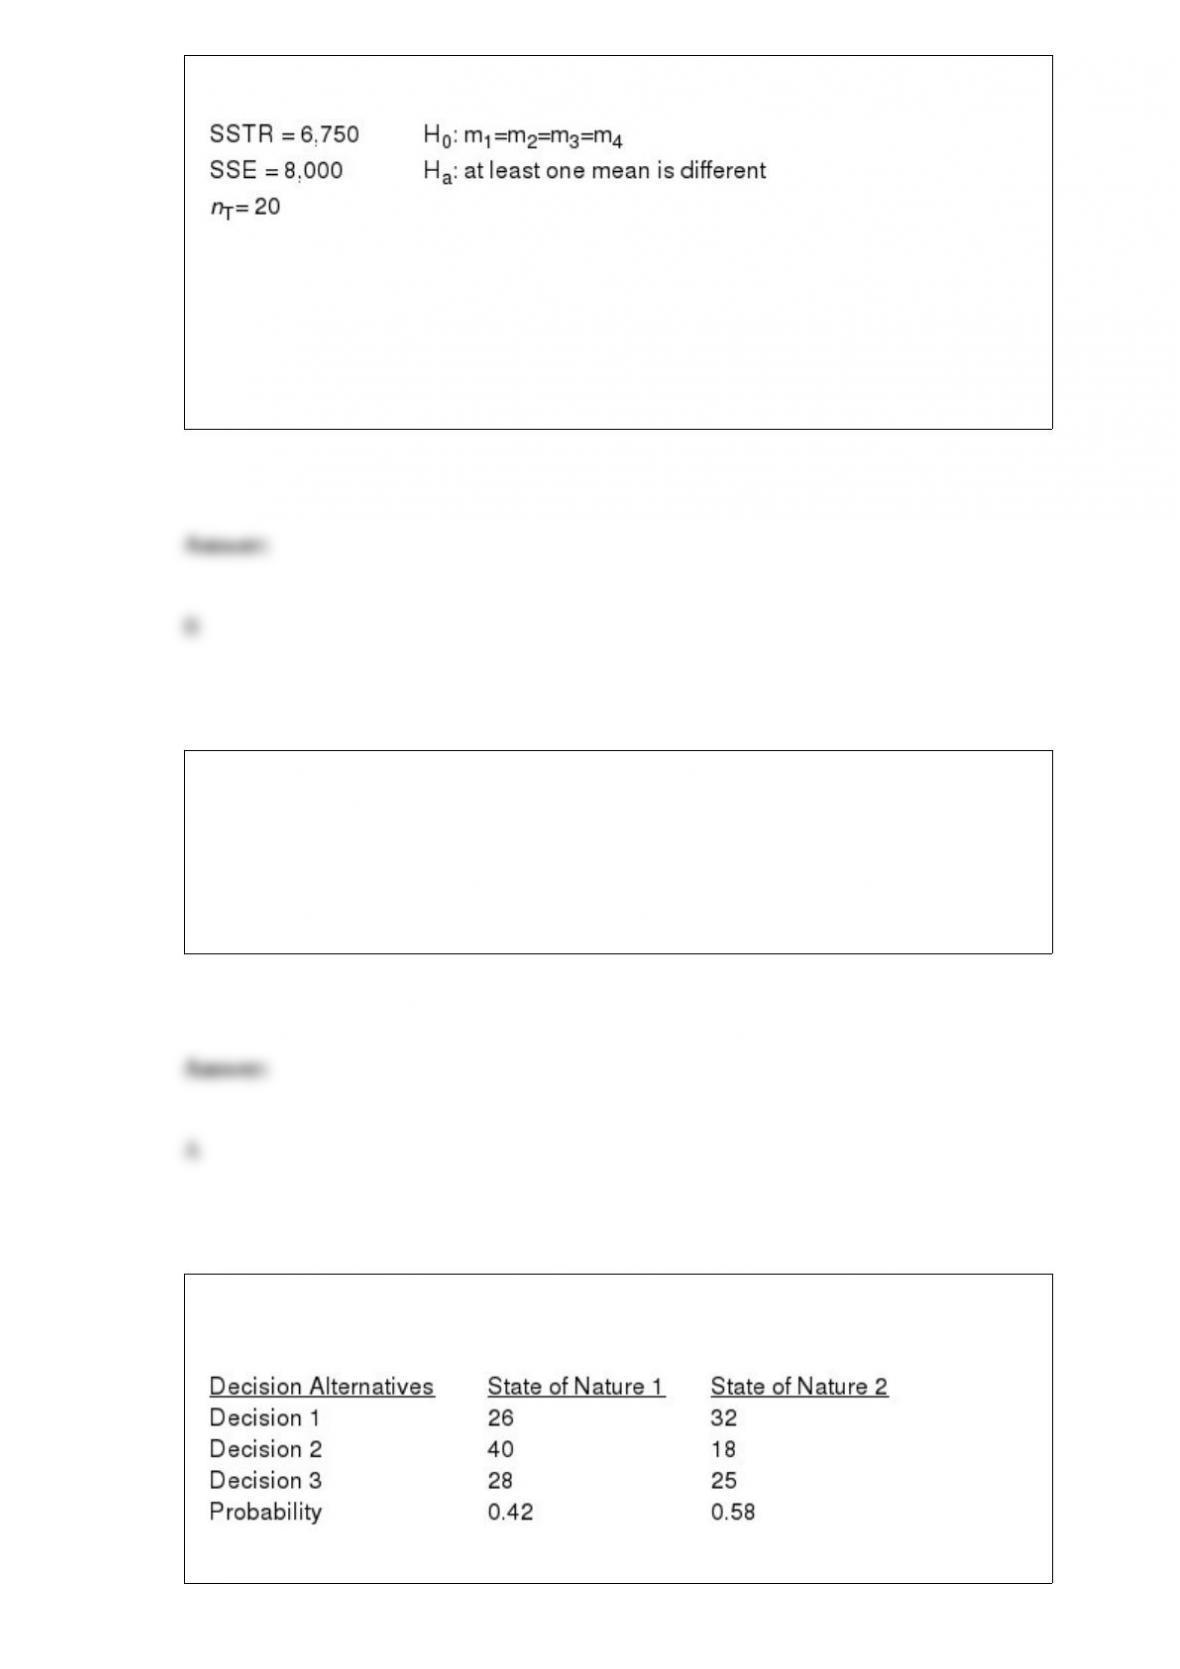
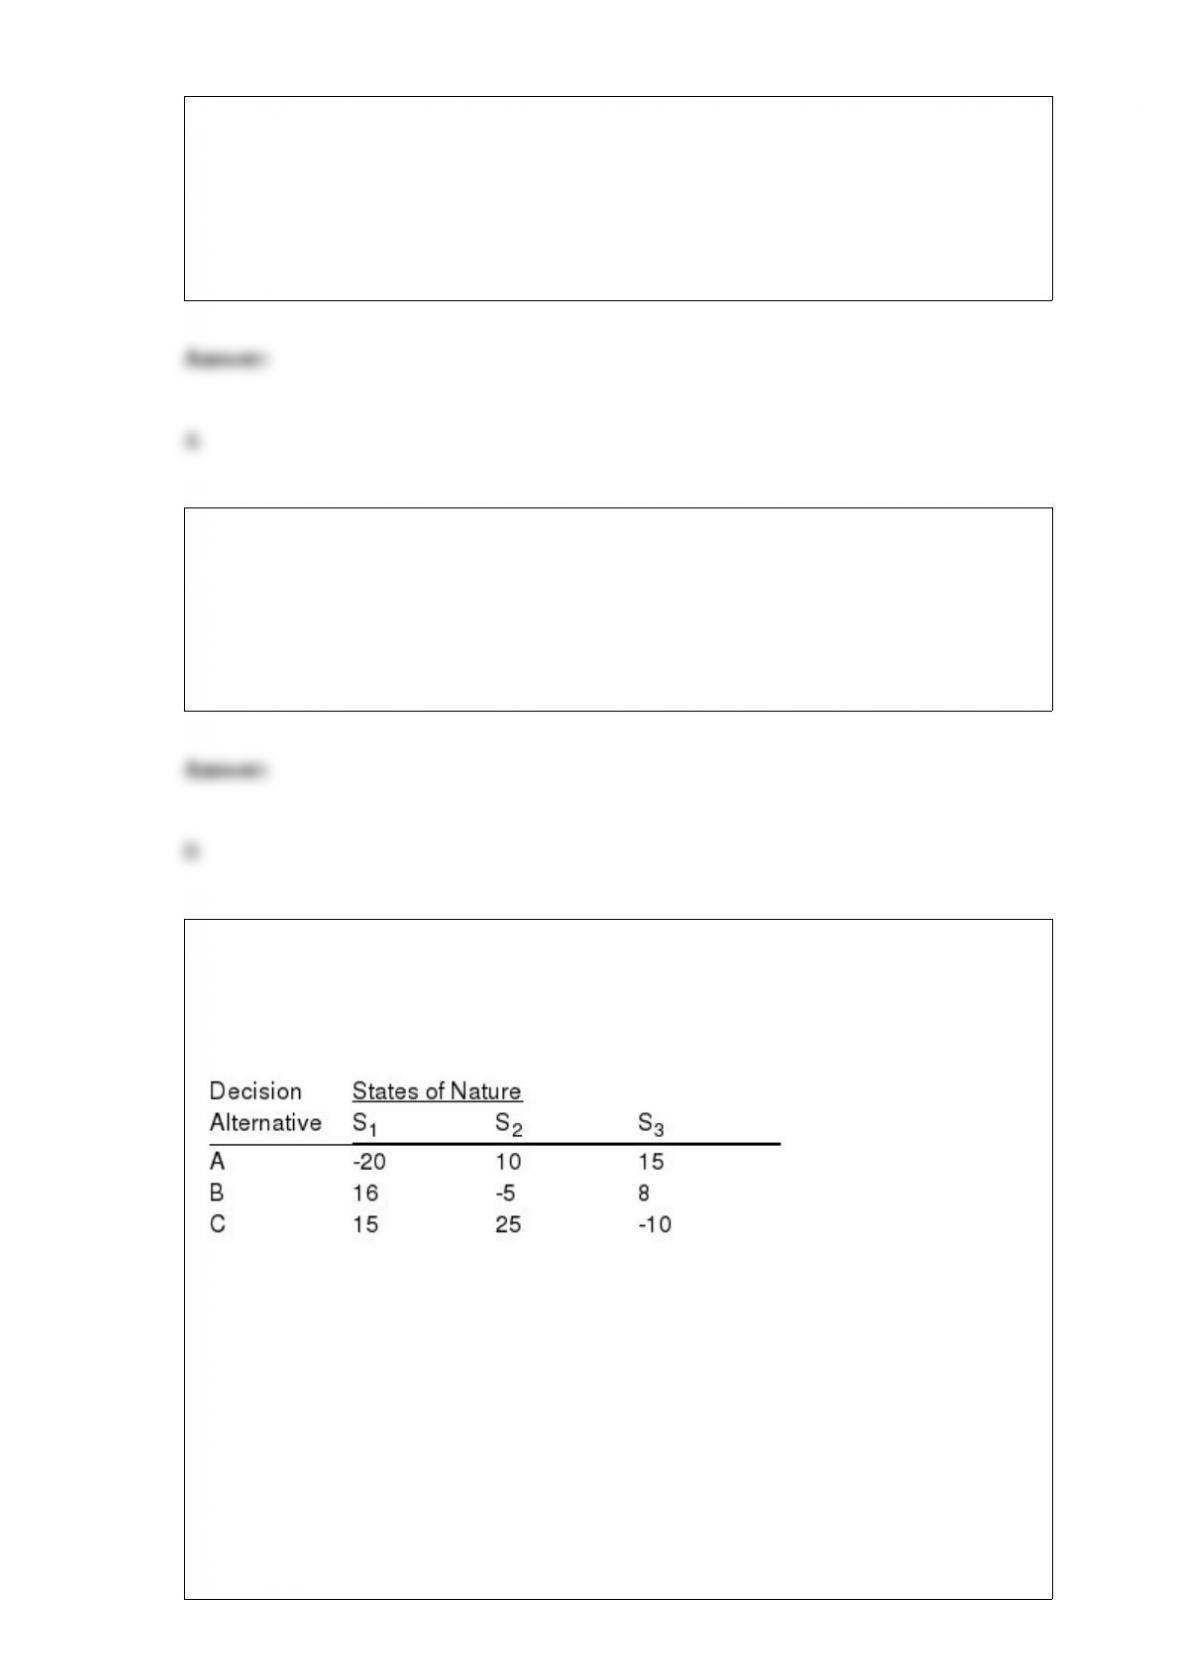
Assume you are faced with the following decision alternatives and two states of nature.
The payoff table is shown below.

a. Determine the expected value of each alternative.
b. Which decision is the optimal decision?
c. Determine the expected value with perfect information.
d. Compute the expected value of perfect information.
Fifty students are enrolled in an Economics class. After the first examination, a random
sample of 5 papers was selected. The grades were 60, 75, 80, 70, and 90.
a. Calculate the estimate of the standard error of the mean.
b. What assumption must be made before we can determine an interval for the mean
grade of all the students in the class? Explain why.
c. Assume the assumption of Part b is met. Provide a 90% confidence interval for the
mean grade of all the students in the class.
d. If there were 200 students in the class, what would be the 90% confidence interval
for the mean grade of all the students in the class?

One of the basic requirements of probability is
a. for each experimental outcome Ei, we must have P(Ei) 1
b. P(A) P(Ac) 1
c. if there are k experimental outcomes, then P(E1) P(E2) … P(Ek) 1
d. both P(A) P(Ac) 1 and if there are k experimental outcomes, then P(E1) P(E2)
… P(Ek) 1
In order to determine whether or not the means of two populations are equal,
a. a t test must be performed
b. an analysis of variance must be performed
c. either a t test or an analysis of variance can be performed
d. a chi-square test must be performed
Which of the following is not a property of a binomial experiment?
a. the experiment consists of a sequence of n identical trials
b. each outcome can be referred to as a success or a failure
c. the probabilities of the two outcomes can change from one trial to the next
d. the trials are independent
The median of a sample will always equal the
a. mode
b. mean
c. 50th percentile
d. all of these answers are correct
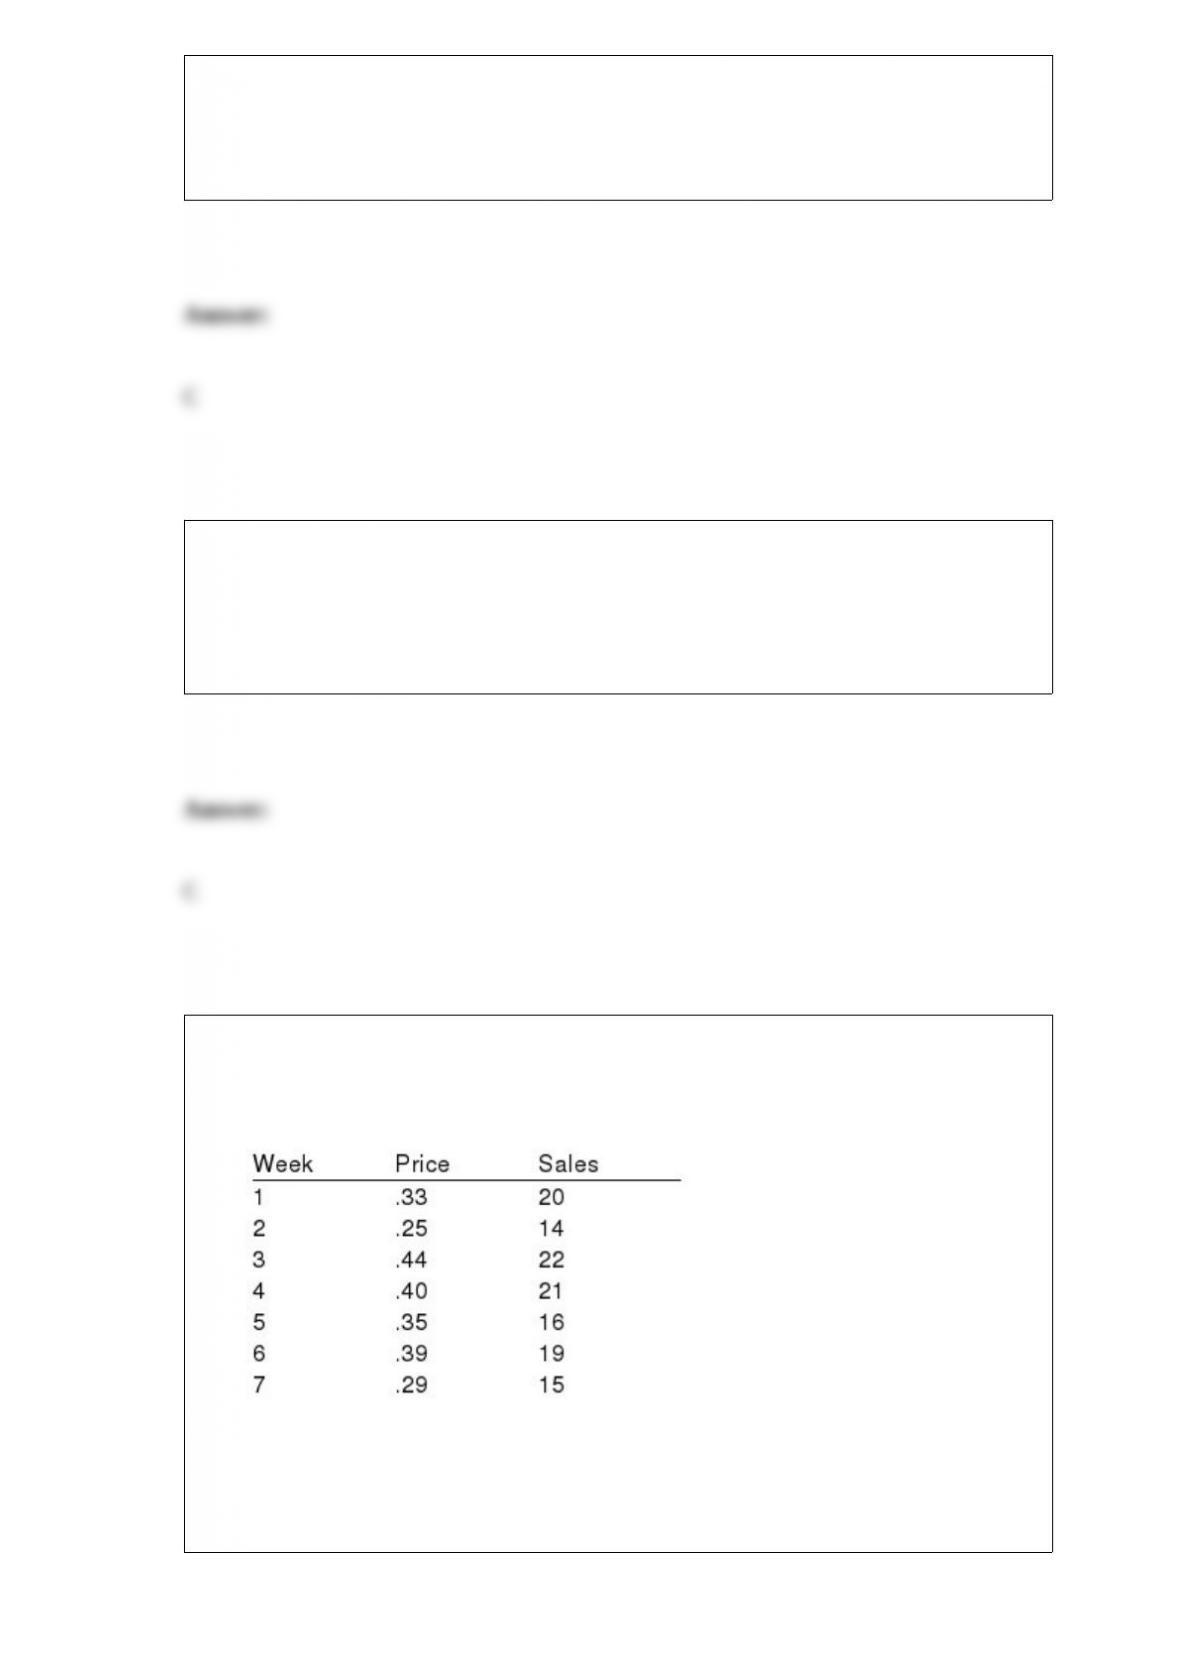
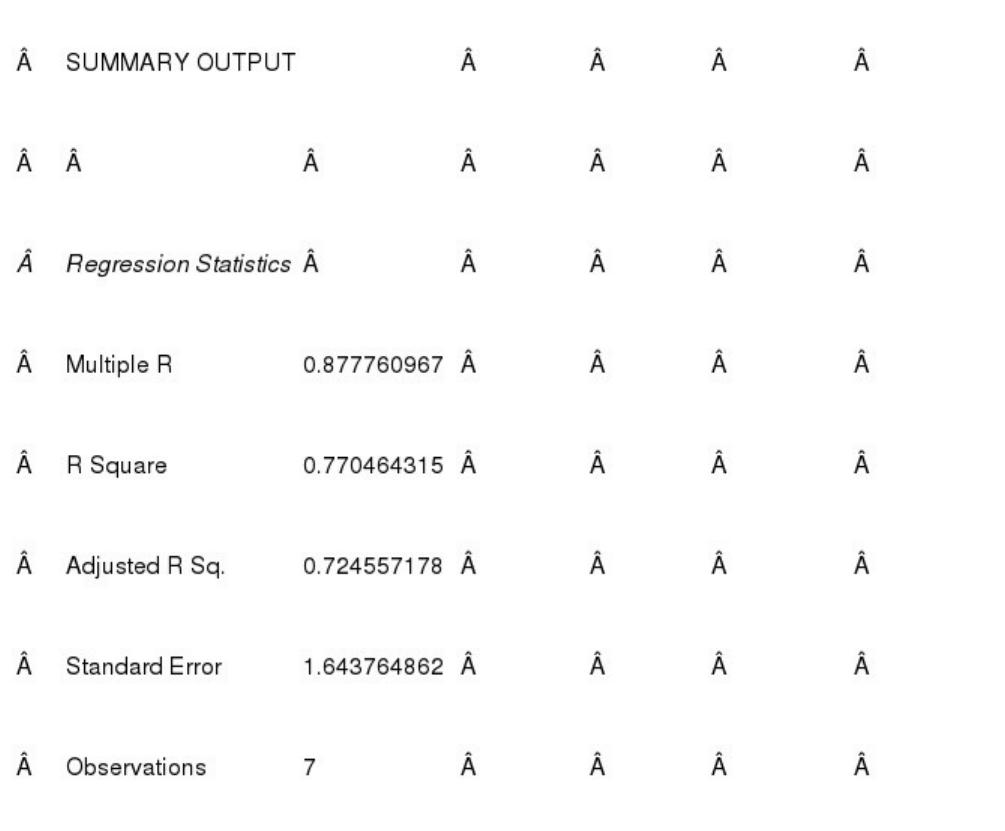
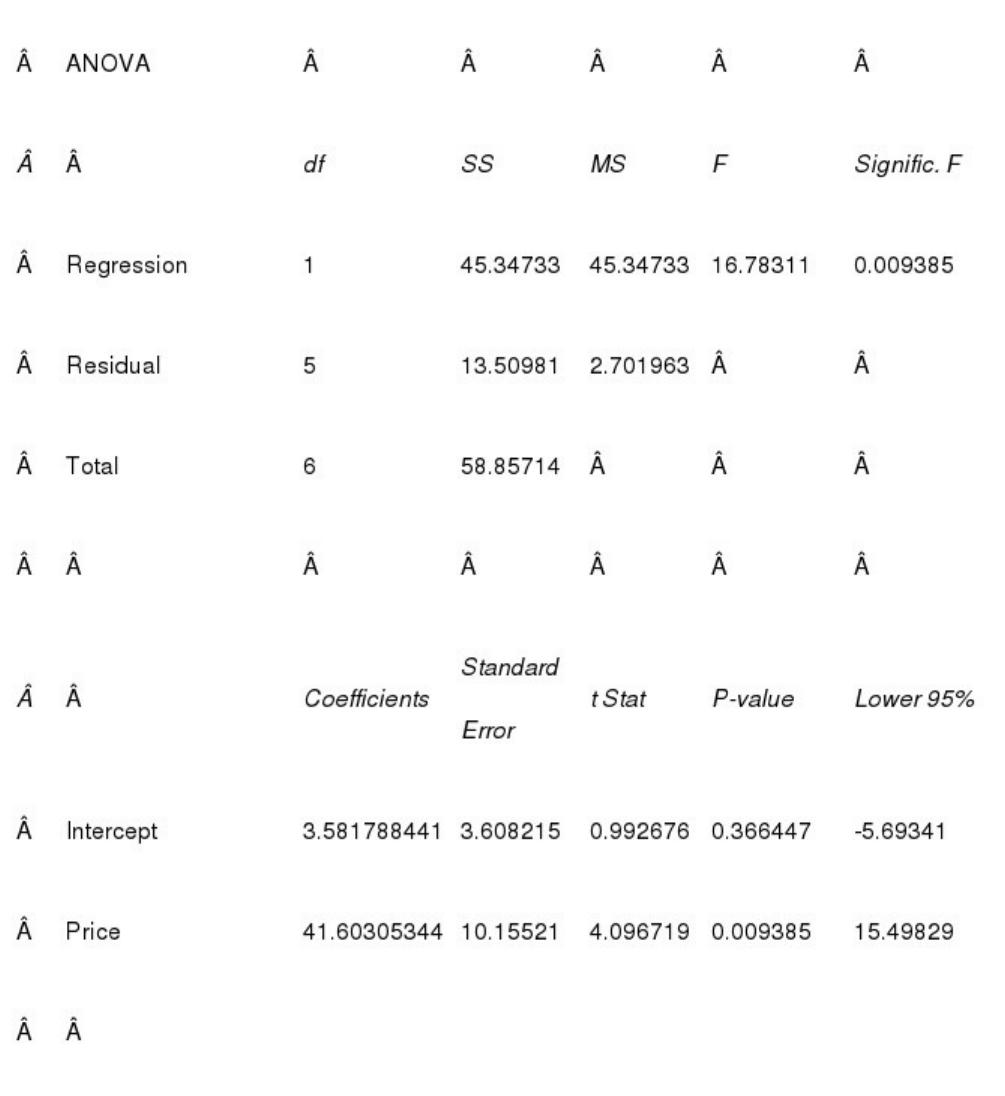
A company has recorded data on the weekly sales for its product (y) and the unit price
of the competitor’s product (x). The data resulting from a random sample of 7 weeks
follows. Use Excel’s Regression Tool to answer the following questions.
a. What is the estimated regression equation?
b. Perform a t test and determine whether or not x and y are related. Use 0.05.
c. Perform an F test and determine whether or not x and y are related. Use 0.05.
d. Find and interpret the coefficient of determination.

Which of the following statements is(are) always true?
a. -1 P(Ei) 1
b. P(A) 1 P(Ac)
c. P(A) P(B) 1
d. both P(A) 1 P(Ac) and P(A) P(B) 1
Exhibit 16-1
In a regression analysis involving 25 observations, the following estimated regression
equation was developed.
= 10 – 18x1 + 3x2 + 14x3

Also, the following standard errors and the sum of squares were obtained.
Sb1 = 3 Sb2 = 6 Sb3 = 7
SST = 4,800 SSE = 1,296
Refer to Exhibit 16-1. The test statistic for testing the significance of the model is
a. 0.730
b. 18.926
c. 3.703
d. 1.369
Control charts that are based on data indicating the presence of a defect or the number
of defects are called ______ control charts.
a. attributes
b. variables
c. common-cause
d. assignable-cause
Chebyshev’s theorem requires that z be
a. an integer
b. greater than 1
c. less than or equal to 3
d. between 0 and 4
When each data value in one sample is matched with a corresponding data value in
another sample, the samples are known as

a. corresponding samples
b. matched samples
c. independent samples
d. None of these alternatives is correct.
Exhibit 3-3
Suppose annual salaries for sales associates from a particular store have a bell-shaped
distribution with a mean of $32,500 and a standard deviation of $2,500.
Refer to Exhibit 3-3. The z-score for a sales associate from this store who earns $28,000
is
a. 28
b. 1.8
c. -1.8
d. 0.78
Exhibit 13-4
In a completely randomized experimental design involving five treatments, thirteen
observations were recorded for each of the five treatments. The following information
is provided.
SSTR = 200 (Sum Square Between Treatments)
SST = 800 (Total Sum Square)
Refer to Exhibit 13-4. The conclusion of the test is that the five means
a. are equal
b. may be equal
c. are not equal
d. None of these alternatives is correct.

Exhibit 6-1
Consider the continuous random variable x, which has a uniform distribution over the
interval from 20 to 28.
Refer to Exhibit 6-1. The probability density function has what value in the interval
between 20 and 28?
a. 0
b. 0.050
c. 0.125
d. 1.000
The birth weight of newborns, measured in grams, is an example of
a. categorical data
b. either categorical or quantitative data
c. neither categorical nor quantitative data
d. quantitative data
Excel’s __________ function can be used to compute the mean.
a. MAX
b. AVERAGE
c. MEDIAN
d. MODE
Before drawing any conclusions about the relationship between two variables shown in
a crosstabulation, you should
a. investigate whether any hidden variables could affect the conclusions
b. construct a scatter diagram and find the trendline
c. develop a relative frequency distribution
d. construct an ogive for each of the variables
The proper way to construct a stem-and-leaf display for the data set {62, 67, 68, 73, 73,
79, 91, 94, 95, 97} is to
a. exclude a stem labeled ‘8’
b. include a stem labeled ‘8’ and enter no leaves on the stem
c. include a stem labeled ‘(8)’ and enter no leaves on the stem
d. include a stem labeled ‘8’ and enter one leaf value of ‘0’ on the stem
Exhibit 20-5
Below you are given a payoff table involving three states of nature and three decision
alternatives.
The probability of occurrence of S1 is 0.2 and the probability of occurrence of S2 is 0.3.
Refer to Exhibit 20-5. The expected value of alternative C is
a. 30
b. 6.5
c. 5.7
d. 5.5
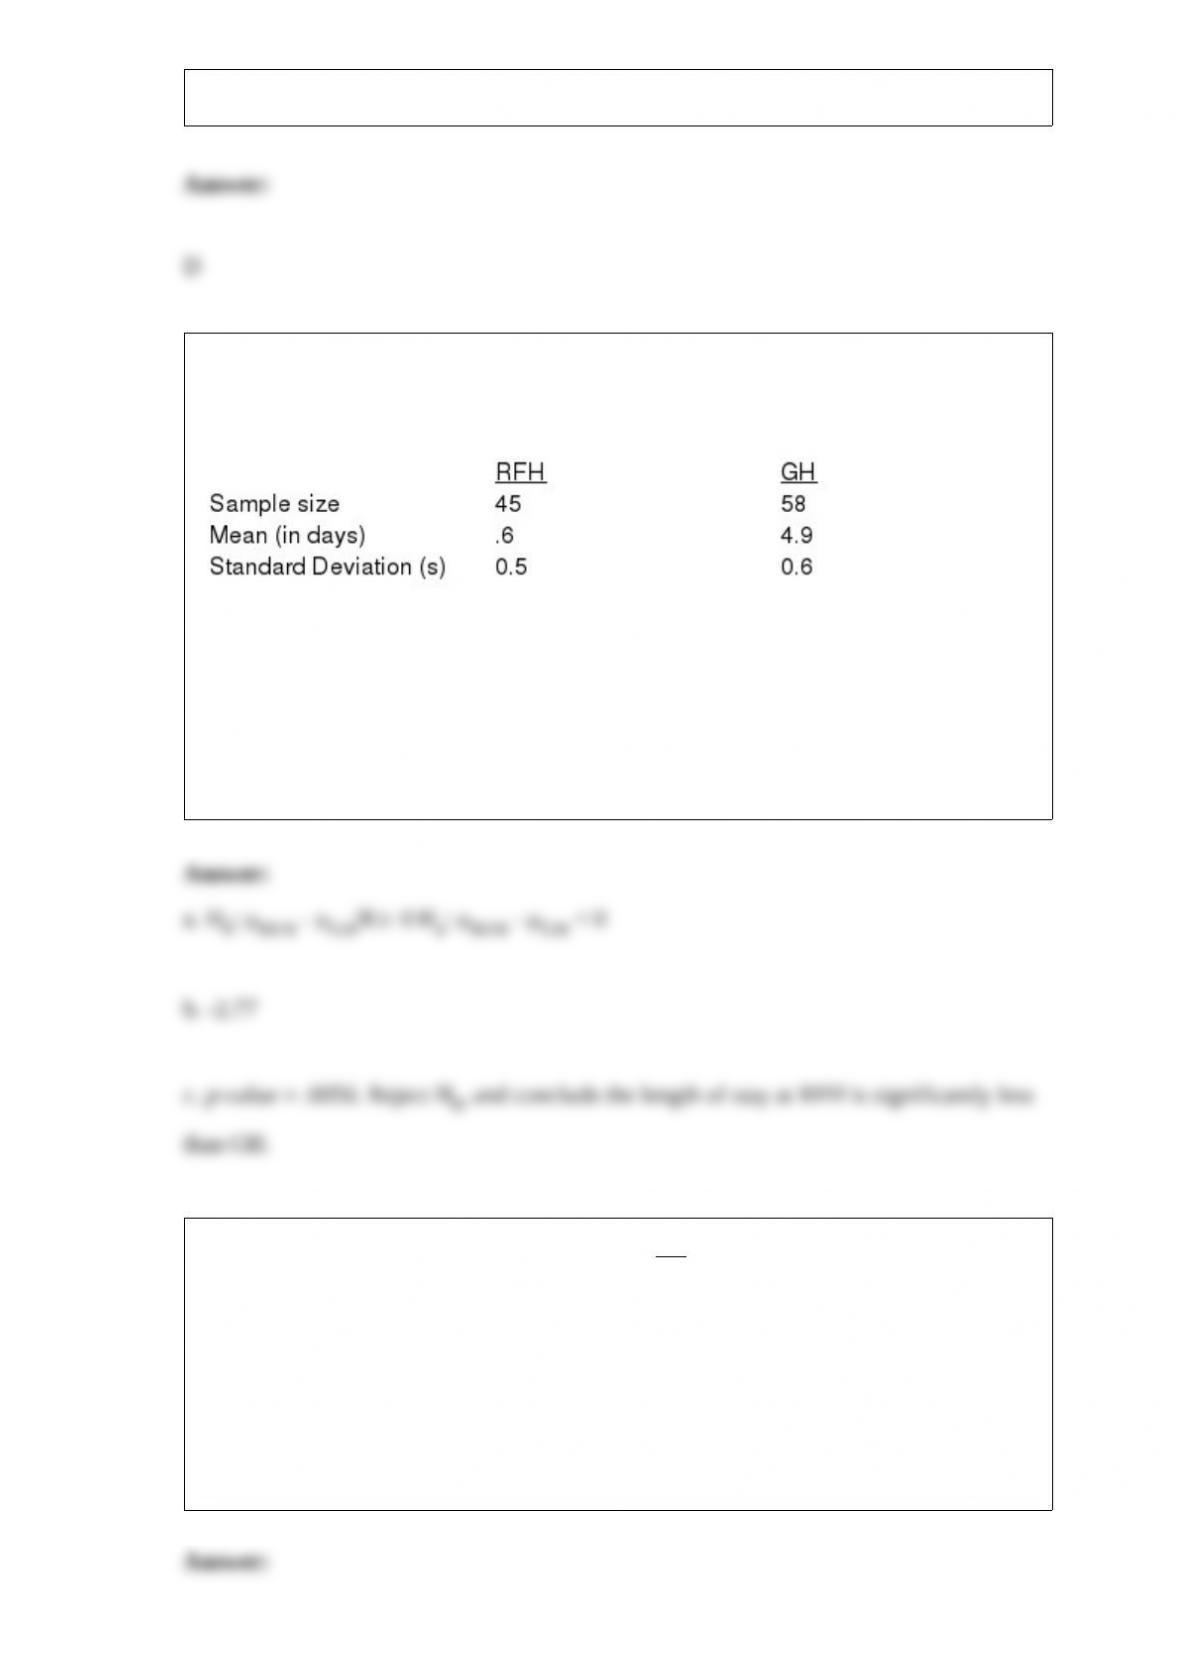
The management of Recover Fast Hospital (RFH) claims that the average length of stay
in their hospital after a major surgery is less than the average length of stay at General
Hospital (GH). The following data have been accumulated to test their claim.
a. Formulate the hypotheses.
b. Compute the test statistic.
c. Using the p-value approach, test to see if the average length of stay in RFH is
significantly less than the average length of stay in GH. Let = 0.05.
Which of the following sampling methods does not lead to probability samples?
a. stratified sampling
b. cluster sampling
c. systematic sampling
d. convenience sampling