A numerical measure, such as a mean, computed from a population is known as a
a. population parameter
b. sample parameter
c. sample statistic
d. sample mean
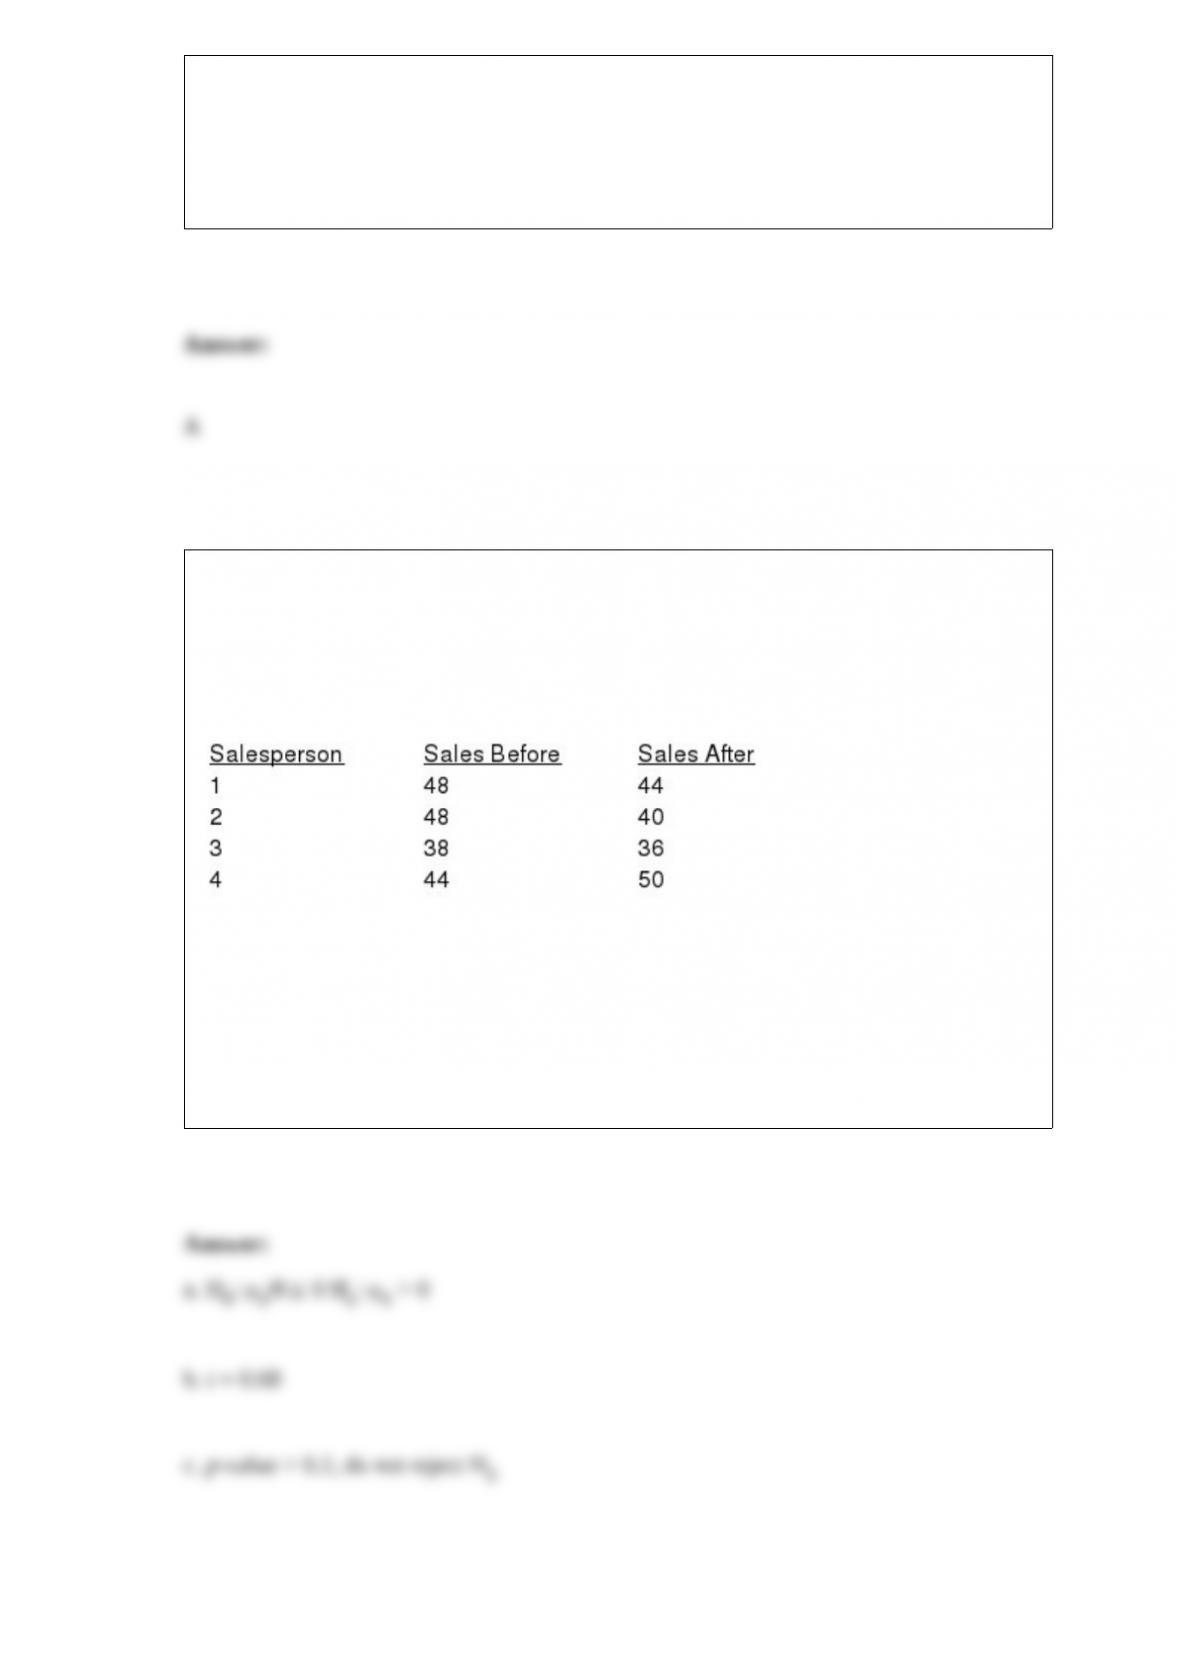
A company attempts to evaluate the potential for a new bonus plan by selecting a
sample of 4 salespersons to use the bonus plan for a trial period. The weekly sales
volume before and after implementing the bonus plan is shown below. (For the
following matched samples, let the difference “d” be d = after – before.)
a. State the hypotheses.
b. Compute the test statistic.
c. Use Alpha = .05 and test to see if the bonus plan will result in an increase in the mean
weekly sales.
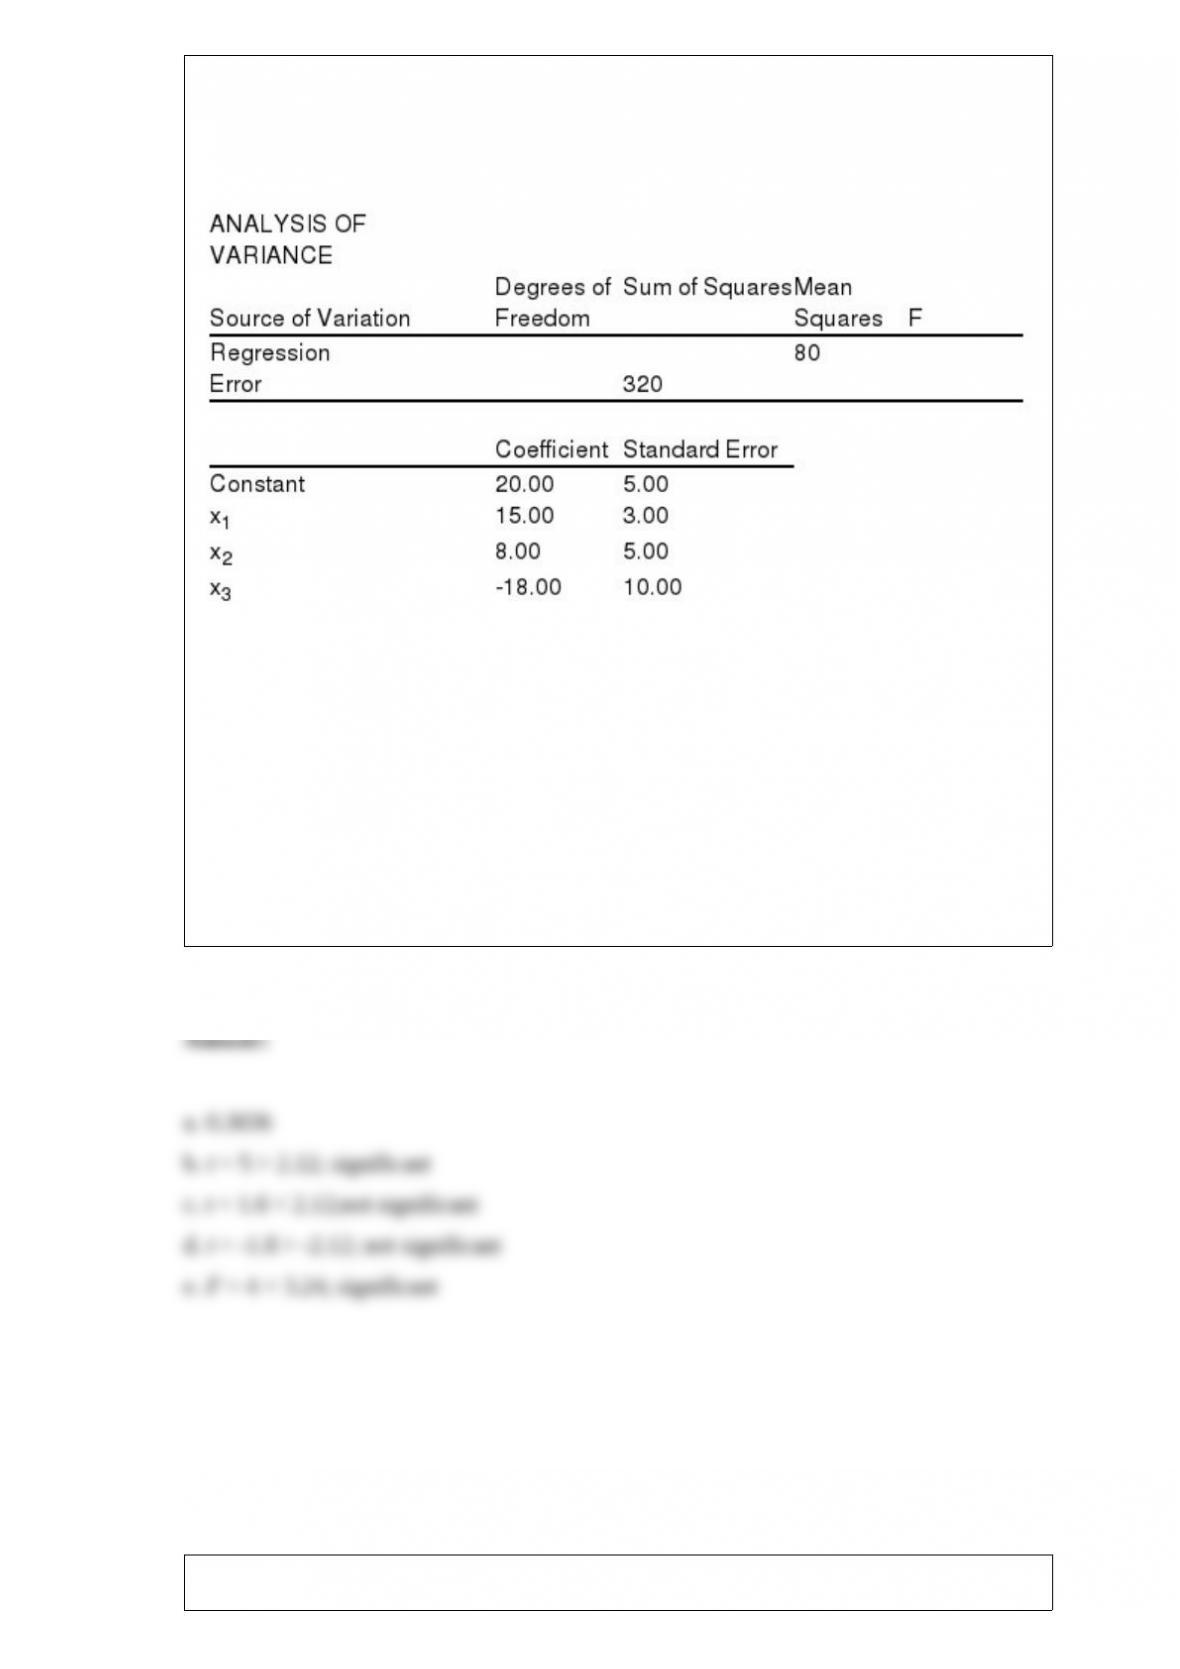
Multiple regression analysis was used to study the relationship between a dependent
variable, y, and three independent variables x1, x2 and, x3. The following is a partial
result of the regression analysis involving 20 observations.
a. Compute the coefficient of determination.
b. Perform a t test and determine whether or not 1 is significantly different from zero
( = 0.05).
c. Perform a t test and determine whether or not 2 is significantly different from zero
( = 0.05).
d. Perform a t test and determine whether or not 3 is significantly different from zero
( = 0.05).
e. At = 0.05, perform an F test and determine whether or not the regression model is
significant.
The ages of employees at a company represent
a. categorical data
b. quantitative data
c. label data
d. time series data
A statistical procedure in which the number of defective items found in a sample is used
to determine whether a lot should be accepted or rejected is called
a. statistical process control
b. acceptance sampling
c. quality assurance
d. control charts
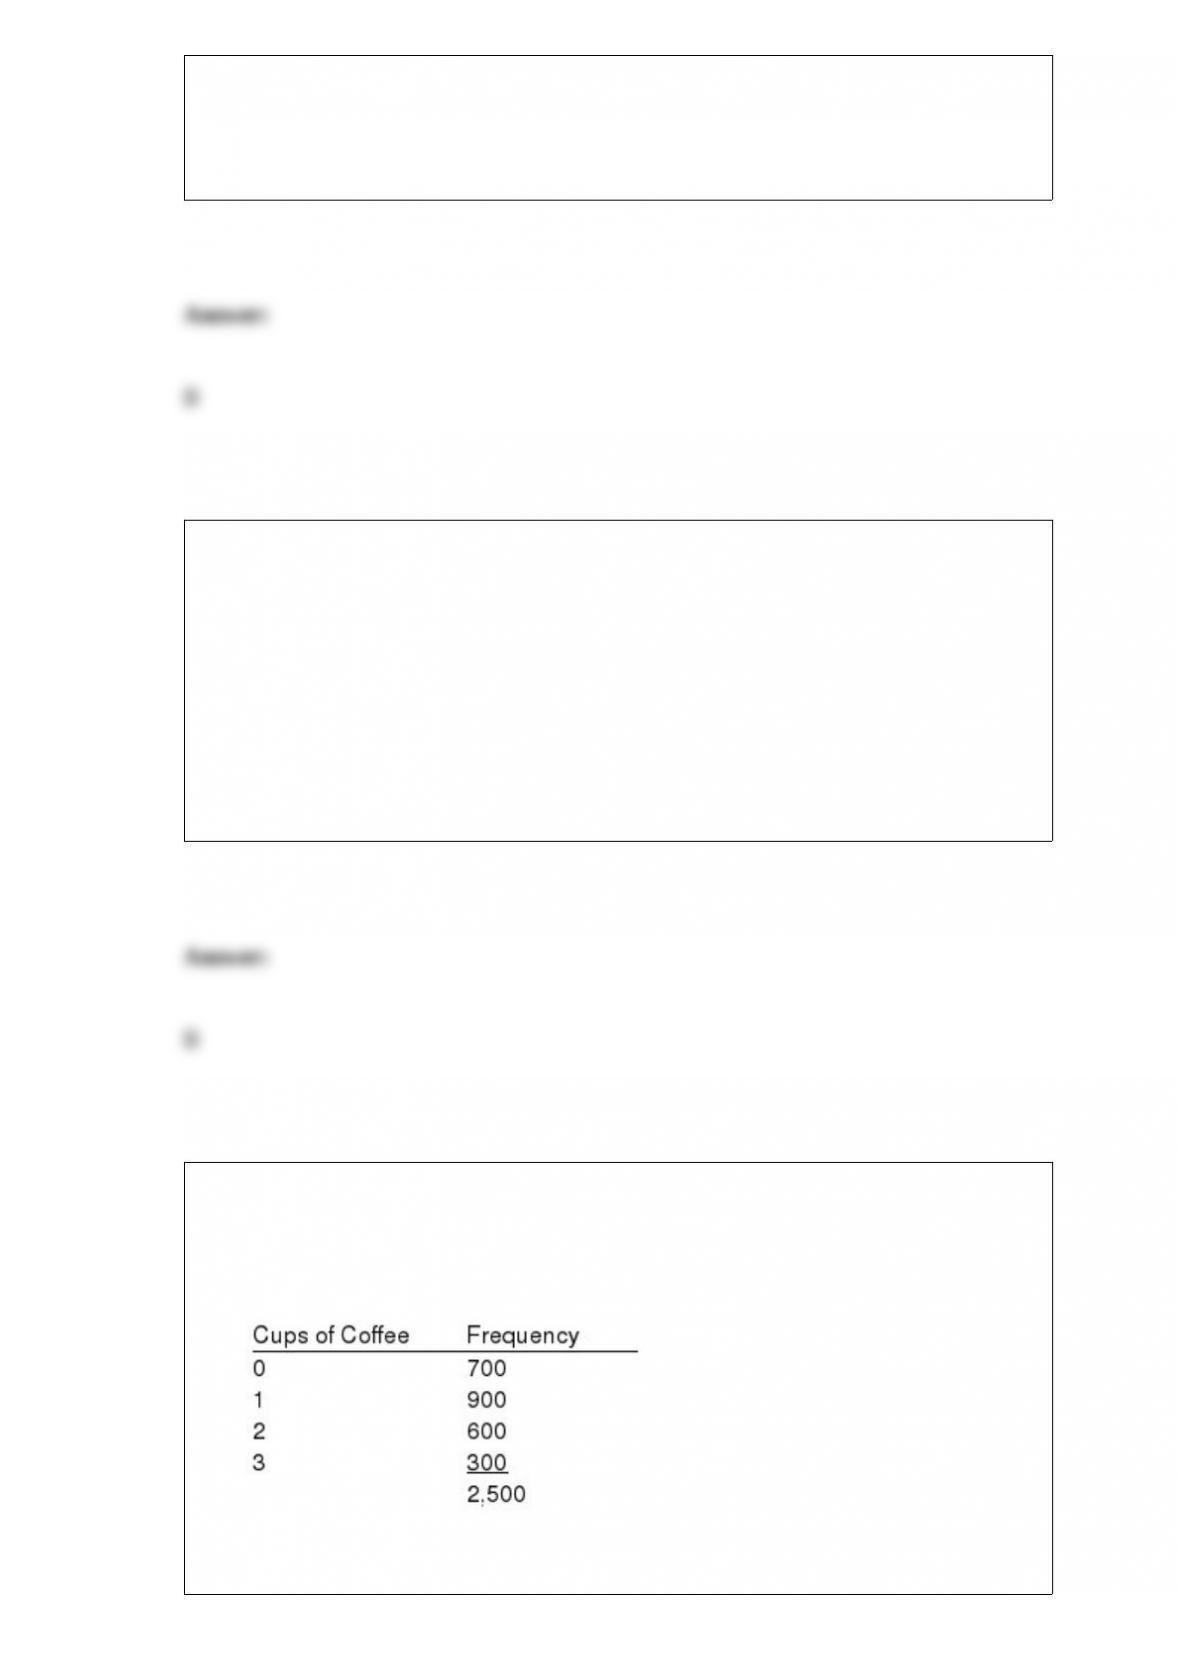
Exhibit 5-7
A sample of 2,500 people was asked how many cups of coffee they drink in the
morning. You are given the following sample information.
Refer to Exhibit 5-7. The expected number of cups of coffee is

a. 1
b. 1.2
c. 1.5
d. 1.7
A numerical measure from a population, such as a population mean, is called
a. a statistic
b. a parameter
c. a sample
d. the mean deviation
The degrees of freedom for a contingency table with 10 rows and 11 columns is
a. 100
b. 110
c. 21
d. 90
An apartment complex developer is considering building apartments in College Town,
but first wants to do a market study. A sample of monthly rent values ($) for studio
apartments in College Town was taken. The data collected from the 70-apartment
sample is presented below. (Based on past experience, the developer assumes a known
value of
= $55 for the population standard deviation.)
a. Develop a 98% confidence interval for the mean monthly rent for all studio
apartments in this city.
b. Suppose the apartment developer wants a 98% confidence interval estimate of the
population mean with a margin of error of E = $10. How large a sample size is needed?
Exhibit 11-10
Refer to Exhibit 11-10. The p-value is between
a. 0.025 and 0.05
b. 0.05 and 0.1
c. 0.1 and 0.2
d. 0.2 and 0.3
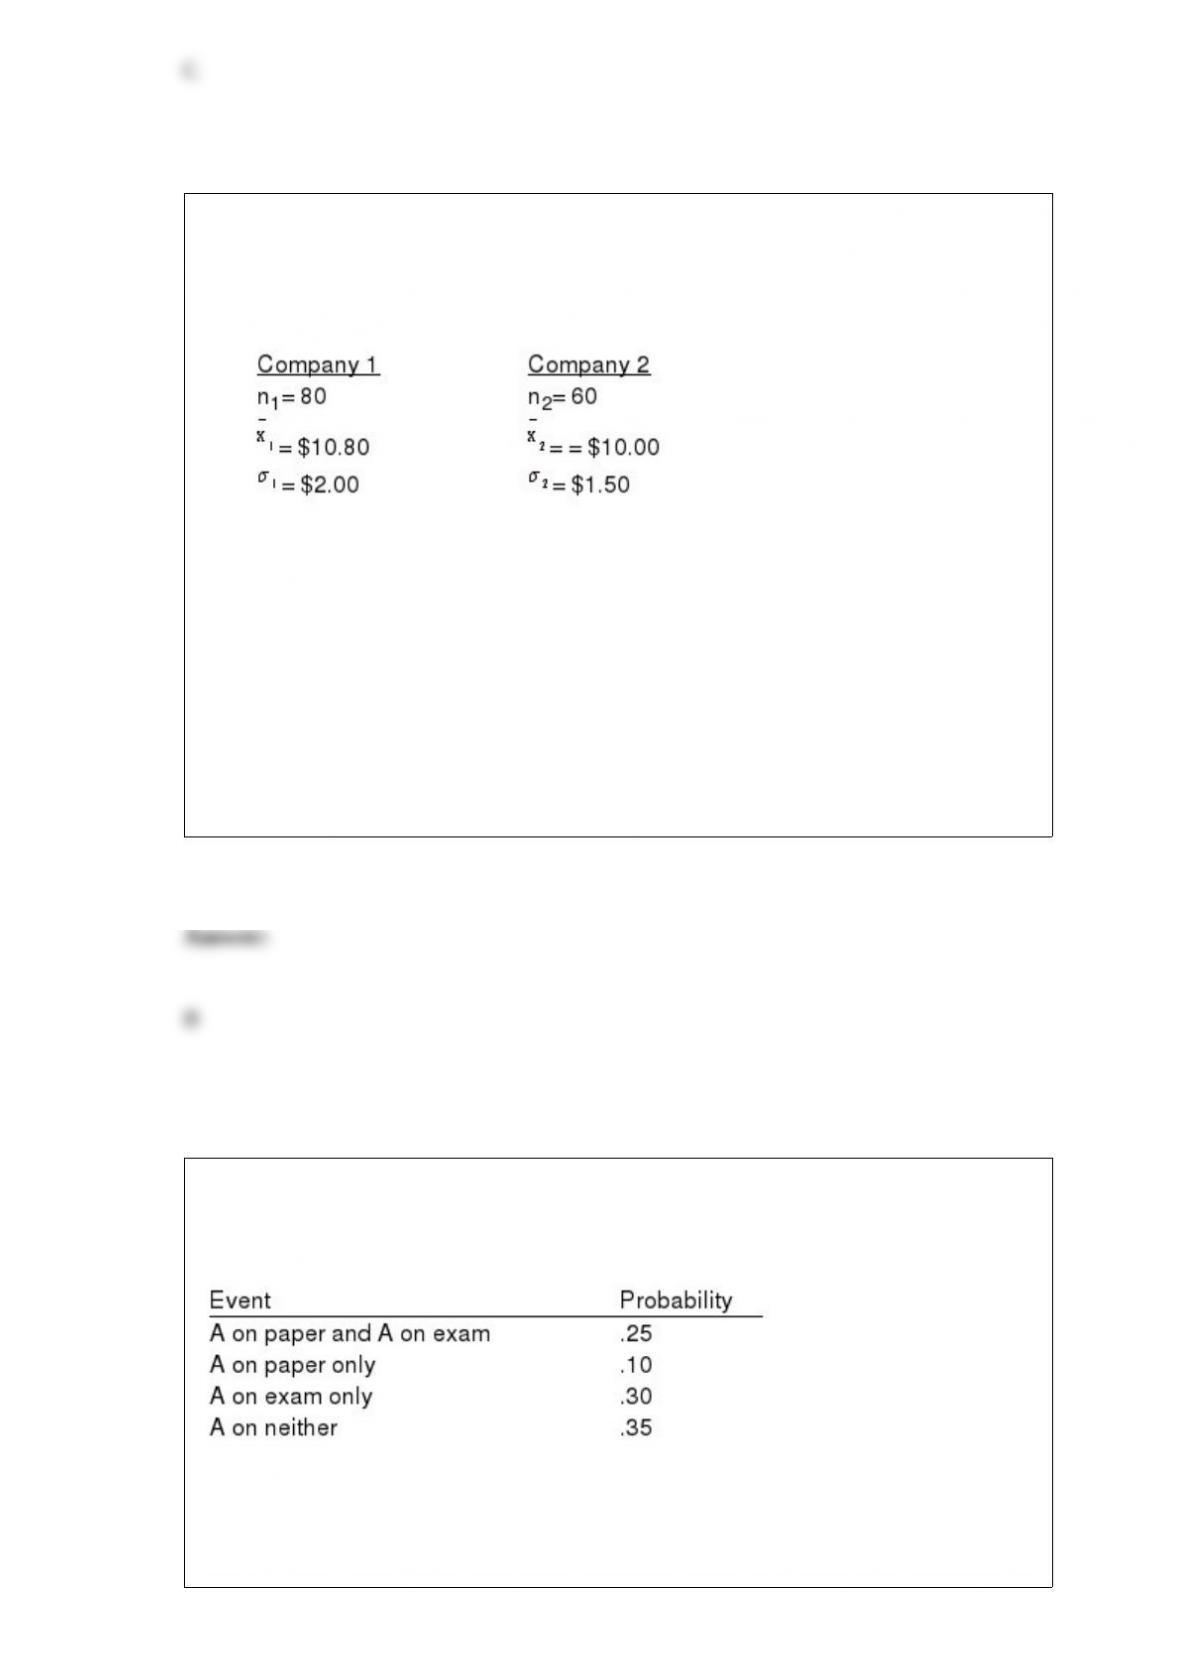
Exhibit 10-13
In order to determine whether or not there is a significant difference between the hourly
wages of two companies, the following data have been accumulated.
Refer to Exhibit 10-13. The point estimate of the difference between the means is
a.
b.
c.
d.
There are two more assignments in a class before its end, and if you get an A on at least
one of them, you will get an A for the semester. Your subjective assessment of your
performance is
a. What is the probability of getting an A on the paper?
b. What is the probability of getting an A on the exam?
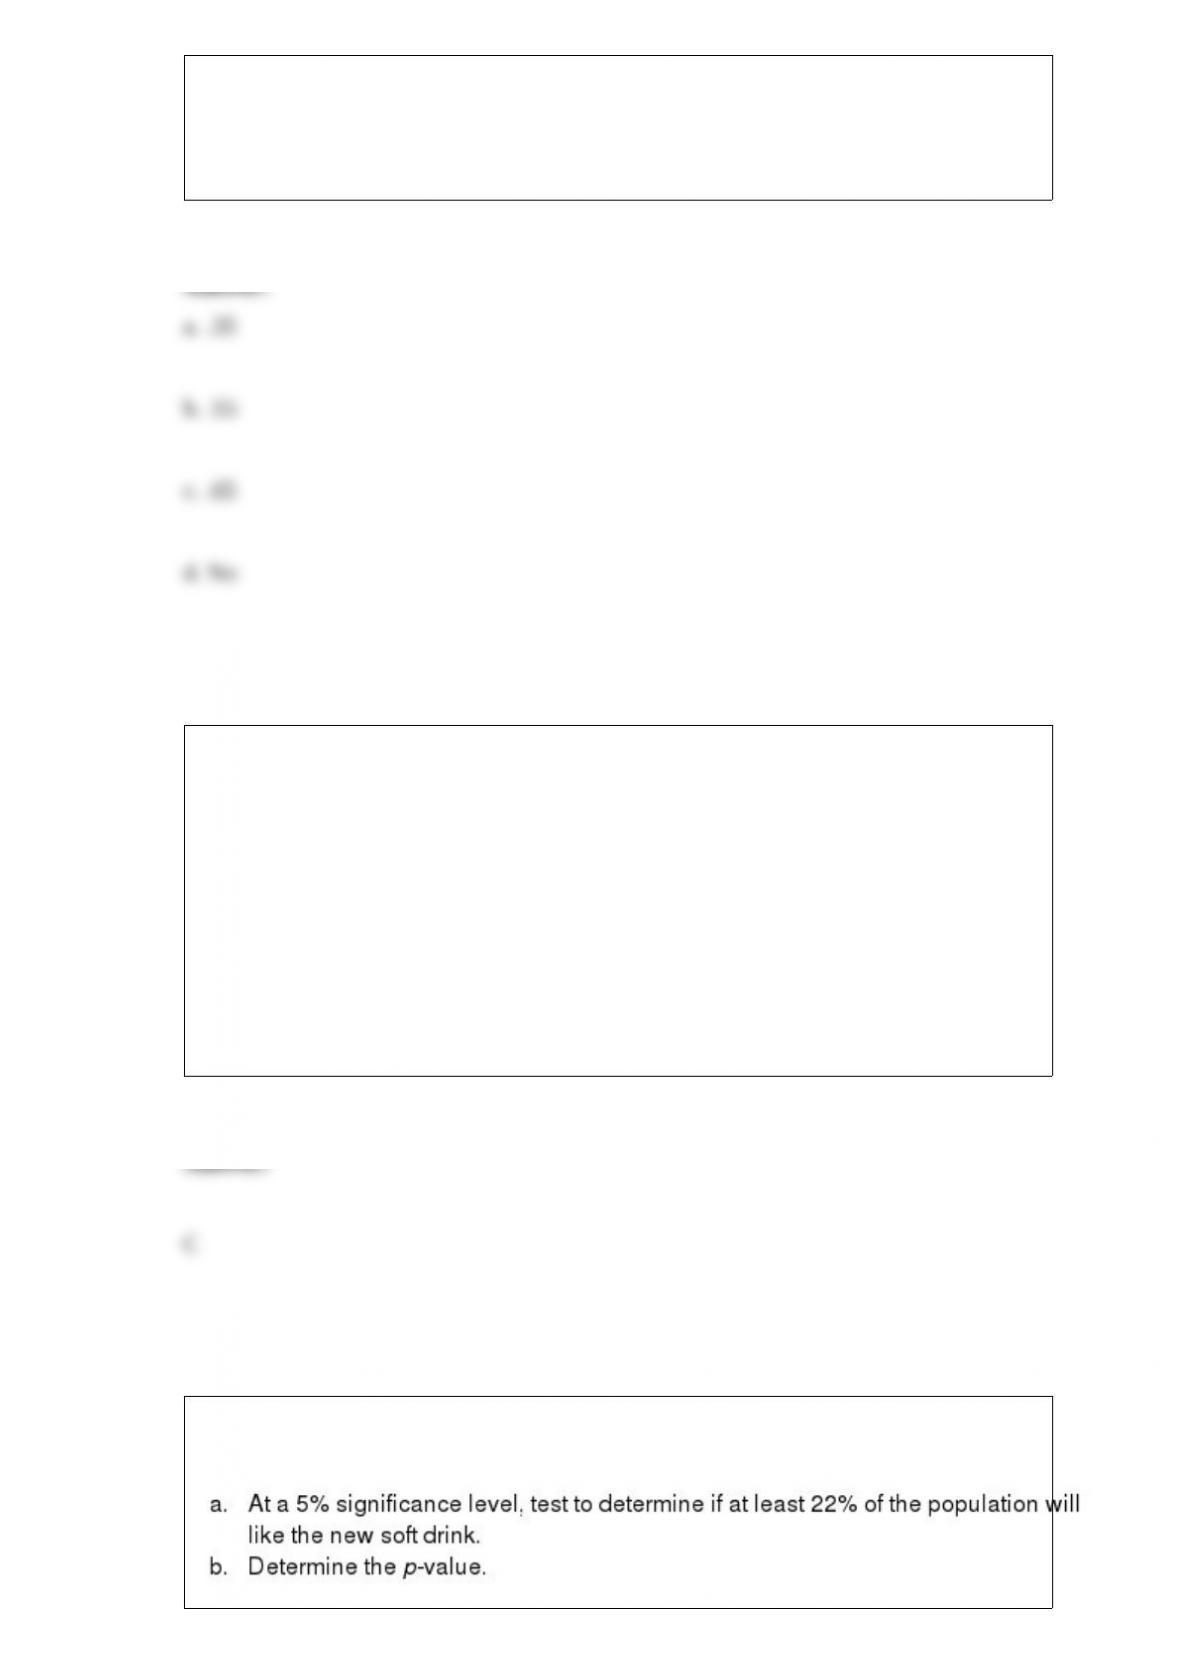
c. What is the probability of getting an A in the course?
d. Are the grades on the assignments independent?
Exhibit 13-4
In a completely randomized experimental design involving five treatments, thirteen
observations were recorded for each of the five treatments. The following information
is provided.
SSTR = 200 (Sum Square Between Treatments)
SST = 800 (Total Sum Square)
Refer to Exhibit 13-4. The mean square between treatments (MSTR) is
a. 3.34
b. 10.00
c. 50.00
d. 12.00
A new soft drink is being market tested. A sample of 400 individuals participated in the
taste test and 80 indicated they like the taste.

When autocorrelation is present, one of the assumptions of the regression model is
violated and that assumption is:
a. the expected value of the error term
is zero
b. the variance of the error term
is the same for all values of x
c. the values of the error term
are independent
d. the values of the error term
are normally distributed for all values of x
In a random sample of UTC students 50% indicated they are business majors, 40%
engineering majors, and 10% other majors. Of the business majors, 60% were females;
whereas, 30% of engineering majors were females. Finally, 20% of the other majors
were female.
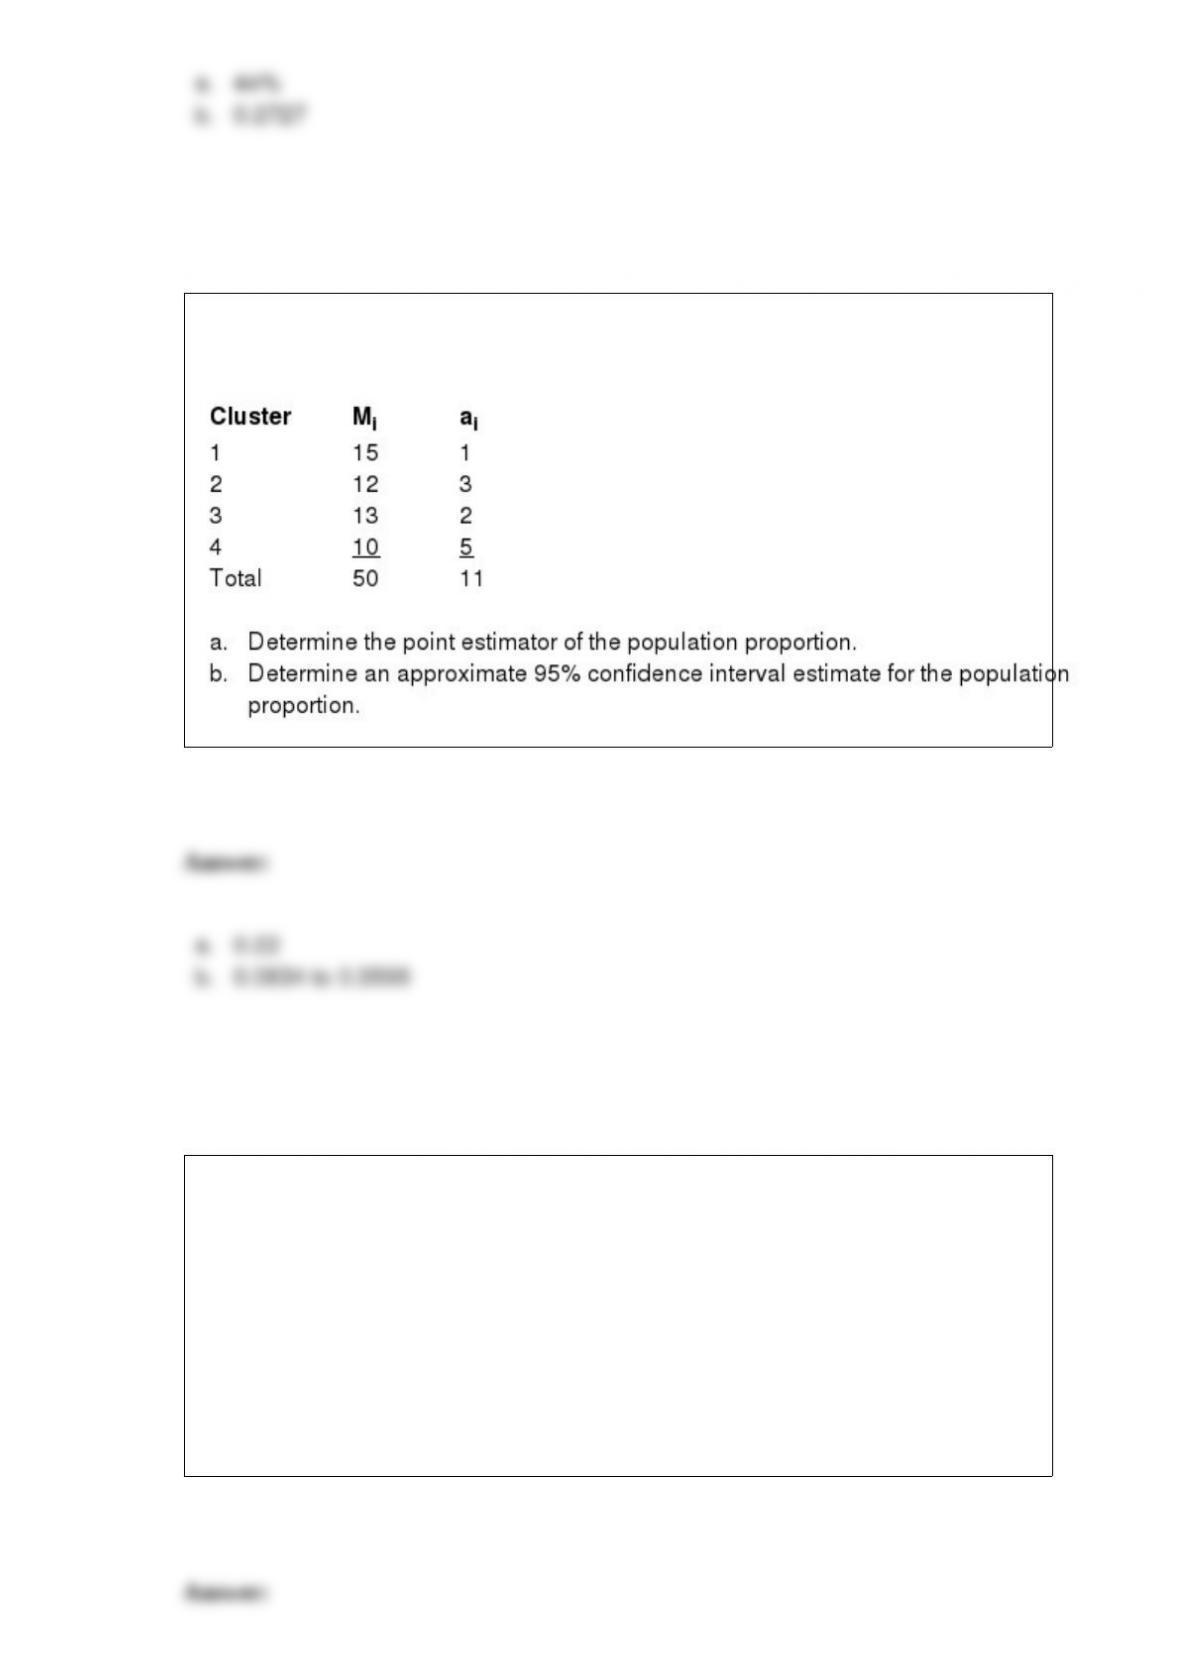
A sample of 4 clusters is to be taken from a population with N = 40 clusters and M =
600 clusters in the population. The values of Mi and ai are given below.
The addition law is potentially helpful when we are interested in computing the
probability of
a. independent events
b. the intersection of two events
c. the union of two events
d. conditional events

A random sample of 49 lunch customers was taken at a restaurant. The average amount
of time the customers in the sample stayed in the restaurant was 33 minutes. From past
experience, it is known that the population standard deviation equals 10 minutes.
a. Compute the standard error of the mean.
b. What can be said about the sampling distribution for the average amount of time
customers spent in the restaurant? Be sure to explain your answer.
c. With a .95 probability, what statement can be made about the size of the margin of
error?
d. Construct a 95% confidence interval for the true average amount of time customers
spent in the restaurant.
e. With a .95 probability, how large of a sample would have to be taken to provide a
margin of error of 2.5 minutes or less?
The time series pattern that reflects a gradual shift or movement to a relatively higher or
lower level over a longer time period is called the
a. trend pattern

b. seasonal pattern
c. cyclical pattern
d. trend and seasonal pattern
A goodness of fit test is always conducted as a
a. lower-tail test
b. upper-tail test
c. middle test
d. None of these alternatives is correct.
A continuous probability distribution that is useful in describing the time, or space,
between occurrences of an event is a(n)
a. normal probability distribution
b. uniform probability distribution
c. exponential probability distribution
d. Poisson probability distribution
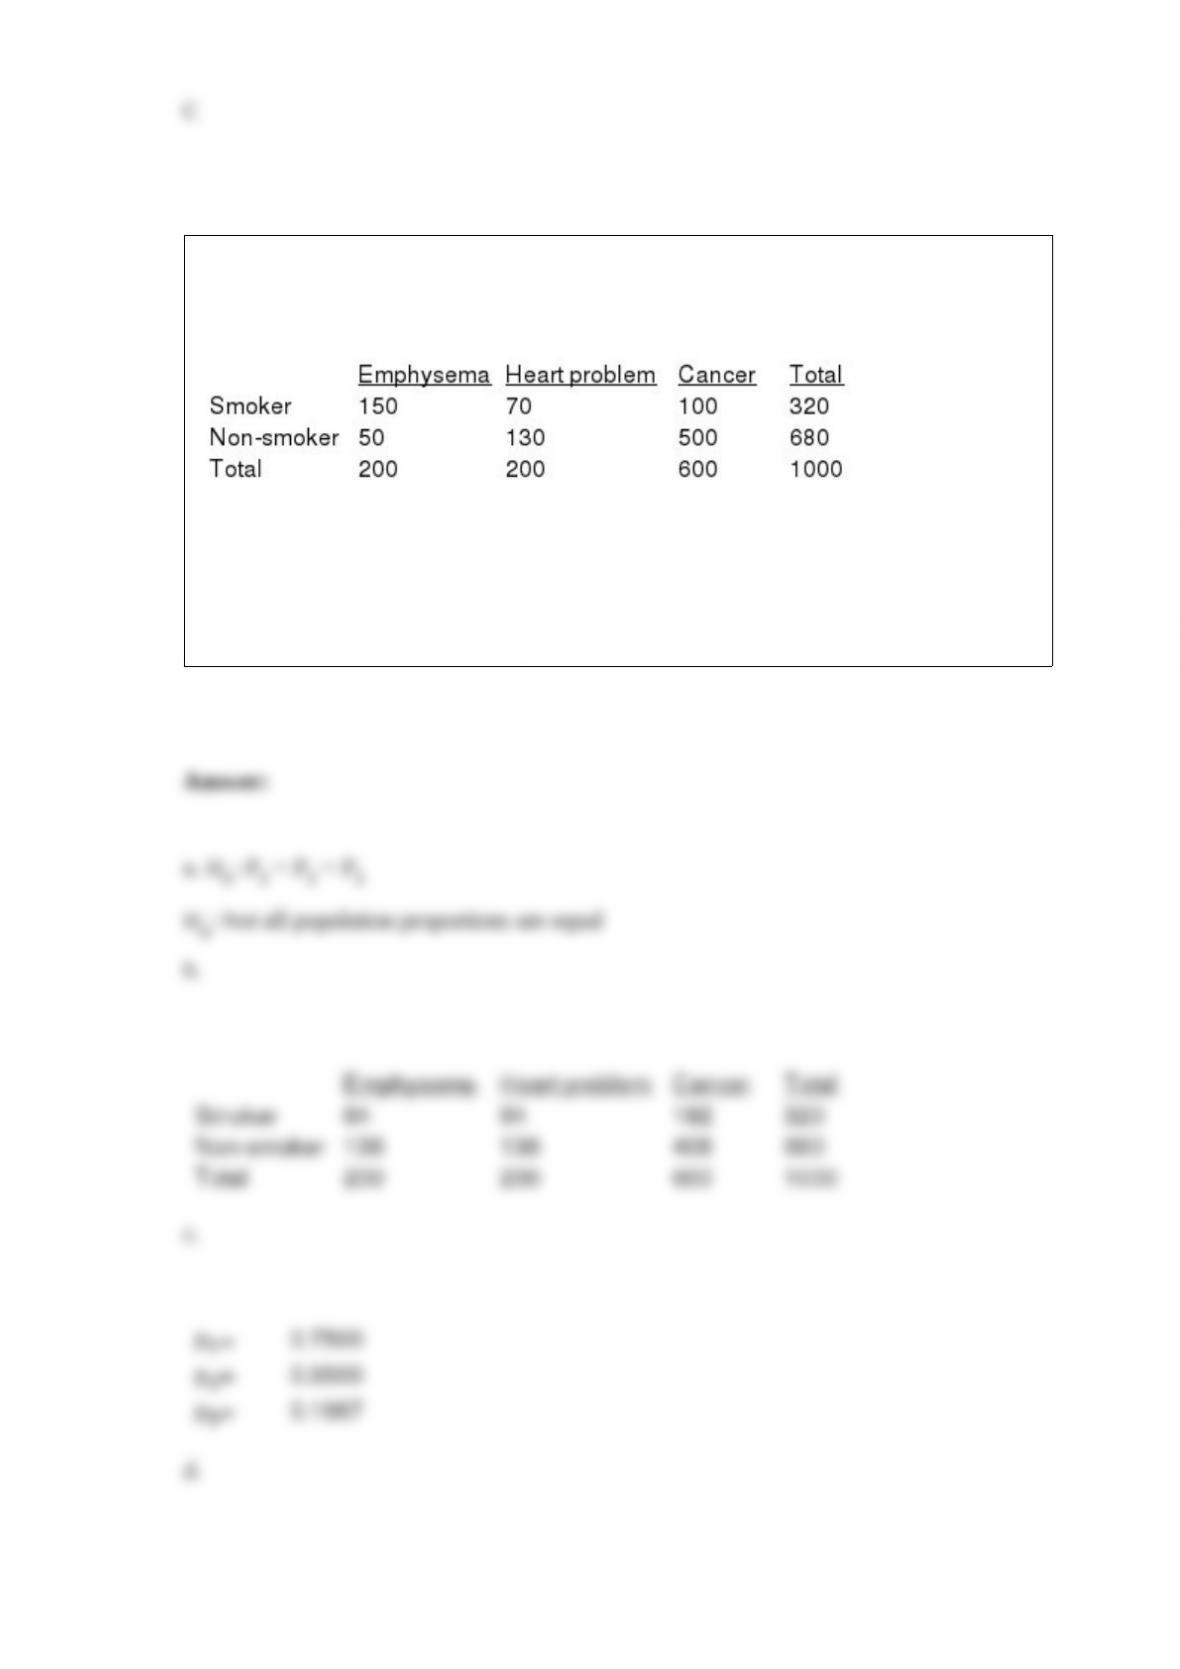
The following table shows the results of a study on smoking and three illnesses. We are
interested in determining if the proportions smokers in the three categories are different
from each other.
a. Provide the null and the alternative hypotheses.
b. Determine the expected frequencies.
c. Compute the sample proportions.
d. Compute the critical values (CVij).
e. Give your conclusions by providing numerical reasoning.
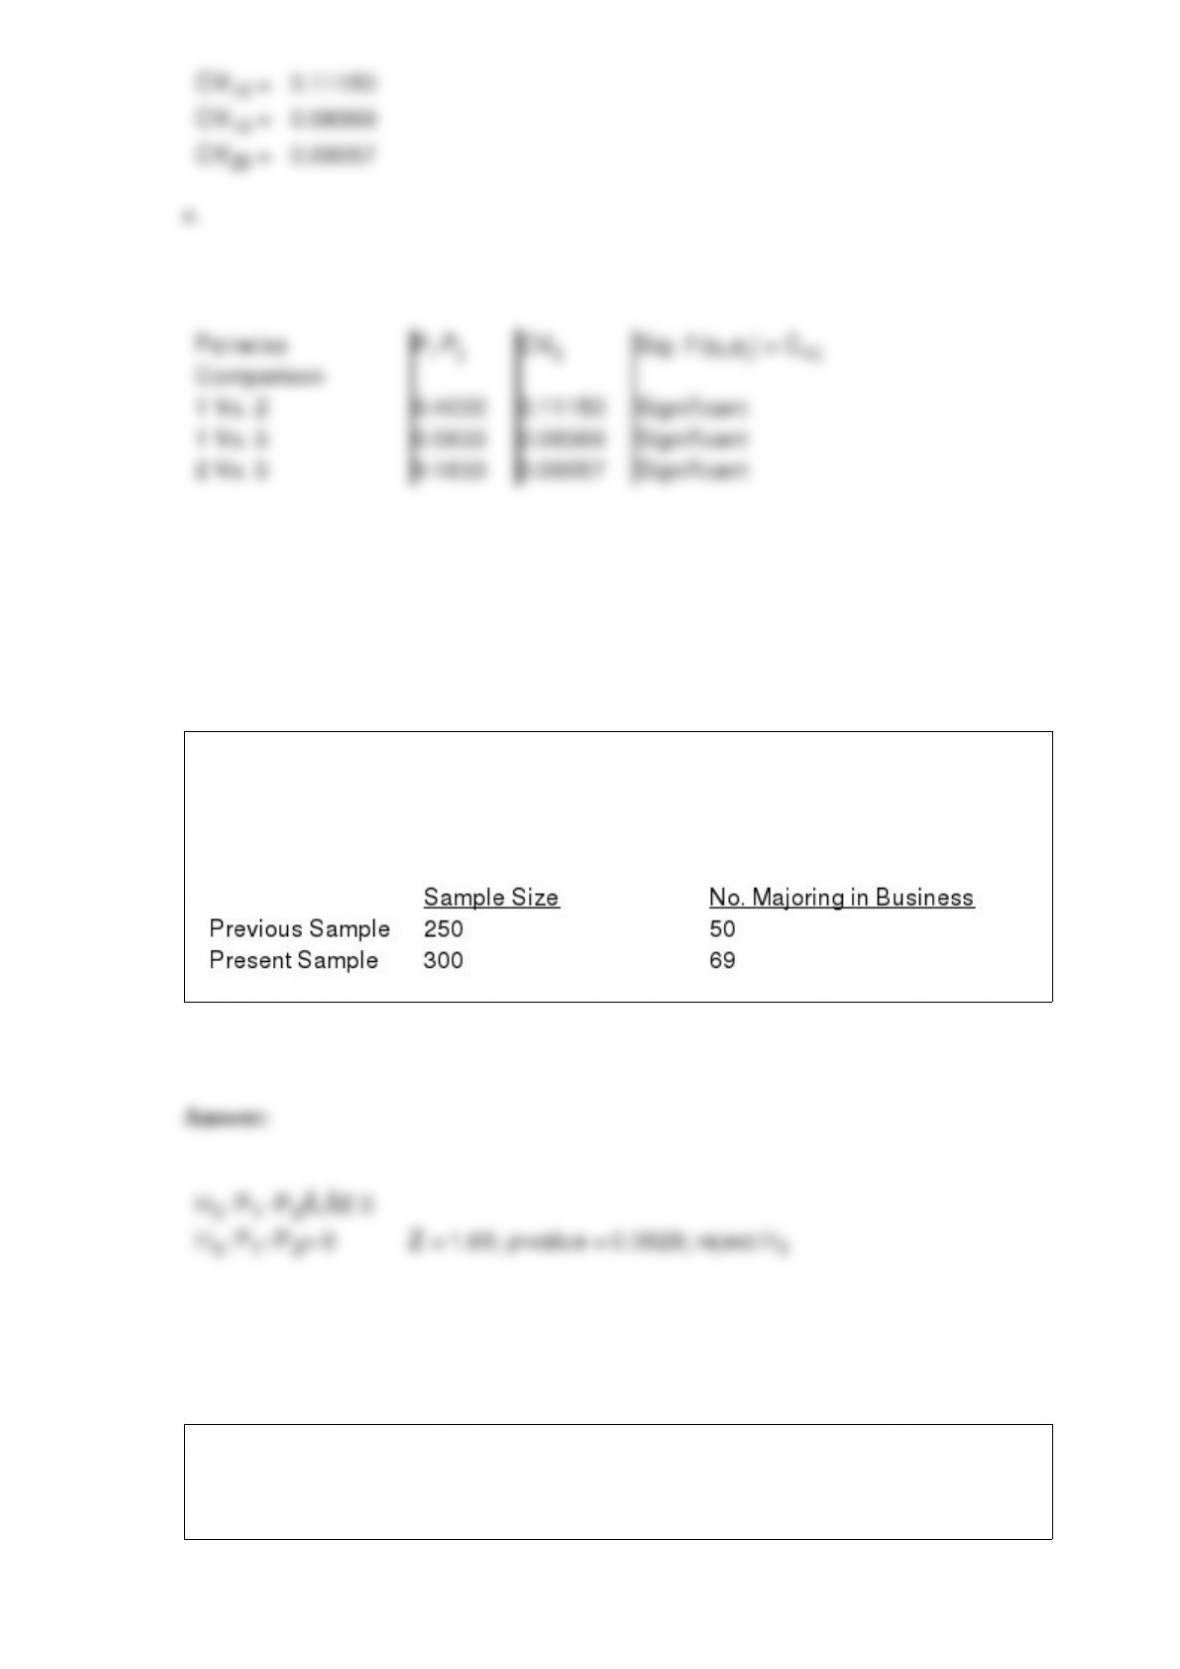
The office of records at a university has stated that the proportion of incoming female
students who major in business has increased. A sample of female students taken
several years ago is compared with a sample of female students this year. Results are
summarized below. Has the proportion increased significantly? Test at alpha = .10.
In a television commercial, the manufacturer of a toothpaste claims that at least 4 out of
5 dentists recommend its product. A consumer-protection group wants to test that claim.
Identify the hypotheses.
A company has claimed that the standard deviation of the monthly incomes of their
employees is less than or equal to $120. To test their claim, a random sample of 15
employees of the company was taken; and it was determined that the standard deviation
of their incomes was $135. At a 5% level of significance, test the company’s claim.
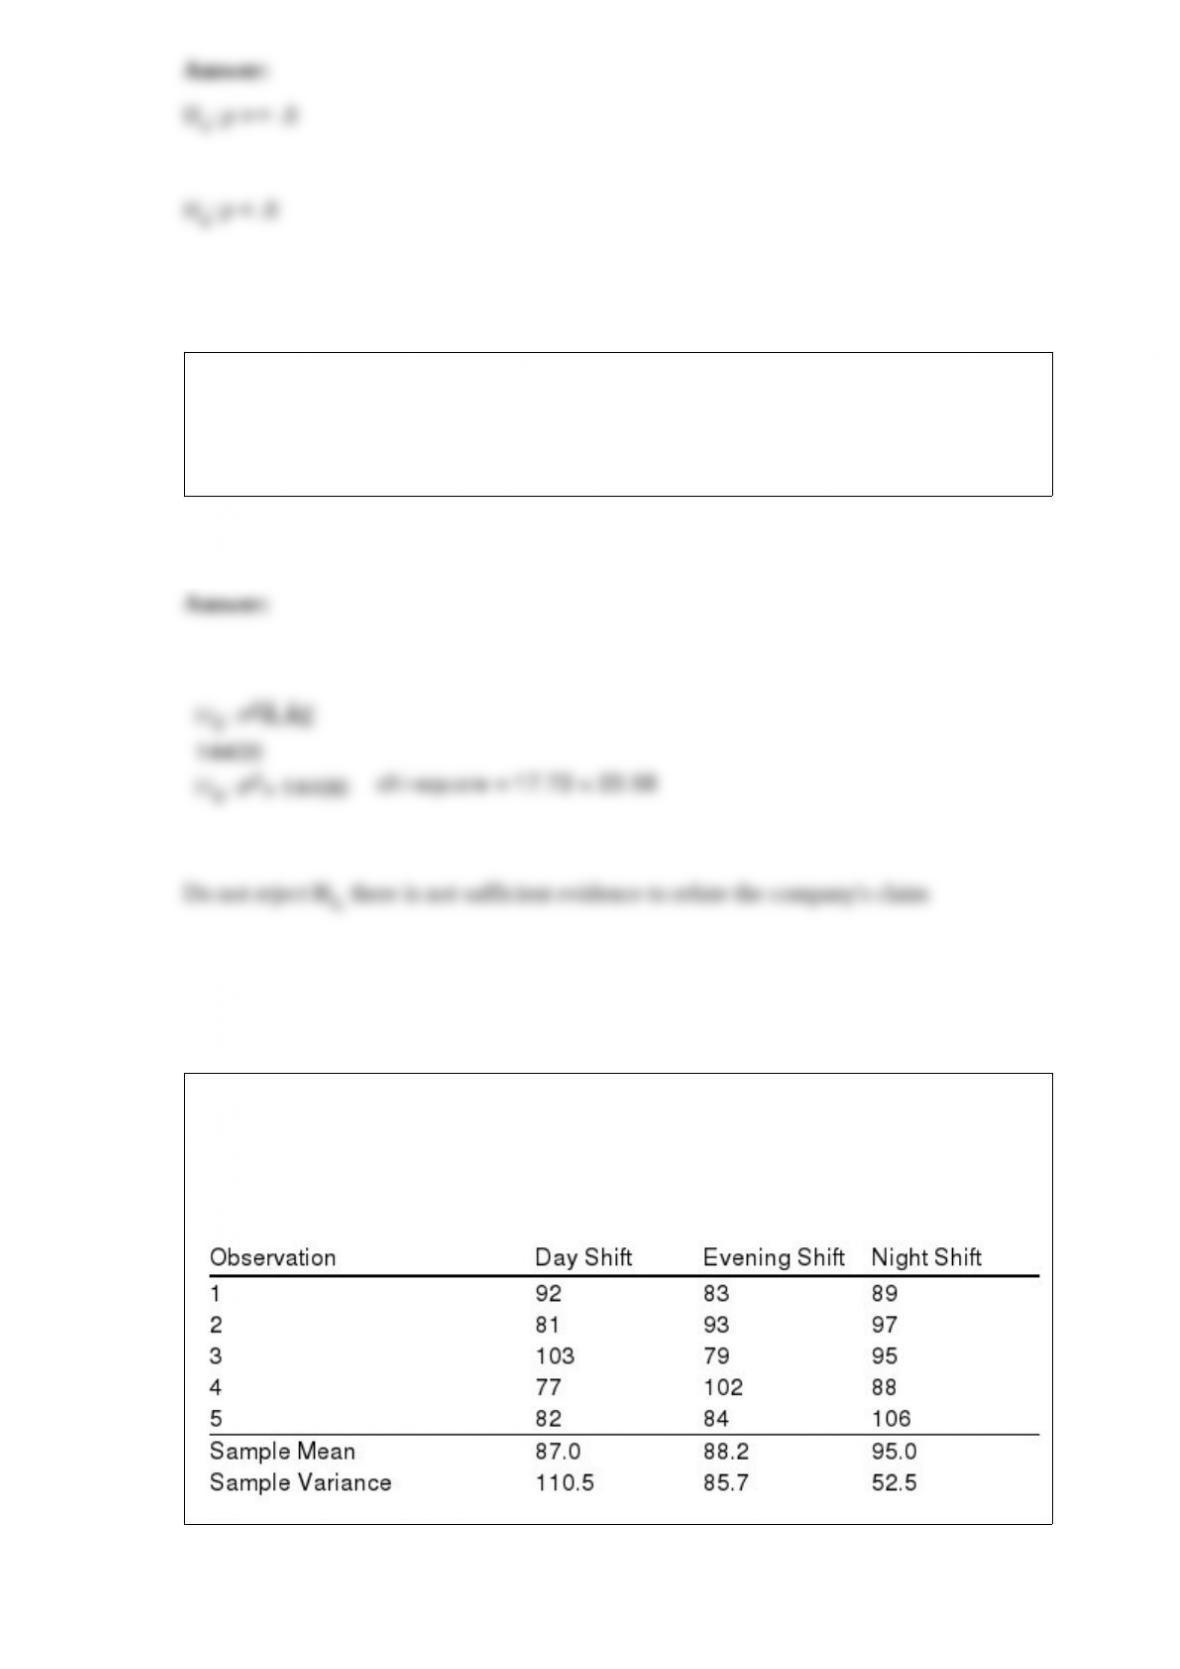
To test whether the time required to fully load a standard delivery truck is the same for
three work shifts (day, evening, and night), NatEx obtained the following data on the
time (in minutes) needed to pack a truck. Use these data to test whether the population
mean times for loading a truck differ for the three work shifts. Use
= .05.
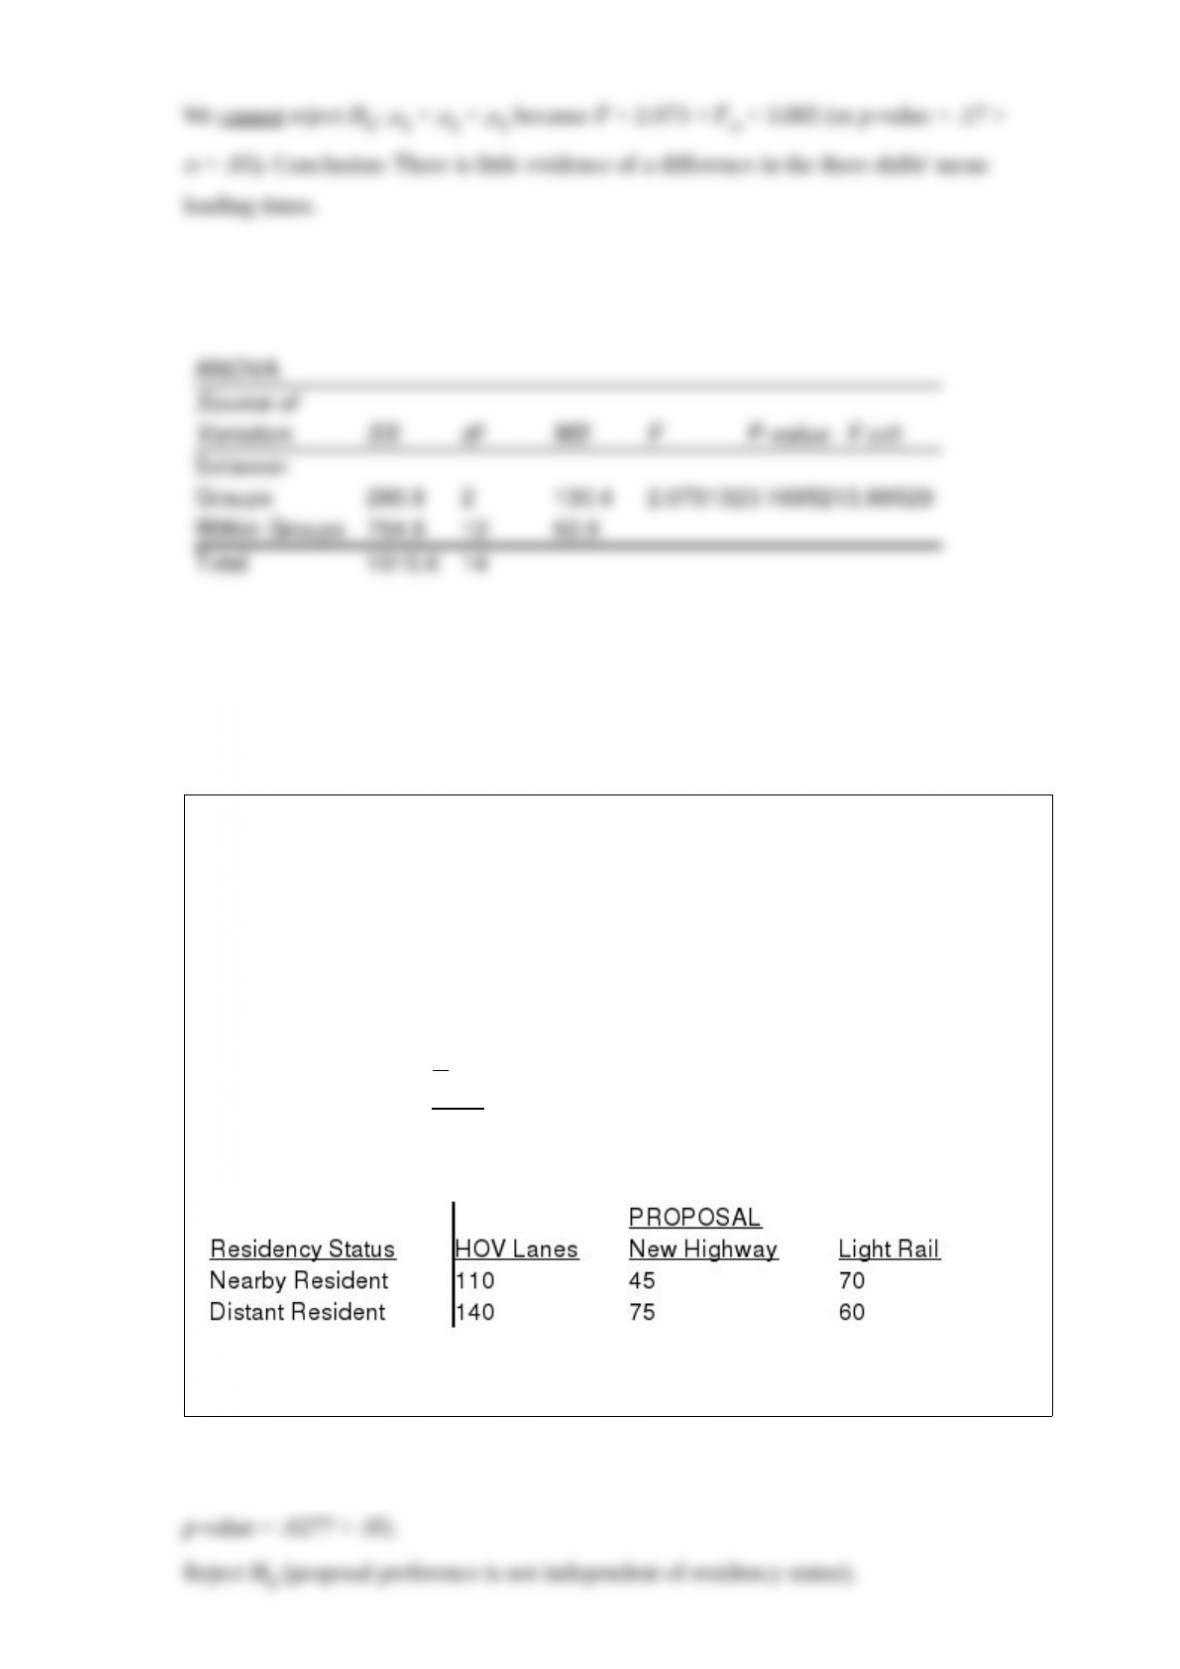
City planners are evaluating three proposed alternatives for relieving the growing traffic
congestion on a north-south highway in a booming city. The proposed alternatives are:
(1) designate high-occupancy vehicle (HOV) lanes on the existing highway, (2)
construct a new, parallel highway, and (3) construct a light (passenger) rail system.
In an analysis of the three proposals, a citizen group has raised the question of whether
preferences for the three alternatives differ among residents near the highway and
non-residents. A test of independence will address this question, with the hypotheses
being:
H0: Proposal preference is independent of the residency status of the individual
Ha: Proposal preference is not independent of the residency status of the individual
A simple random sample of 500 individuals has been selected. A crosstabulation of the
residency statuses and proposal preferences of the individuals sampled is shown below.
Conduct a test of independence using
= .05 to address the question of whether
residency status is independent of the proposal preference.
A regression model with one independent variable, x1, resulted in an SSE of 50. When a
second independent variable, x2, was added to the model, the SSE was reduced to 40.
At = 0.05, determine if x2 contributes significantly to the model. The sample size for
both models was 30.
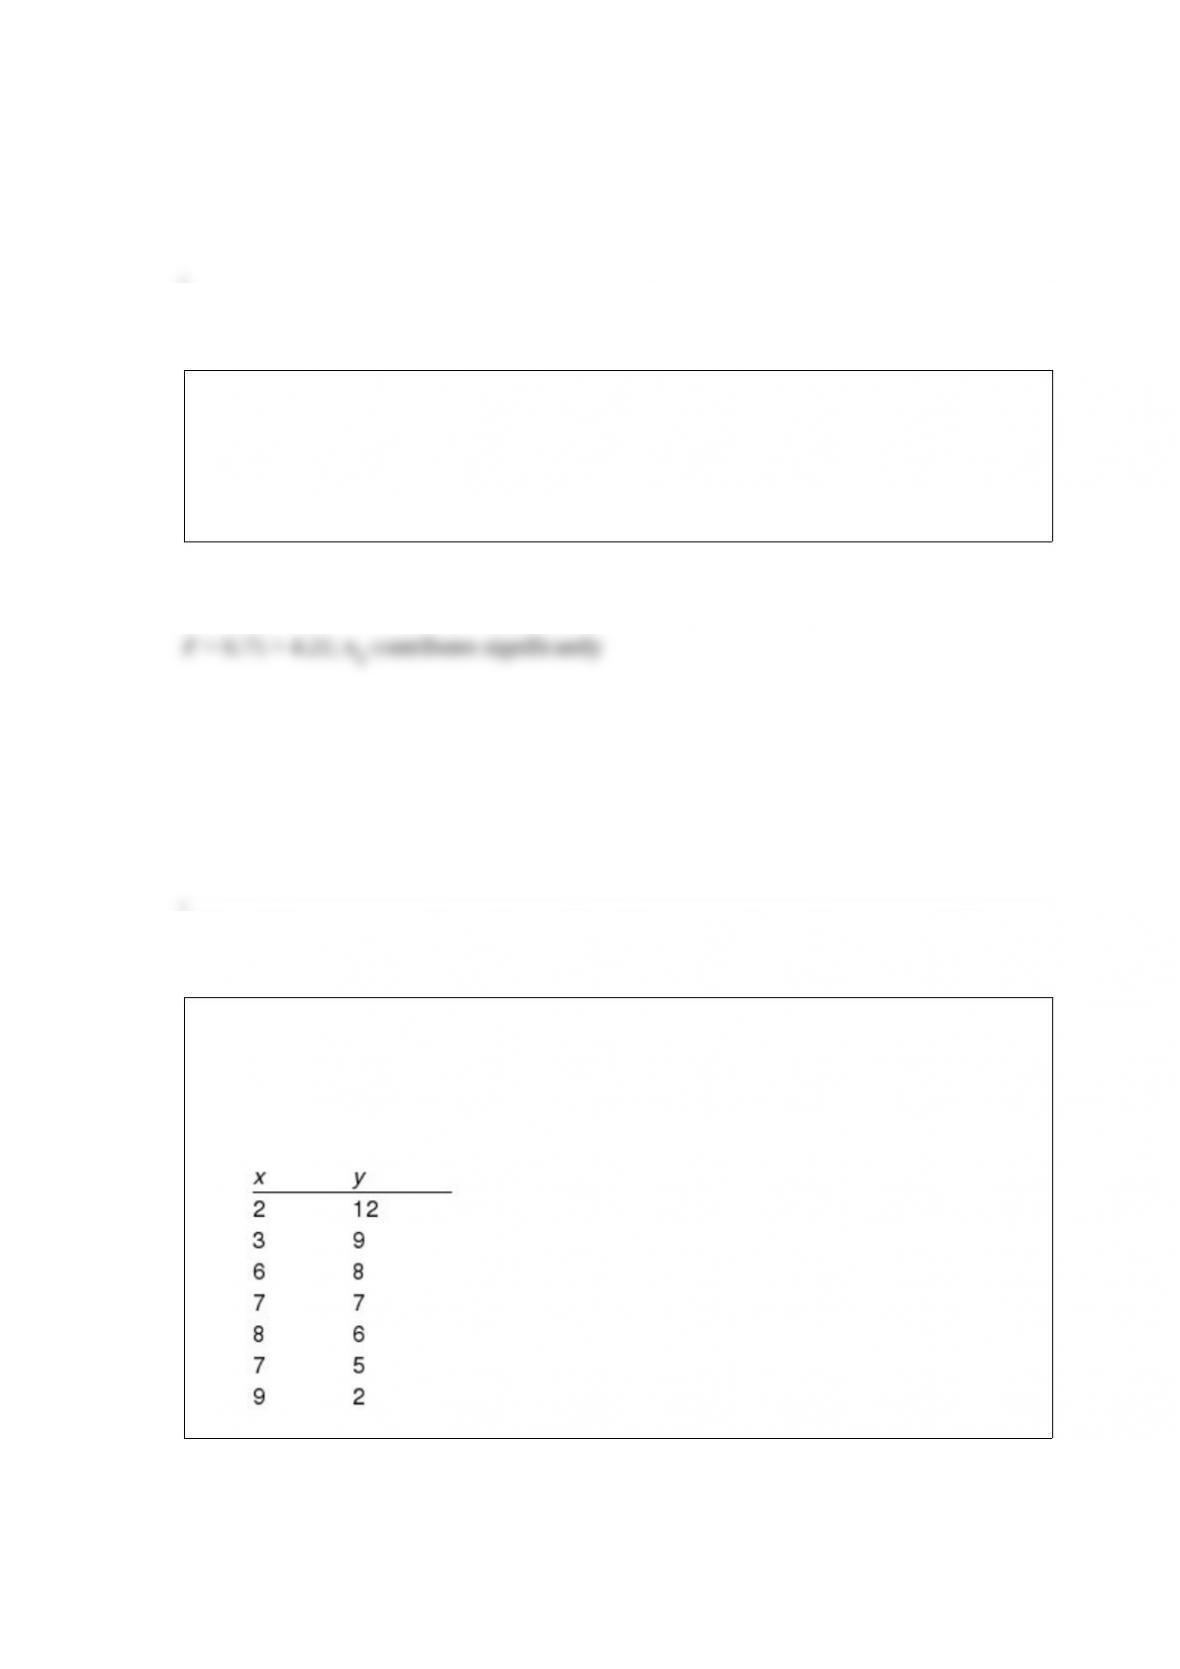
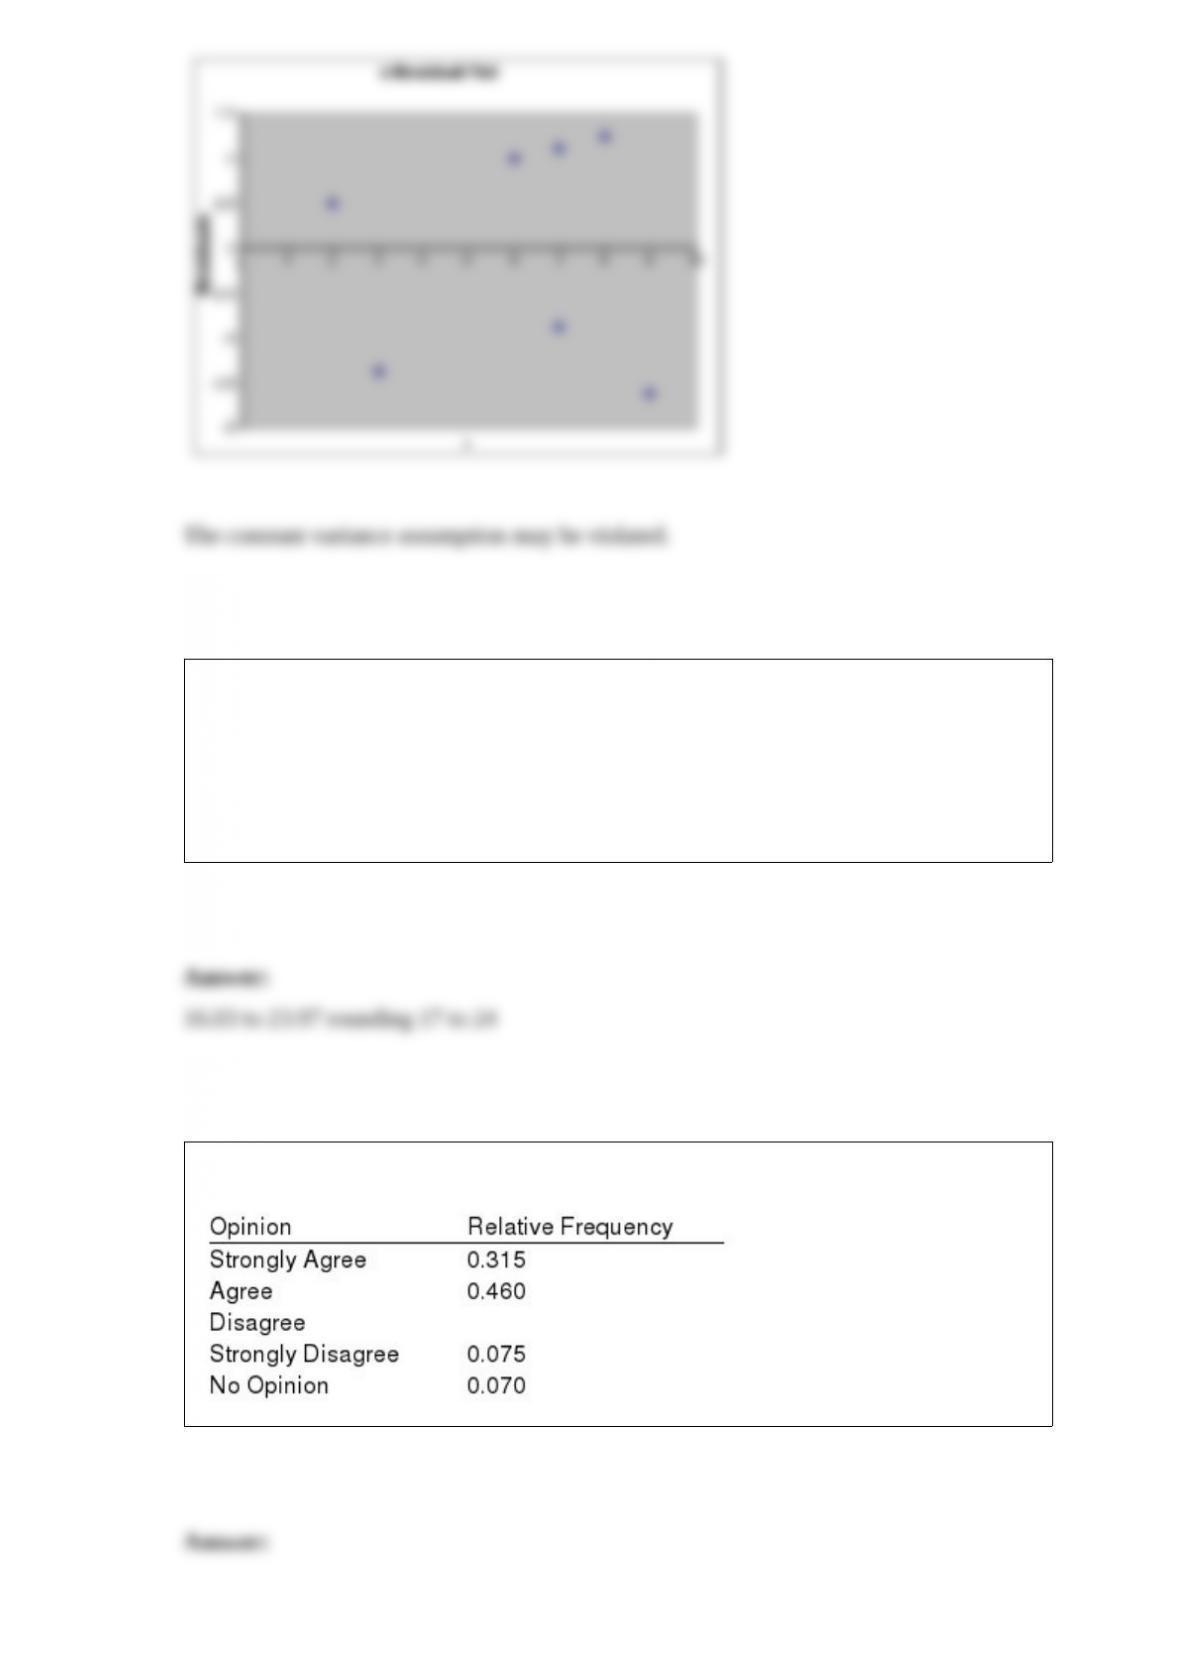
Given below are seven observations collected in a regression study on two variables, x
(independent variable) and y (dependent variable). Use Excel’s Regression Tool to
construct a residual plot and use it to determine if any model assumption have been
violated.
A potential investor conducted a 49 day survey in two theaters in order to determine the
difference between the average daily attendance at North Mall and South Mall Theaters.
The North Mall Theater averaged 720 patrons per day with a variance of 100; while the
South Mall Theater averaged 700 patrons per day with a variance of 96. Develop an
interval estimate for the difference between the average daily attendance at the two
theaters. Use a confidence coefficient of 0.95.
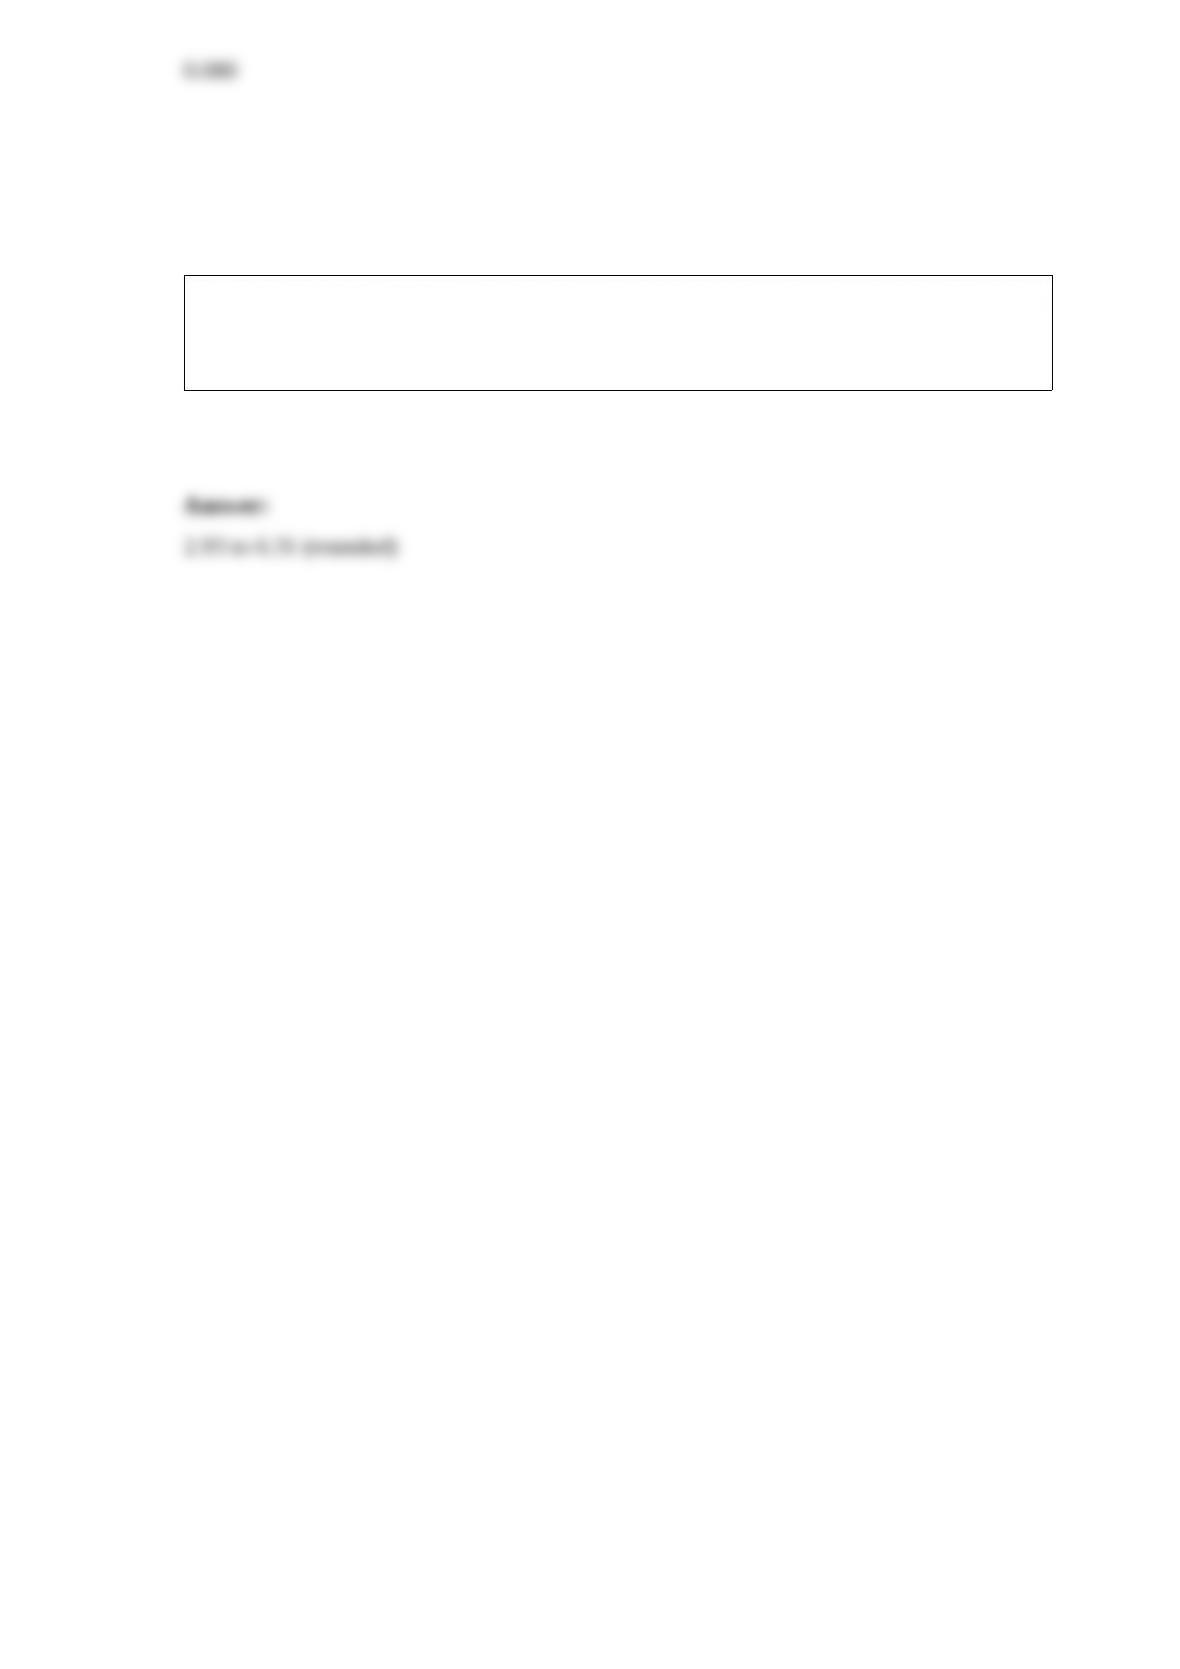
Fill in the missing value for the following relative frequency distribution.
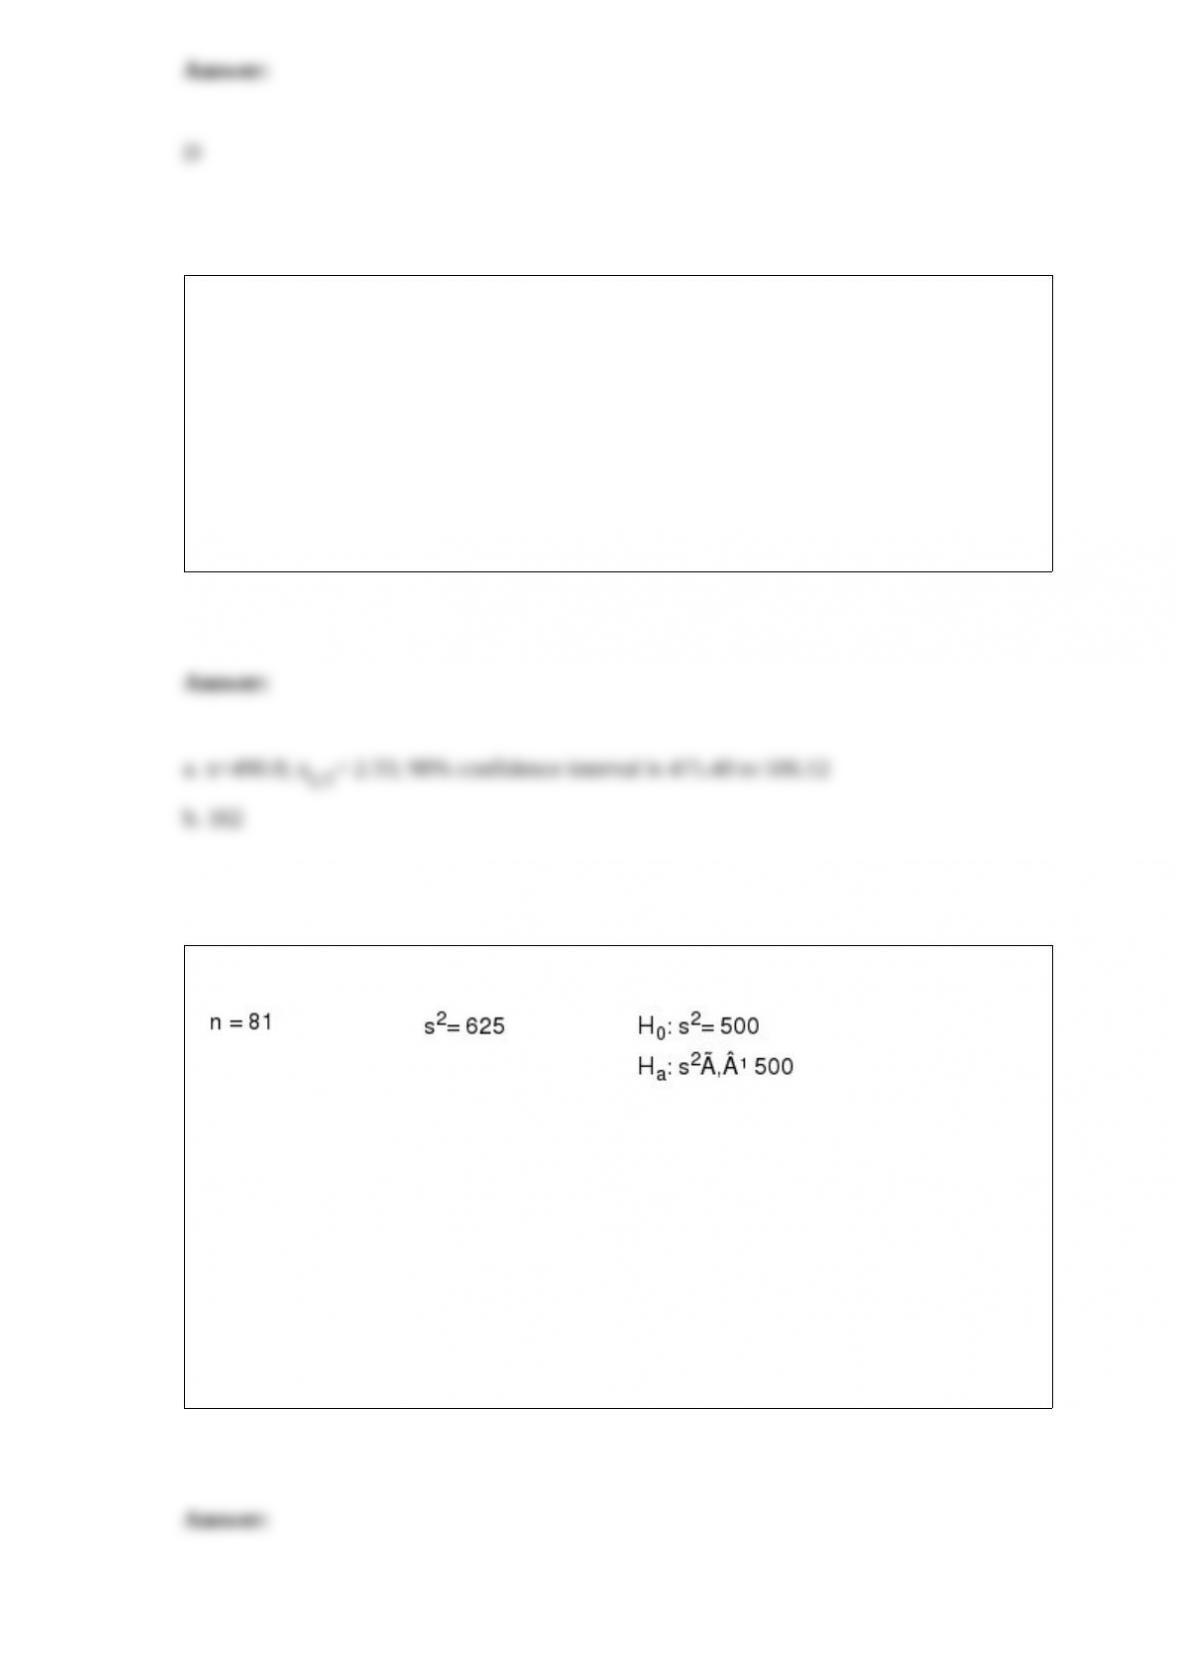
A sample of 15 items provides a sample mean of 18 and a sample variance of 16.
Compute a 95% confidence interval estimate for the standard deviation of the
population.