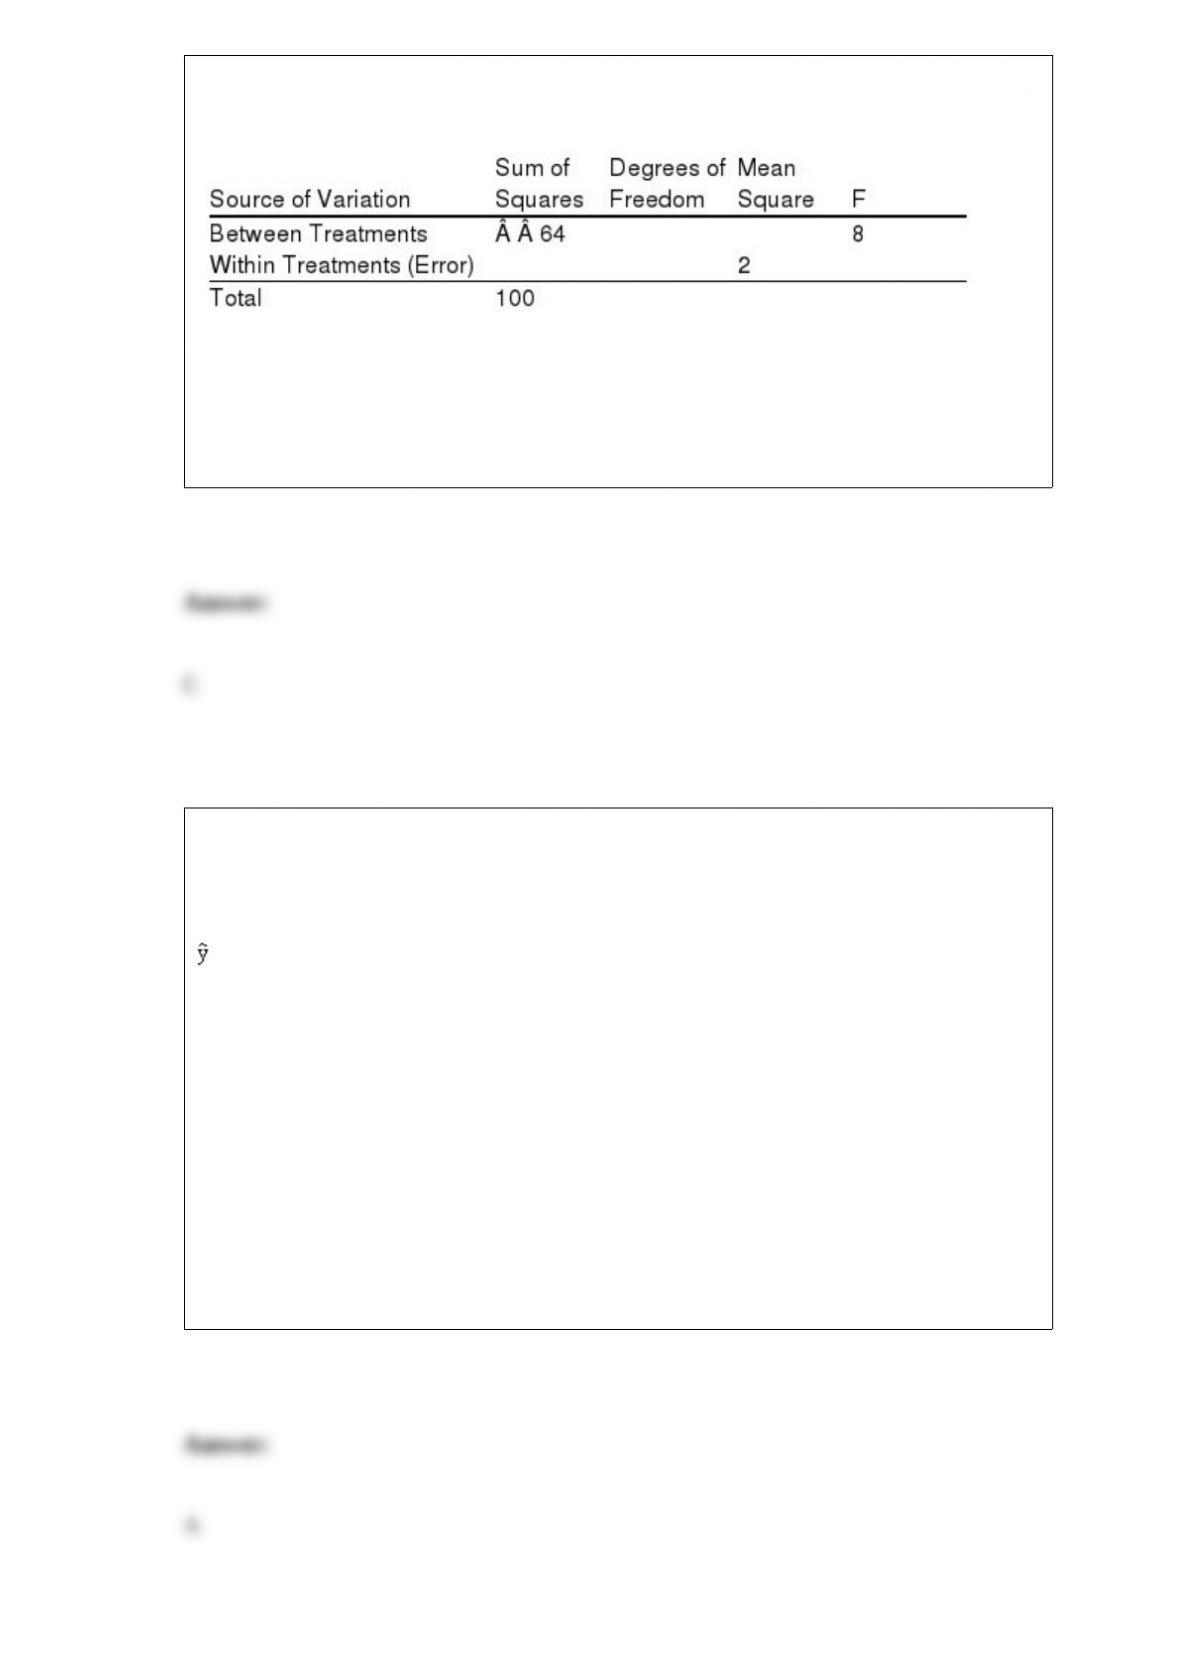
Exhibit 13-6
Part of an ANOVA table is shown below.
Refer to Exhibit 13-6. The conclusion of the test is that the means
a. are equal
b. may be equal
c. are not equal
d. None of these alternatives is correct.
Exhibit 16-1
In a regression analysis involving 25 observations, the following estimated regression
equation was developed.
= 10 – 18x1 + 3x2 + 14x3
Also, the following standard errors and the sum of squares were obtained.
Sb1 = 3 Sb2 = 6 Sb3 = 7
SST = 4,800 SSE = 1,296
Refer to Exhibit 16-1. The model
a. is significant
b. is not significant
c. may or may not be significant
d. None of these alternatives is correct.

Exhibit 12-1
When individuals in a sample of 150 were asked whether or not they supported capital
punishment, the following information was obtained.
We are interested in determining whether or not the opinions of the individuals (as to
Yes, No, and No Opinion) are uniformly distributed.
Refer to Exhibit 12-1. The calculated value for the test statistic equals
a. 2
b. -2
c. 20
d. 4
If the mean of a normal distribution is negative,
a. the standard deviation must also be negative
b. the variance must also be negative
c. a mistake has been made in the computations, because the mean of a normal
distribution cannot be negative
d. None of the alternative answers is correct.

The assembly time for a product is uniformly distributed between 6 to 10 minutes. The
expected assembly time (in minutes) is
a. 16
b. 2
c. 8
d. 4
In an analysis of variance, one estimate of 2 is based upon the differences between the
treatment means and the
a. means of each sample
b. overall sample mean
c. sum of observations
d. populations have equal means
In an analysis of variance problem if SST = 120 and SSTR = 80, then SSE is
a. 200
b. 40
c. 80
d. 120

In a regression analysis, the variable that is being predicted
a. must have the same units as the variable doing the predicting
b. is the independent variable
c. is the dependent variable
d. usually is denoted by x
An operating characteristic curve is based on a ________ probability distribution.
a. normal
b. exponential
c. binomial
d. uniform
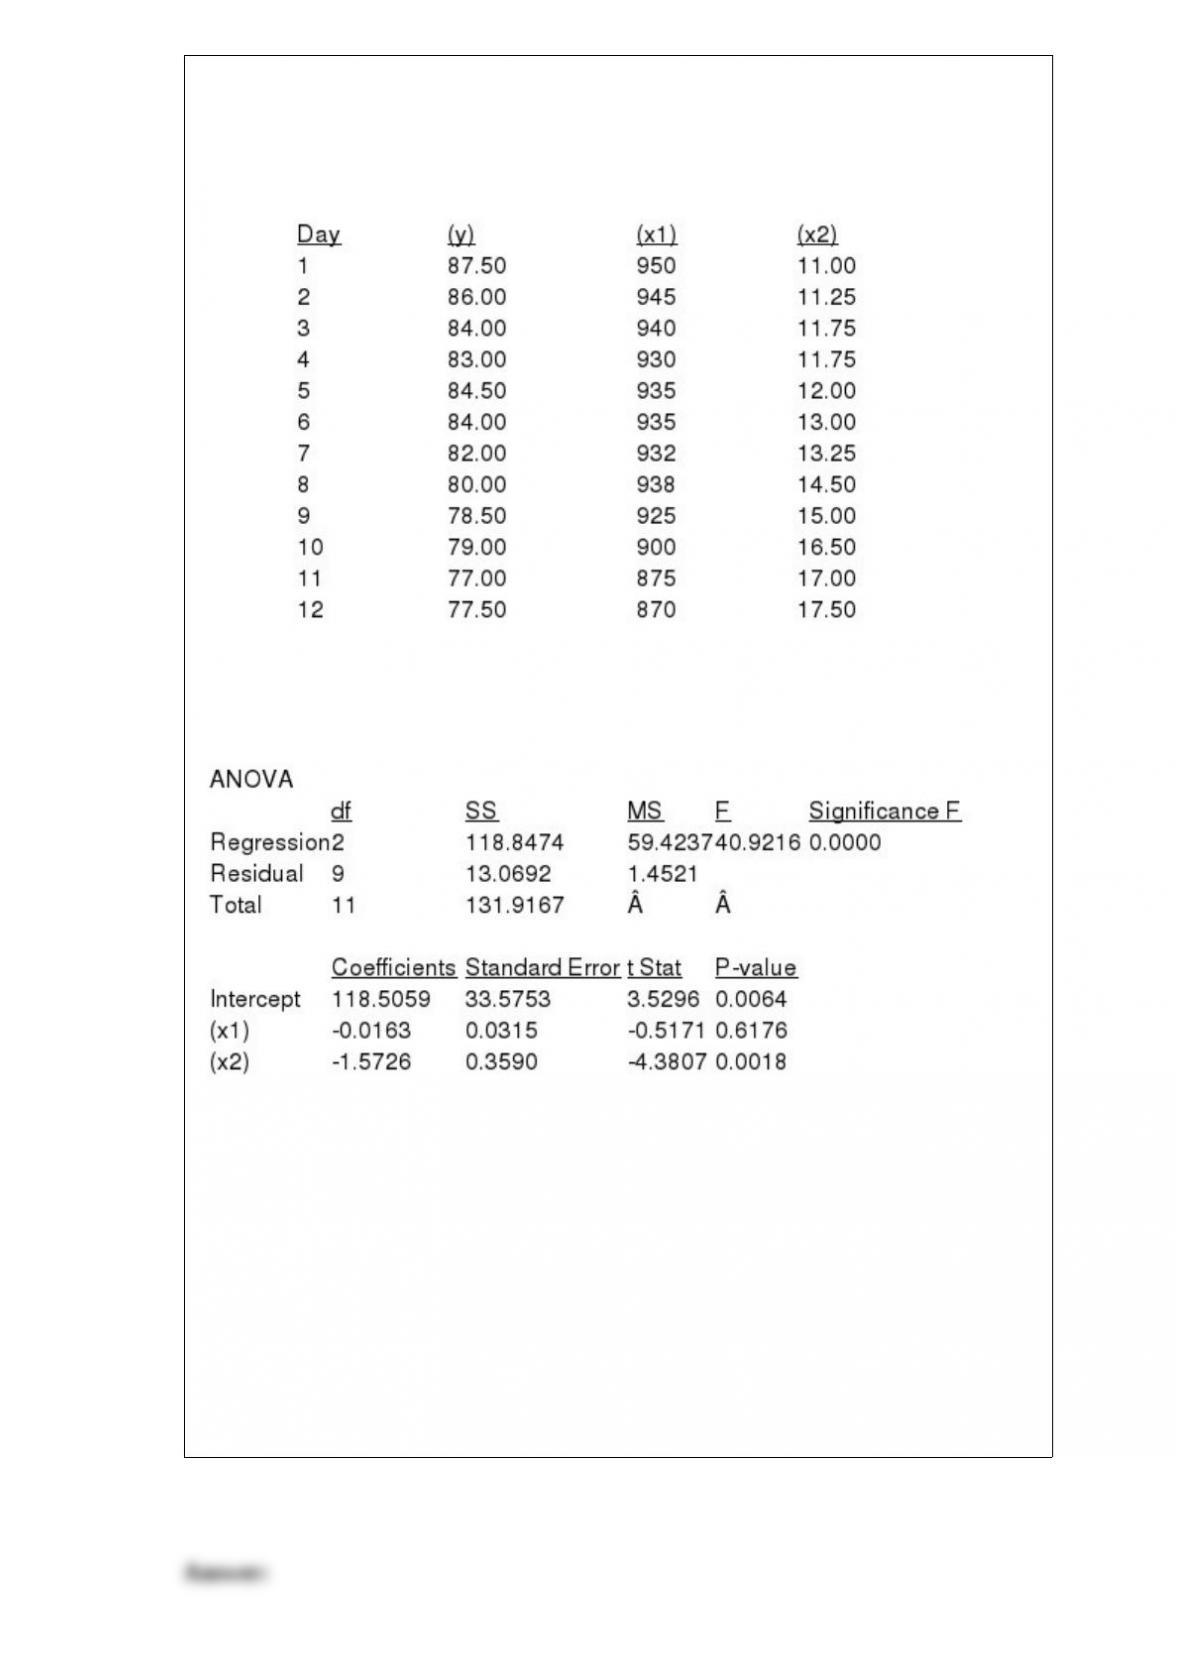
The prices of Rawlston, Inc. stock (y) over a period of 12 days, the number of shares (in
100s) of company’s stocks sold (x1), and the volume of exchange (in millions) on the
New York Stock Exchange (x2) are shown below.
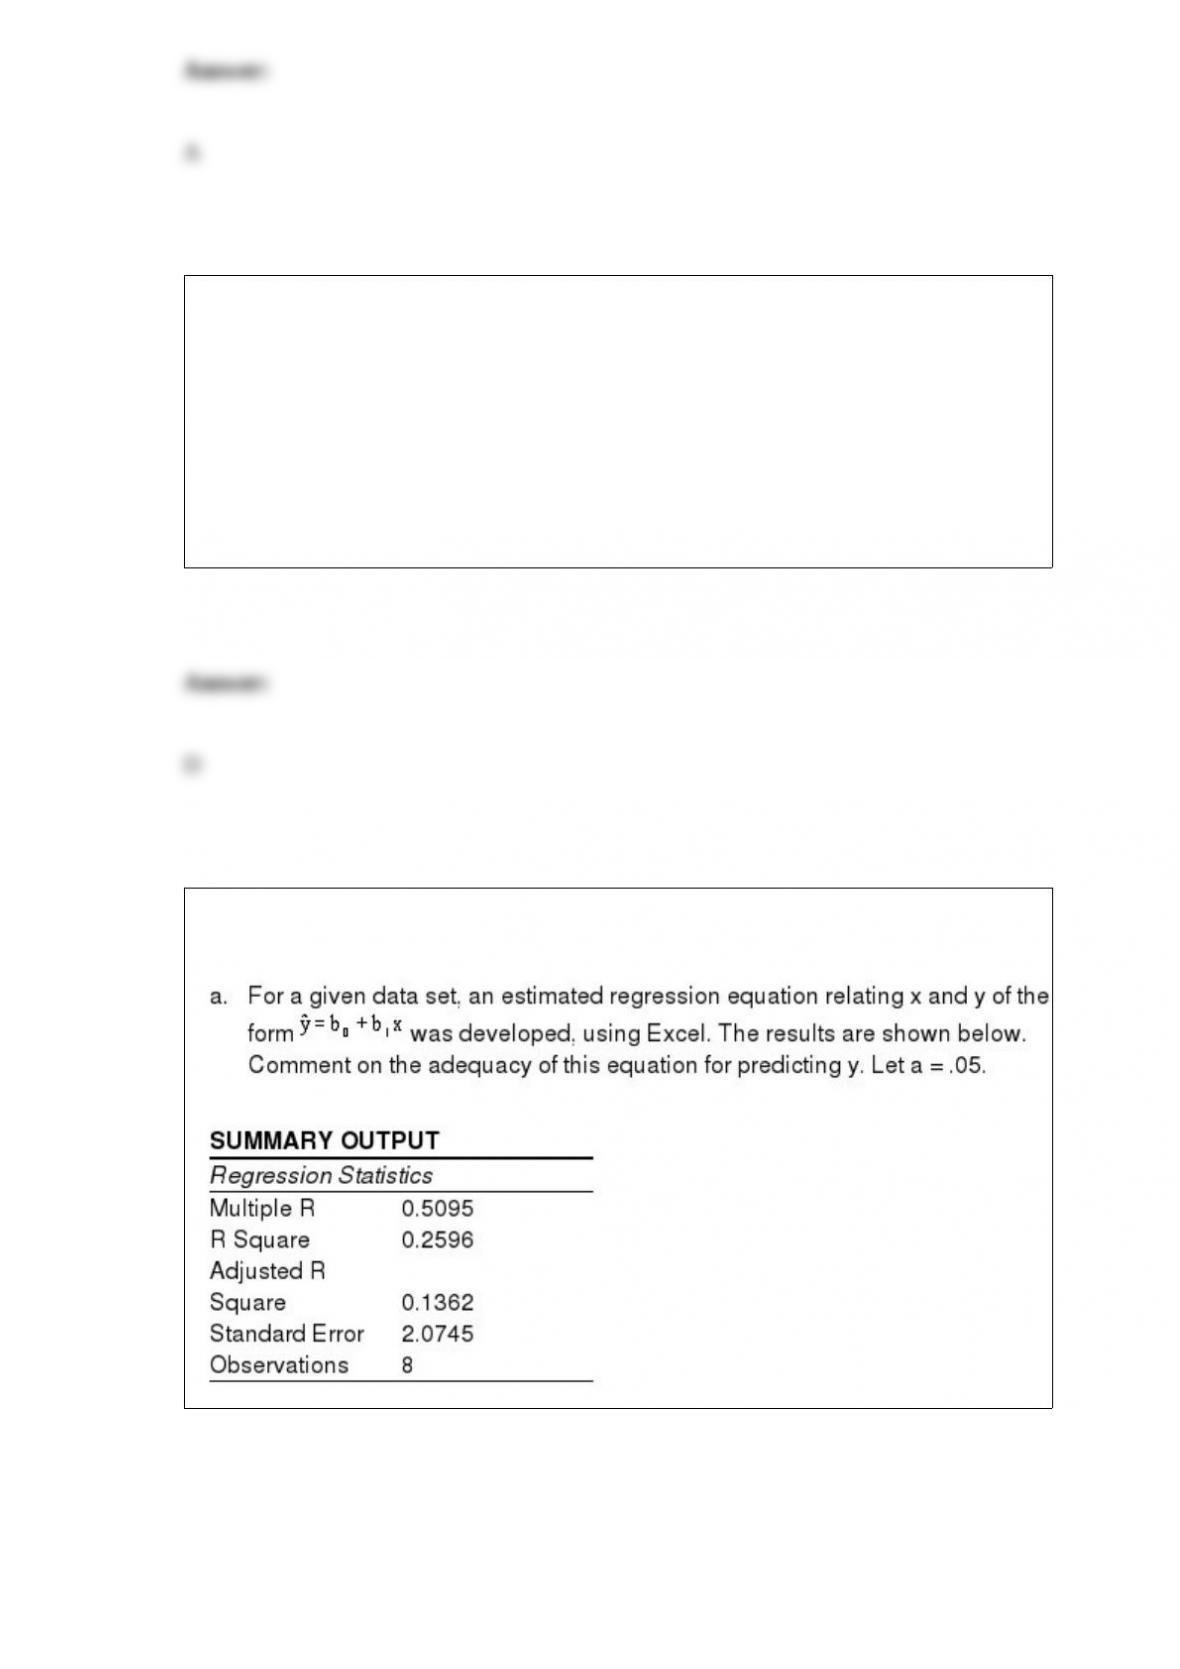
Excel was used to determine the least-squares regression equation. Part of the computer
output is shown below.
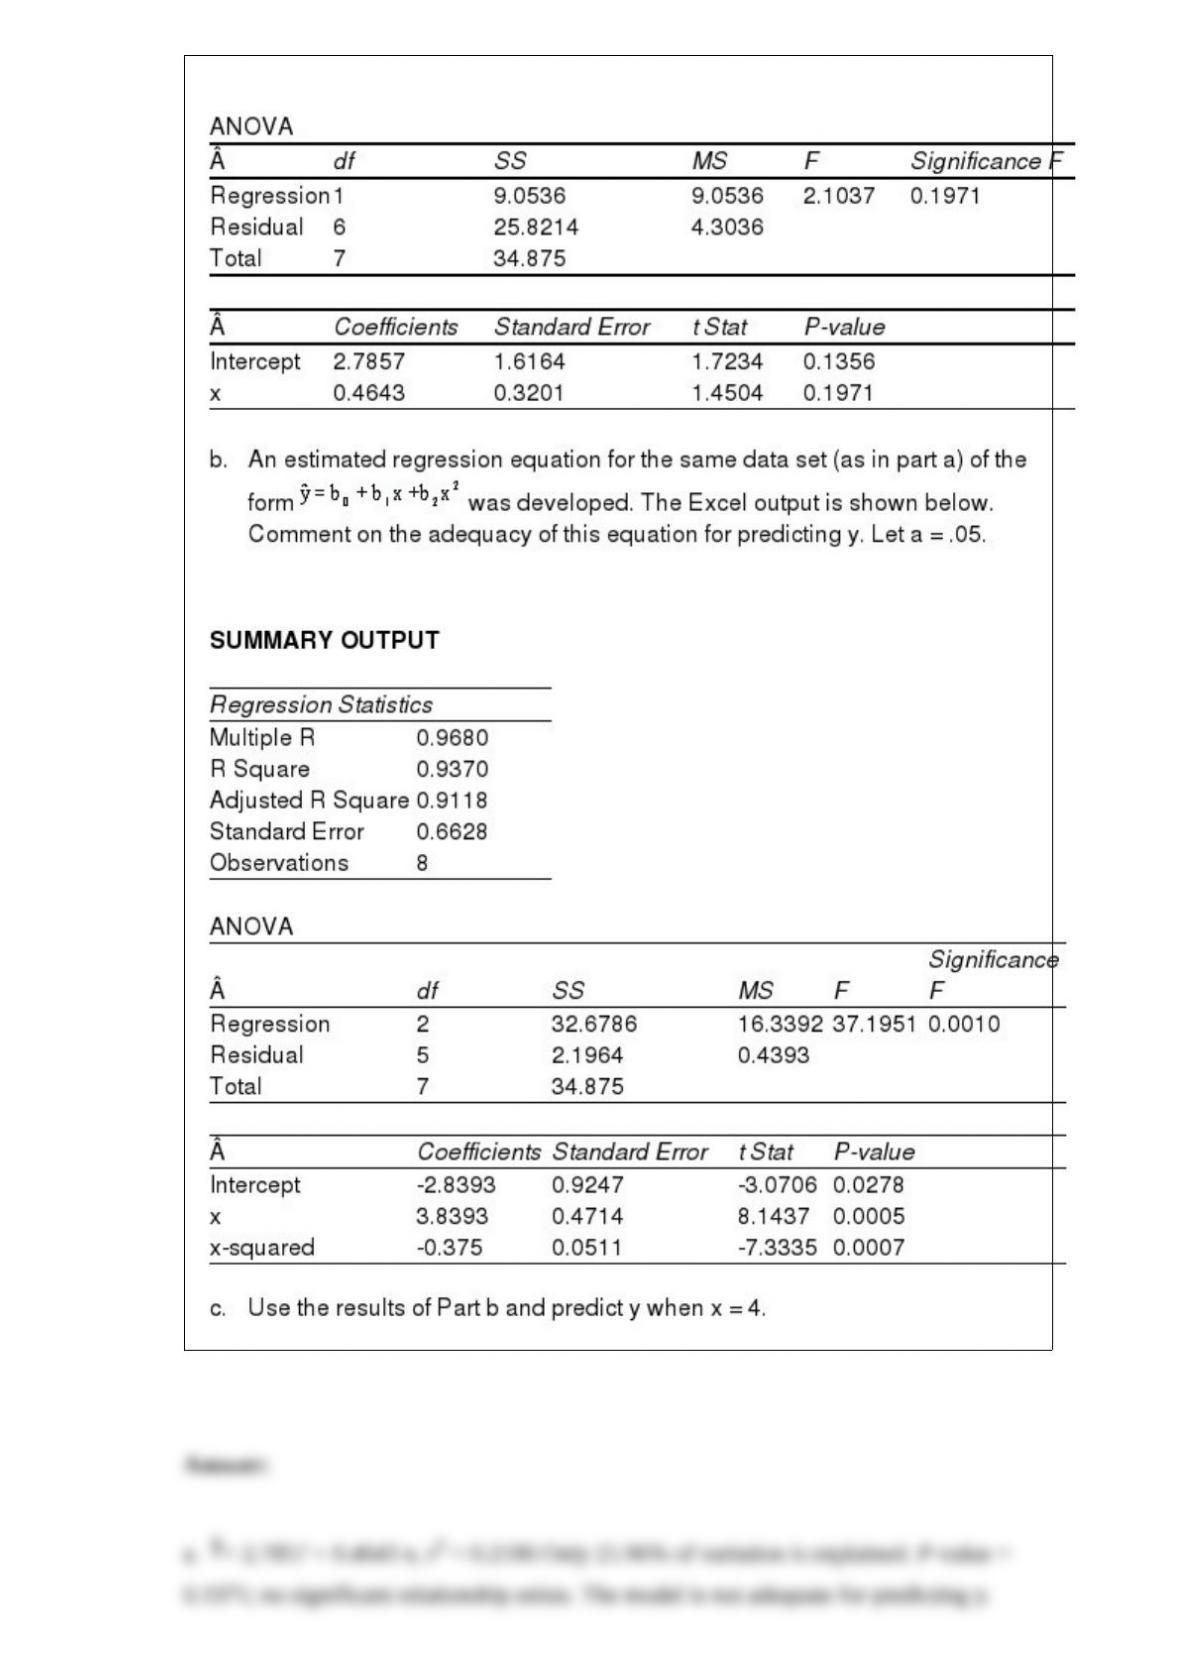
a. Use the output shown above and write an equation that can be used to predict the
price of the stock.
b. Interpret the coefficients of the estimated regression equation that you found in Part
a.
c. At 95% confidence, determine which variables are significant and which are not.
d. If in a given day, the number of shares of the company that were sold was 94,500 and
the volume of exchange on the New York Stock Exchange was 16 million, what would
you expect the price of the stock to be?
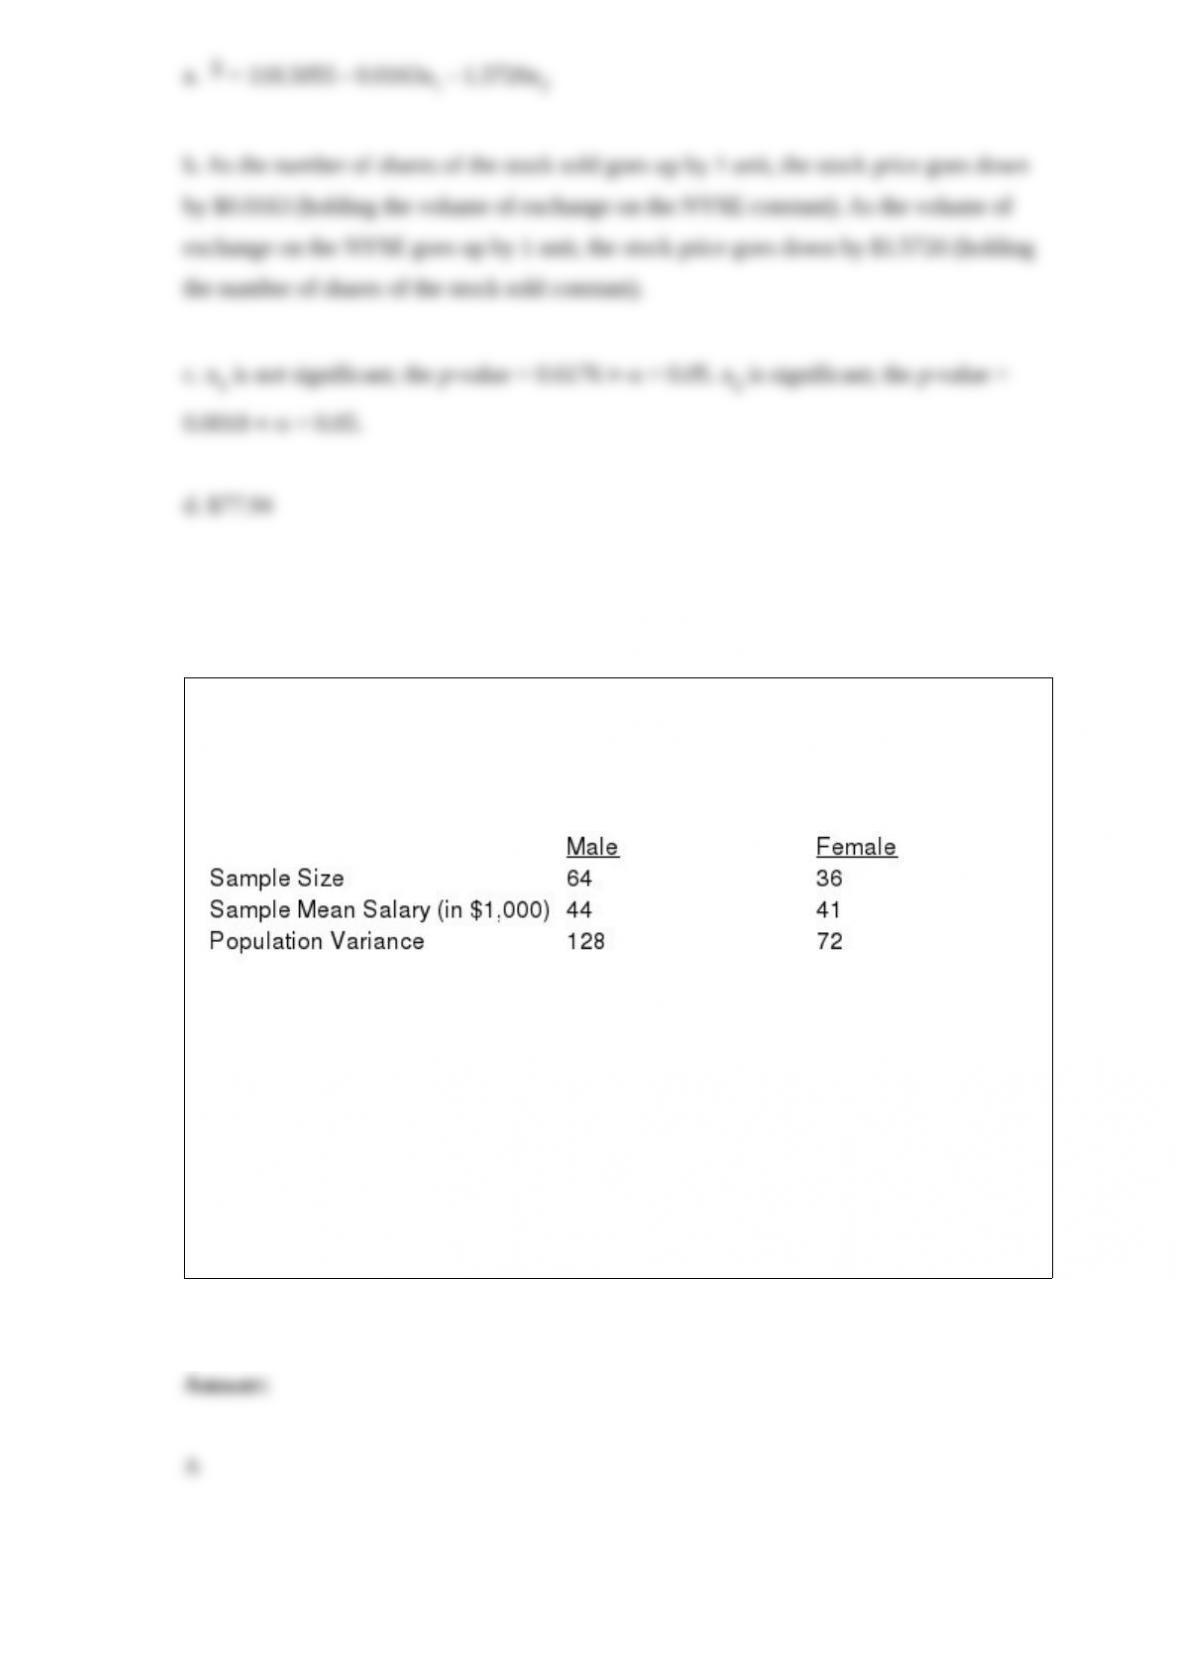
Exhibit 10-1
Salary information regarding male and female employees of a large company is shown
below.
Refer to Exhibit 10-1. The p-value is
a. 0.0668
b. 0.0334
c. 1.336
d. 1.96
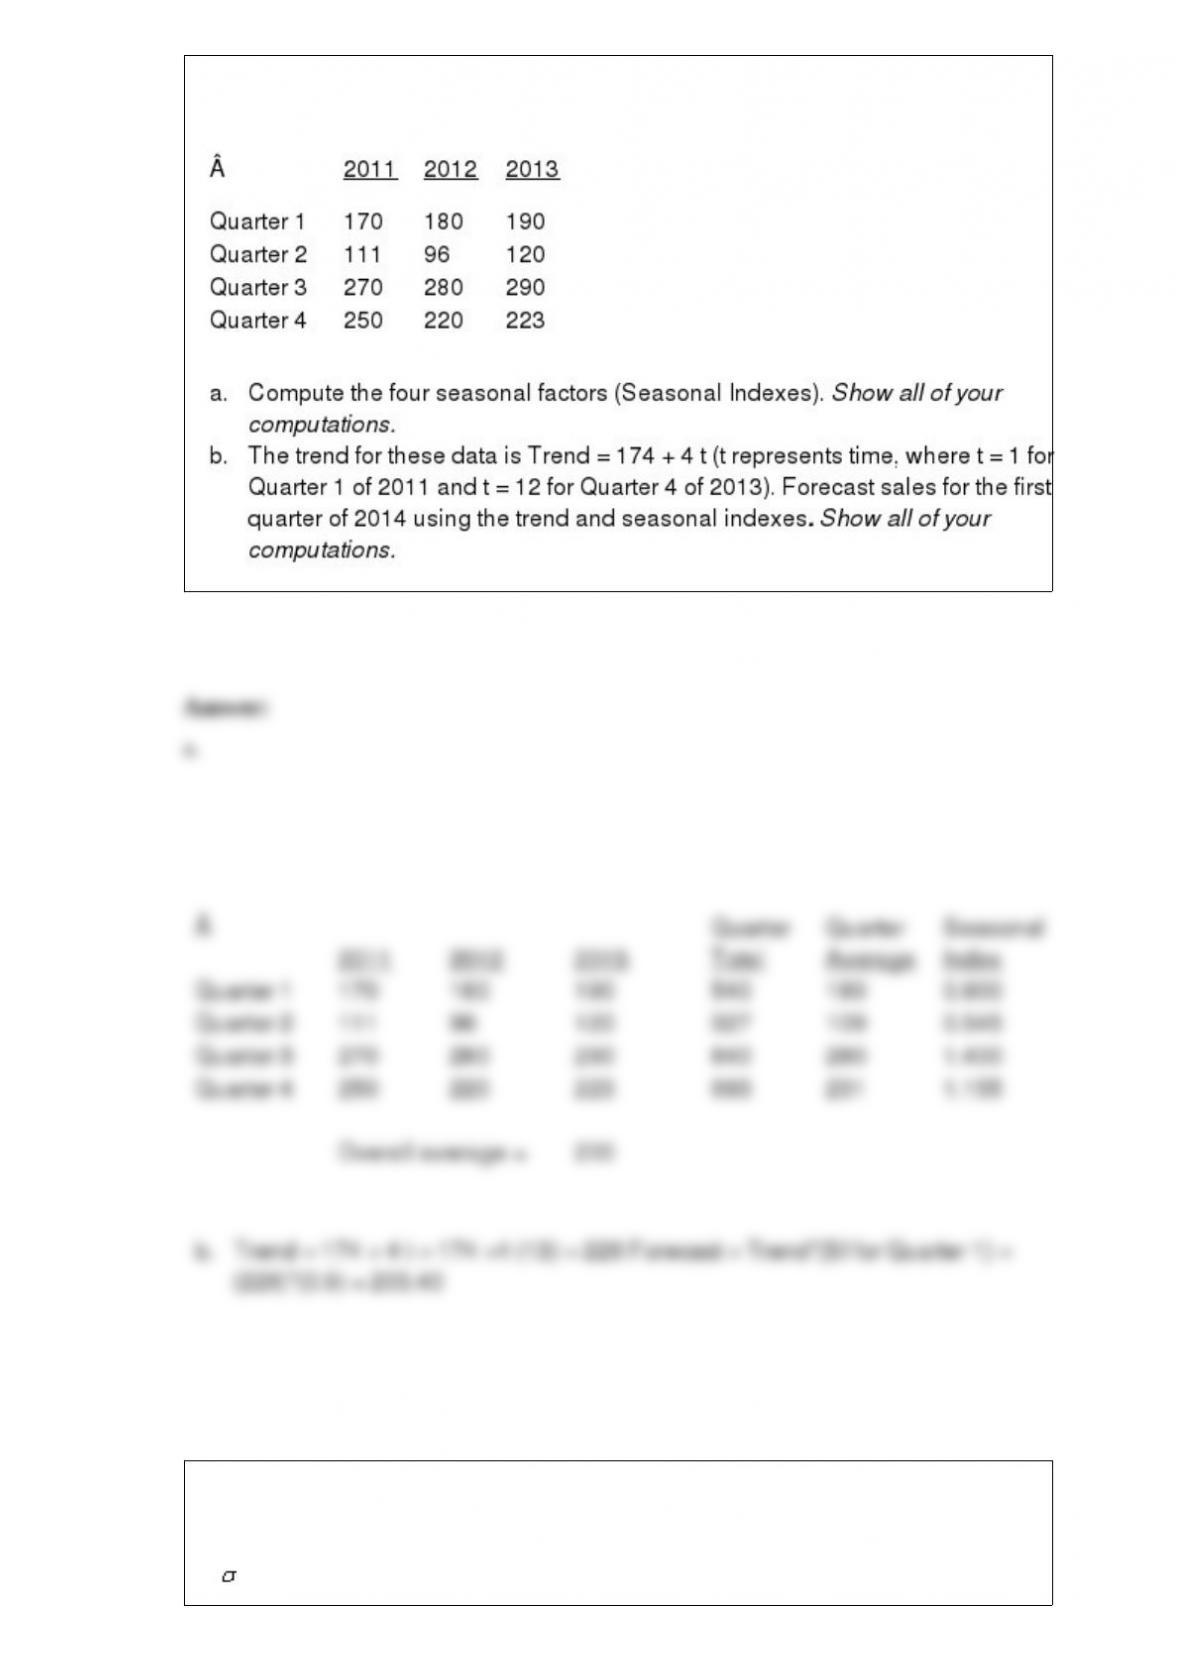
The quarterly sales (in thousands of copies) for an educational software package over
the past three years are given in the following table.
We are interested in testing to see if the variance of a population is less than 7. The
correct null hypothesis is
a. < 7

b. 2 49
c. s < 49
d. s > 49
Which of the following has an F distribution?
a. (n – 1)s/
b. s1/s2
c. (n – 1)s1/s2
d.
In acceptance sampling, the risk of accepting a poor quality lot is known as
a. consumer’s risk
b. producer’s risk
c. a Type I error
d. None of the other answers is correct.
A control chart that is used to monitor the number of defectives in a sample is
a. a p chart
b. an x-bar chart
c. an R chart
d. an np chart
We are interested in determining what type of model best describes the relationship
between two variables x and y.

A sample of 28 elements is selected to estimate a 95% confidence interval for the
variance of the population. The chi-square values to be used for this interval estimation
are
a. -1.96 and 1.96
b. 14.573 and 43.195
c. 16.151 and 40.113
d. 15.308 and 44.461
When using Excel’s EXPON.DIST function, one should choose TRUE for the third
input if
a. a probability is desired
b. a cumulative probability is desired
c. the expected value is desired
d. the correct answer is desired
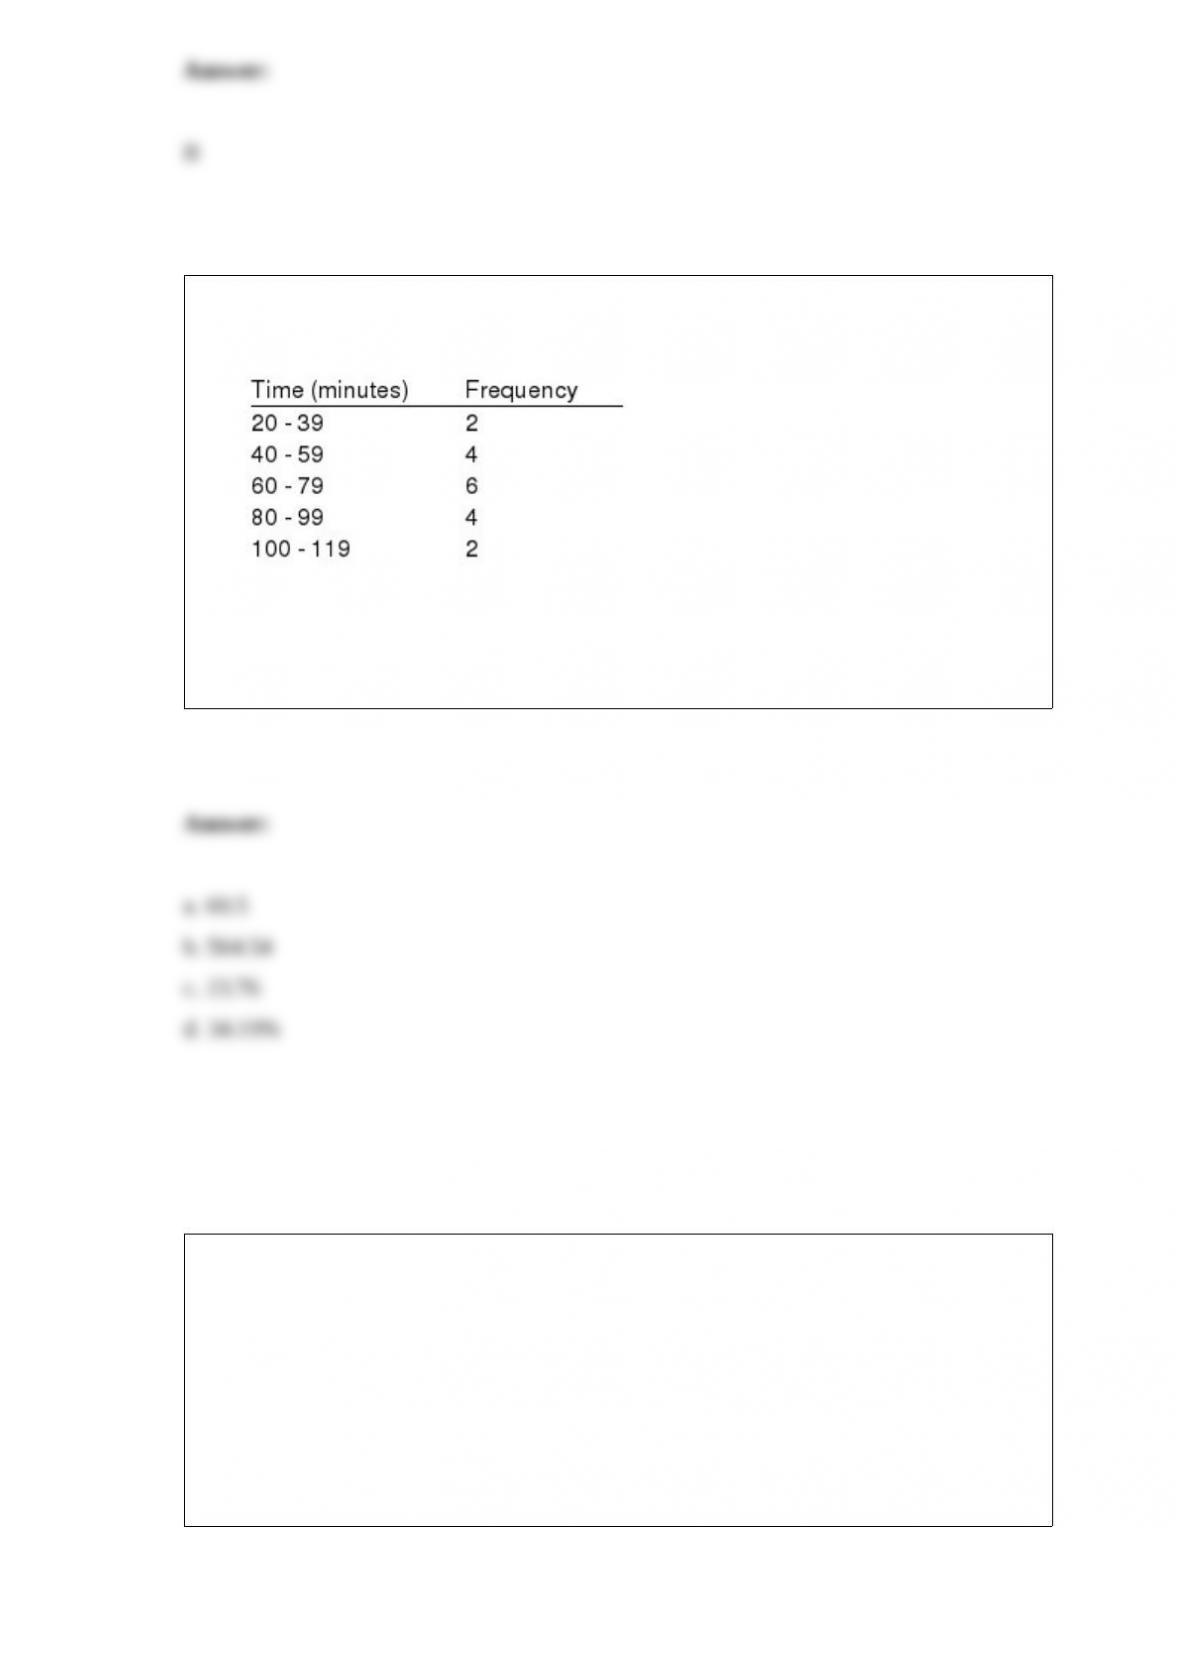
The following frequency distribution shows the time (in minutes) that a sample of
students uses the computer terminals per day.
a. Compute the mean.
b. Compute the variance.
c. Compute the standard deviation.
d. Compute the coefficient of variation.
In hypothesis testing, the alternative hypothesis is
a. the hypothesis tentatively assumed true in the hypothesis-testing procedure
b. the hypothesis concluded to be true if the null hypothesis is rejected
c. the maximum probability of a Type I error
d. All of the answers are correct.

The entities on which data are collected are
a. elements
b. populations
c. sets
d. samples
The critical F value with 8 numerator and 29 denominator degrees of freedom at =
0.01 is
a. 2.28
b. 3.20
c. 3.33
d. 3.64
Exhibit 14-2
You are given the following information about y and x.

Refer to Exhibit 14-2. The least squares estimate of b1 equals
a. -0.7647
b. -0.13
c. 21.4
d. 16.412
The term data warehousing is used to refer to the process of doing all of the following
except
a. capturing the data
b. storing the data
c. maintaining the data
d. mining the data