
41. Exhibit 12-6
The following shows the number of individuals in a sample of 300 who indicated they
support the new tax proposal.
We are interested in determining whether or not the opinions of the individuals of the
three groups are uniformly distributed.
Refer to Exhibit 12-6. The number of degrees of freedom associated with this problem
is
a. 2
b. 3
c. 300
d. 299
Excel’s __________ can be used to construct a scatter diagram.
a. Chart Tools
b. SUM function
c. CROSSTAB function
d. RAND function
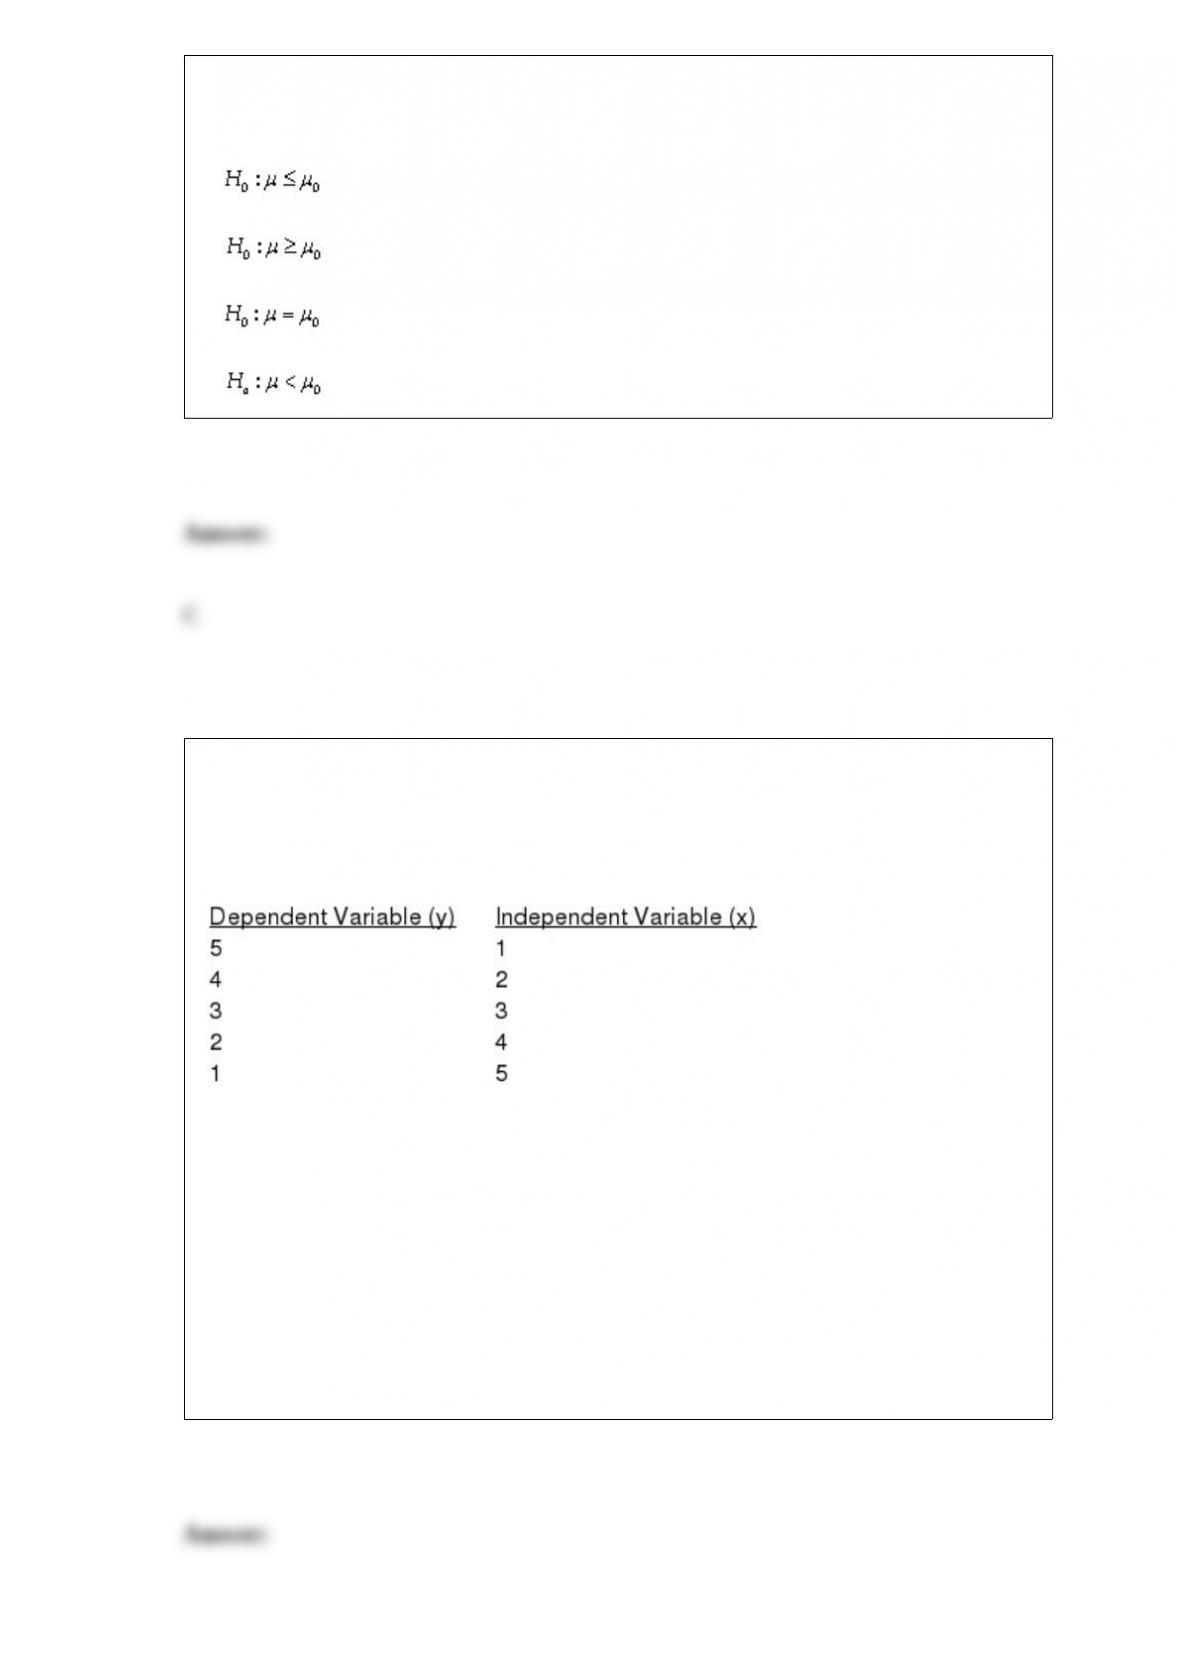
Which of the following hypotheses applies to a situation where action must be taken
both when H0 cannot be rejected and when H0 can be rejected?
a.
b.
c.
d.
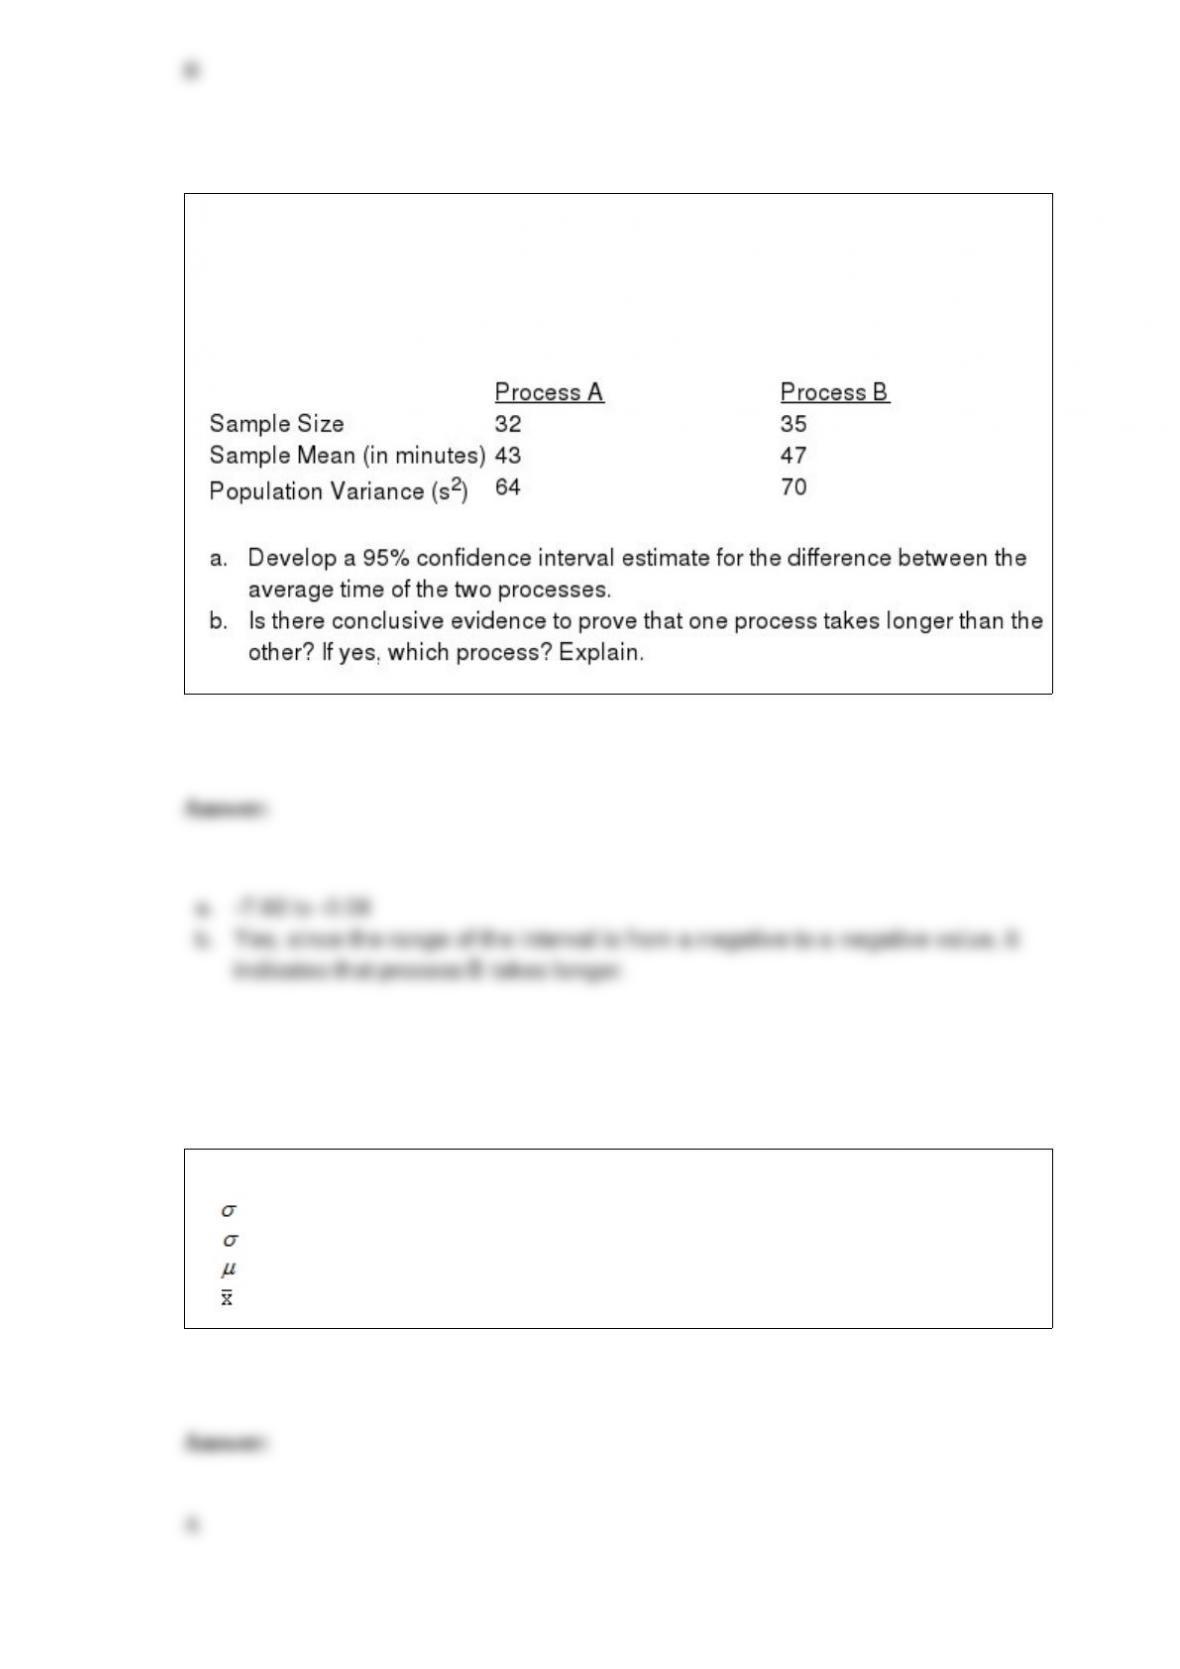
Exhibit 14-5
You are given the following information about y and x.
Refer to Exhibit 14-5. The least squares estimate of b1 (slope) equals
a. 1
b. -1
c. 6
d. 5
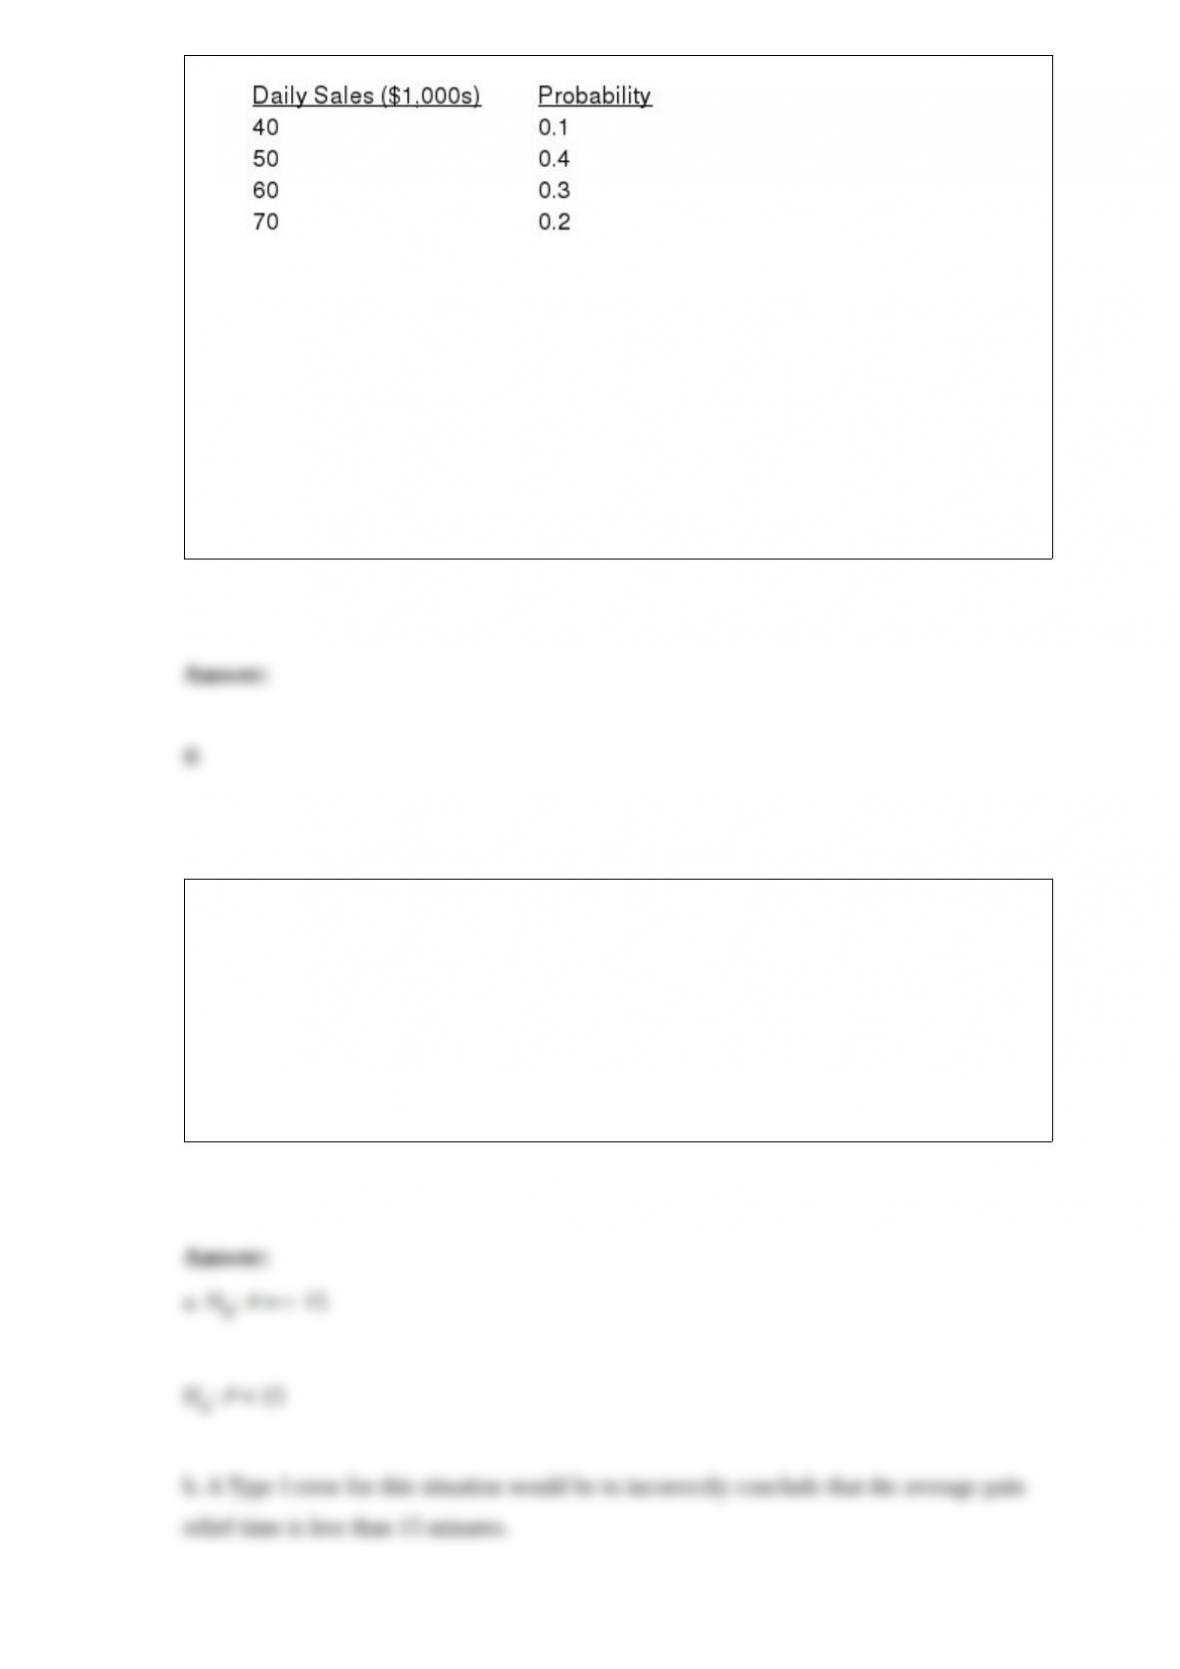
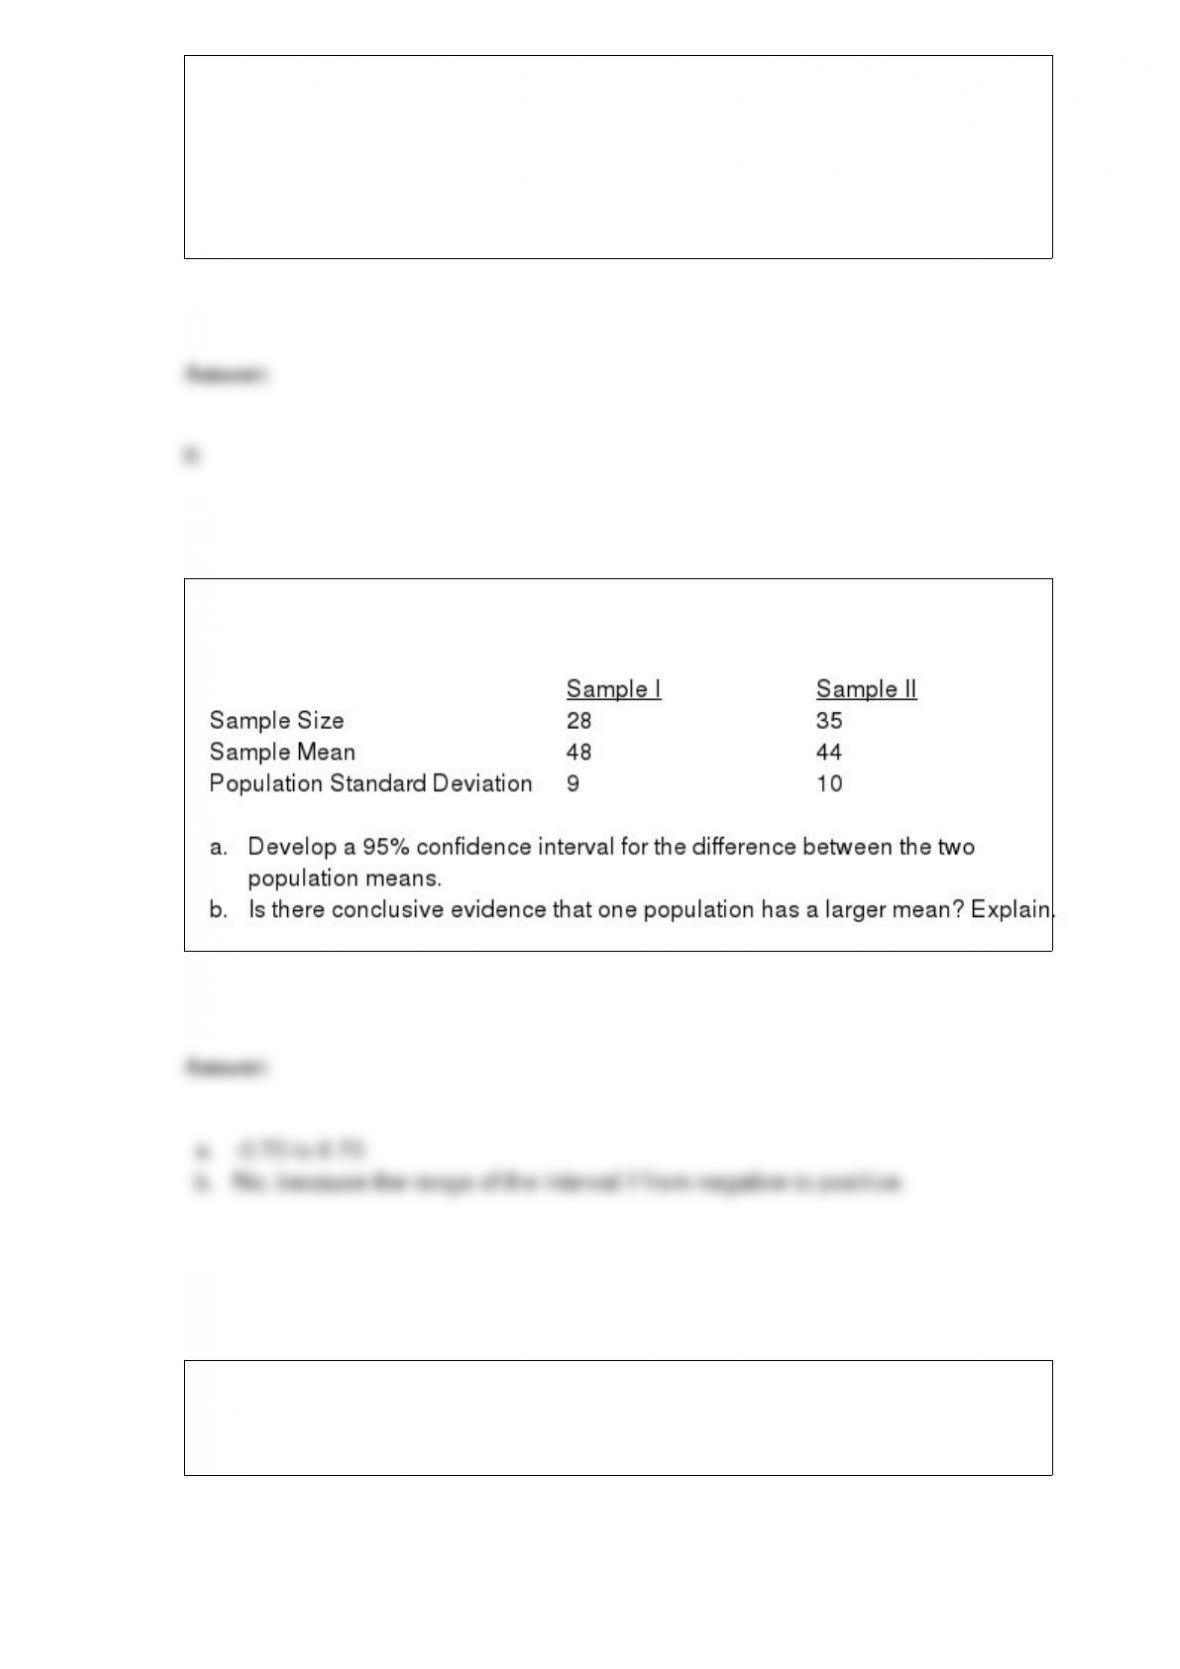
Maxforce, Inc., manufactures racquetball racquets by two different manufacturing
processes (A and B). Because the management of this company is interested in
estimating the difference between the average time it takes each process to produce a
racquet, they select independent samples from each process. The results of the samples
are shown below.
Which of the following symbols represents the variance of the population?
a. 2
b.
c.
d.

Exhibit 13-3
To test whether or not there is a difference between treatments A, B, and C, a sample of
12 observations has been randomly assigned to the 3 treatments. You are given the
results below.
Refer to Exhibit 13-3. The test statistic to test the null hypothesis equals
a. 0.944
b. 1.059
c. 3.13
d. 19.231
Exponential distributions
a. are skewed to the left
b. are skewed to the right
c. can be skewed to the left or right
d. are not skewed
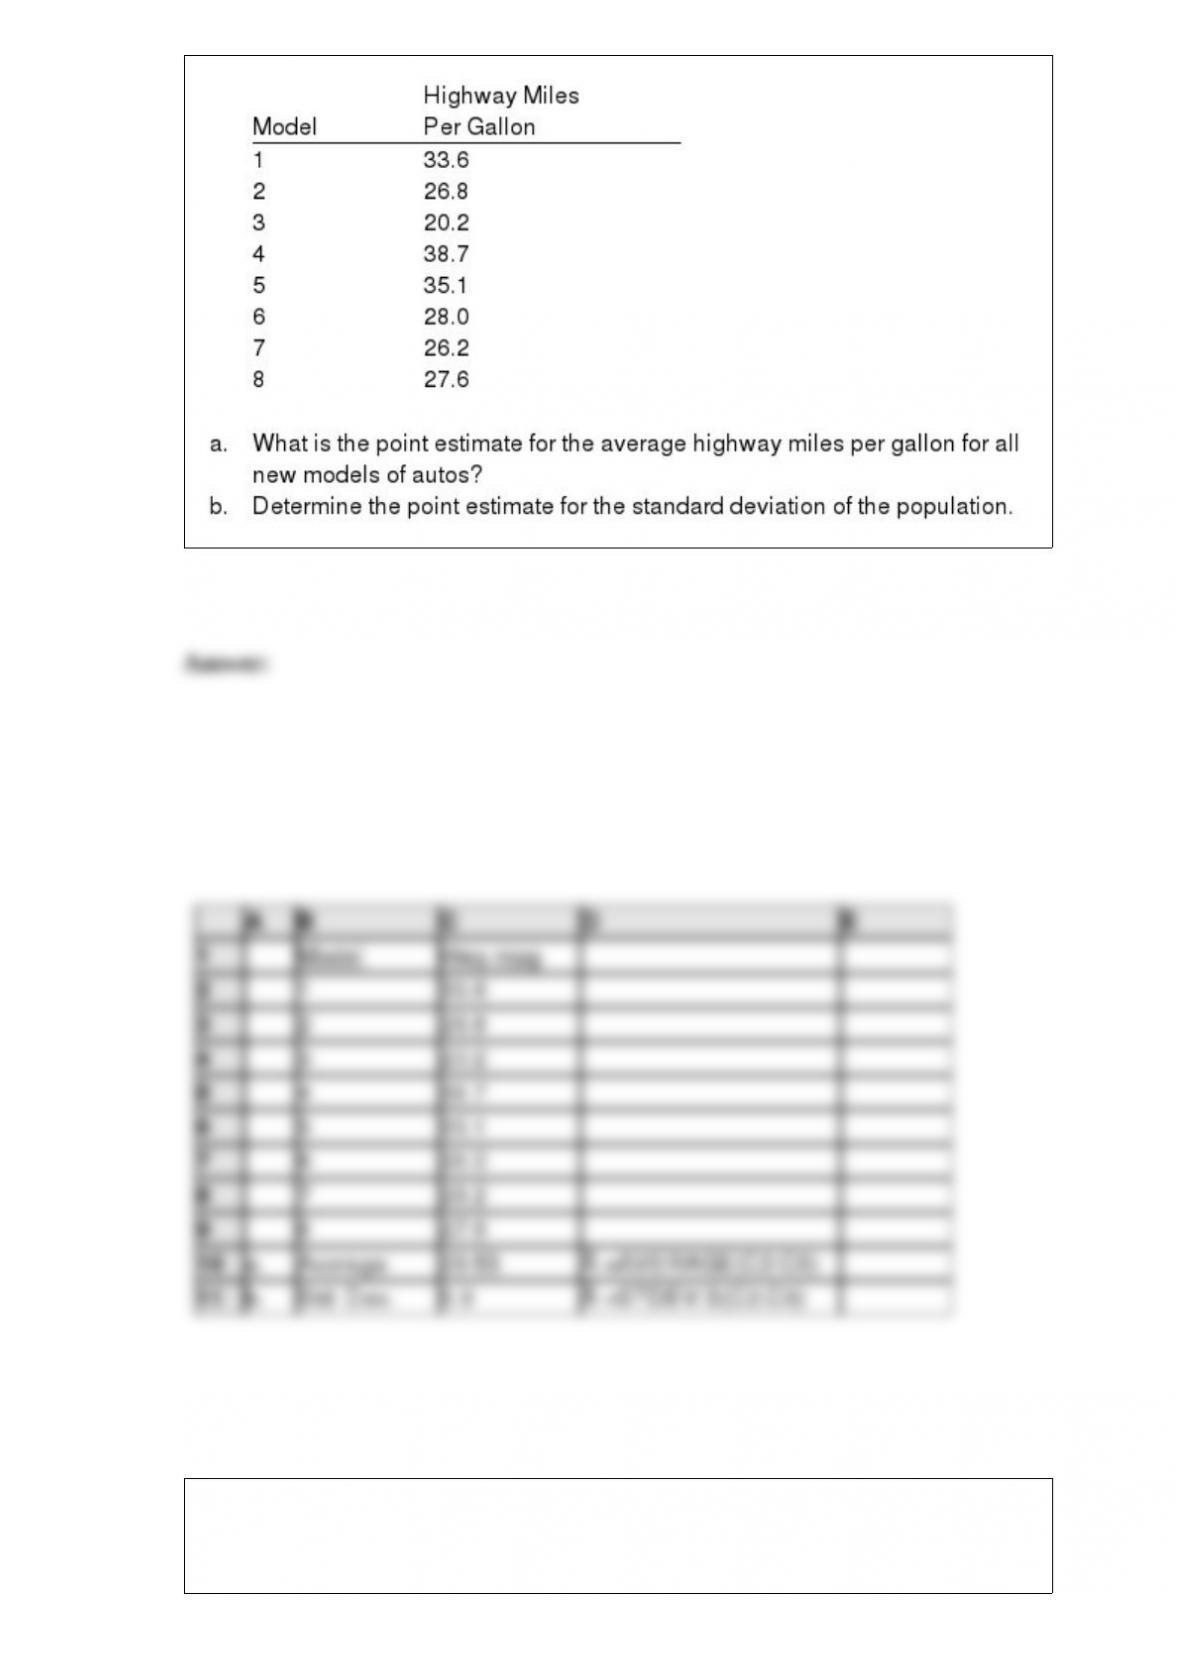
Exhibit 5-2
The probability distribution for the daily sales at Michael’s Co. is given below.
Refer to Exhibit 5-2. The expected daily sales are
a. $55,000
b. $56,000
c. $50,000
d. $70,000
A researcher is testing a new painkiller that claims to relieve pain in less than 15
minutes, on average.
a. State the hypotheses associated with the researcher’s test.
b. Describe a Type I error for this situation.
c. Describe a Type II error for this situation.

A pharmaceutical company is performing clinical trials on a new drug that is intended
to relieve symptoms for allergy sufferers. Twelve percent of the 300 clinical trial
participants experienced the side effect dry mouth.
a. What is the population being studied?
b. What is the sample being studied?
c. Based on the sample, what percentage of the population do you think would suffer
from dry mouth?
The probability of an economic decline in the year 2013 is 0.23. There is a probability
of 0.64 that we will elect a republican president in the year 2012. If we elect a
republican president, there is a 0.35 probability of an economic decline. Let “D”
represent the event of an economic decline, and “R” represent the event of election of a
Republican president.
a. Are “R” and “D” independent events?
b. What is the probability of electing a Republican president in 2012 and an economic
decline in the year 2013?
c. If we experience an economic decline in the year 2013, what is the probability that a
Republican president will have been elected in the year 2012?
d. What is the probability of economic decline in 2013 or a Republican president
elected in the year 2012 or both?

A test to determine whether or not first-order autocorrelation is present is
a. a t test
b. the Durbin-Watson test
c. an F test
d. a chi-square test
The sum of the percent frequencies for all classes will always equal
a. one
b. the number of classes
c. the number of items in the study
d. 100
A sample of 8 new models of automobiles provides the following data on highway
miles per gallon. Use Excel to answer the questions that follow the data.
Nodes indicating points where an uncertain event will occur are known as
a. decision nodes
b. chance nodes
c. marginal nodes
d. conditional nodes
Consider the following results for two samples randomly taken from two normal
populations with equal variances.
Exhibit 14-5
You are given the following information about y and x.
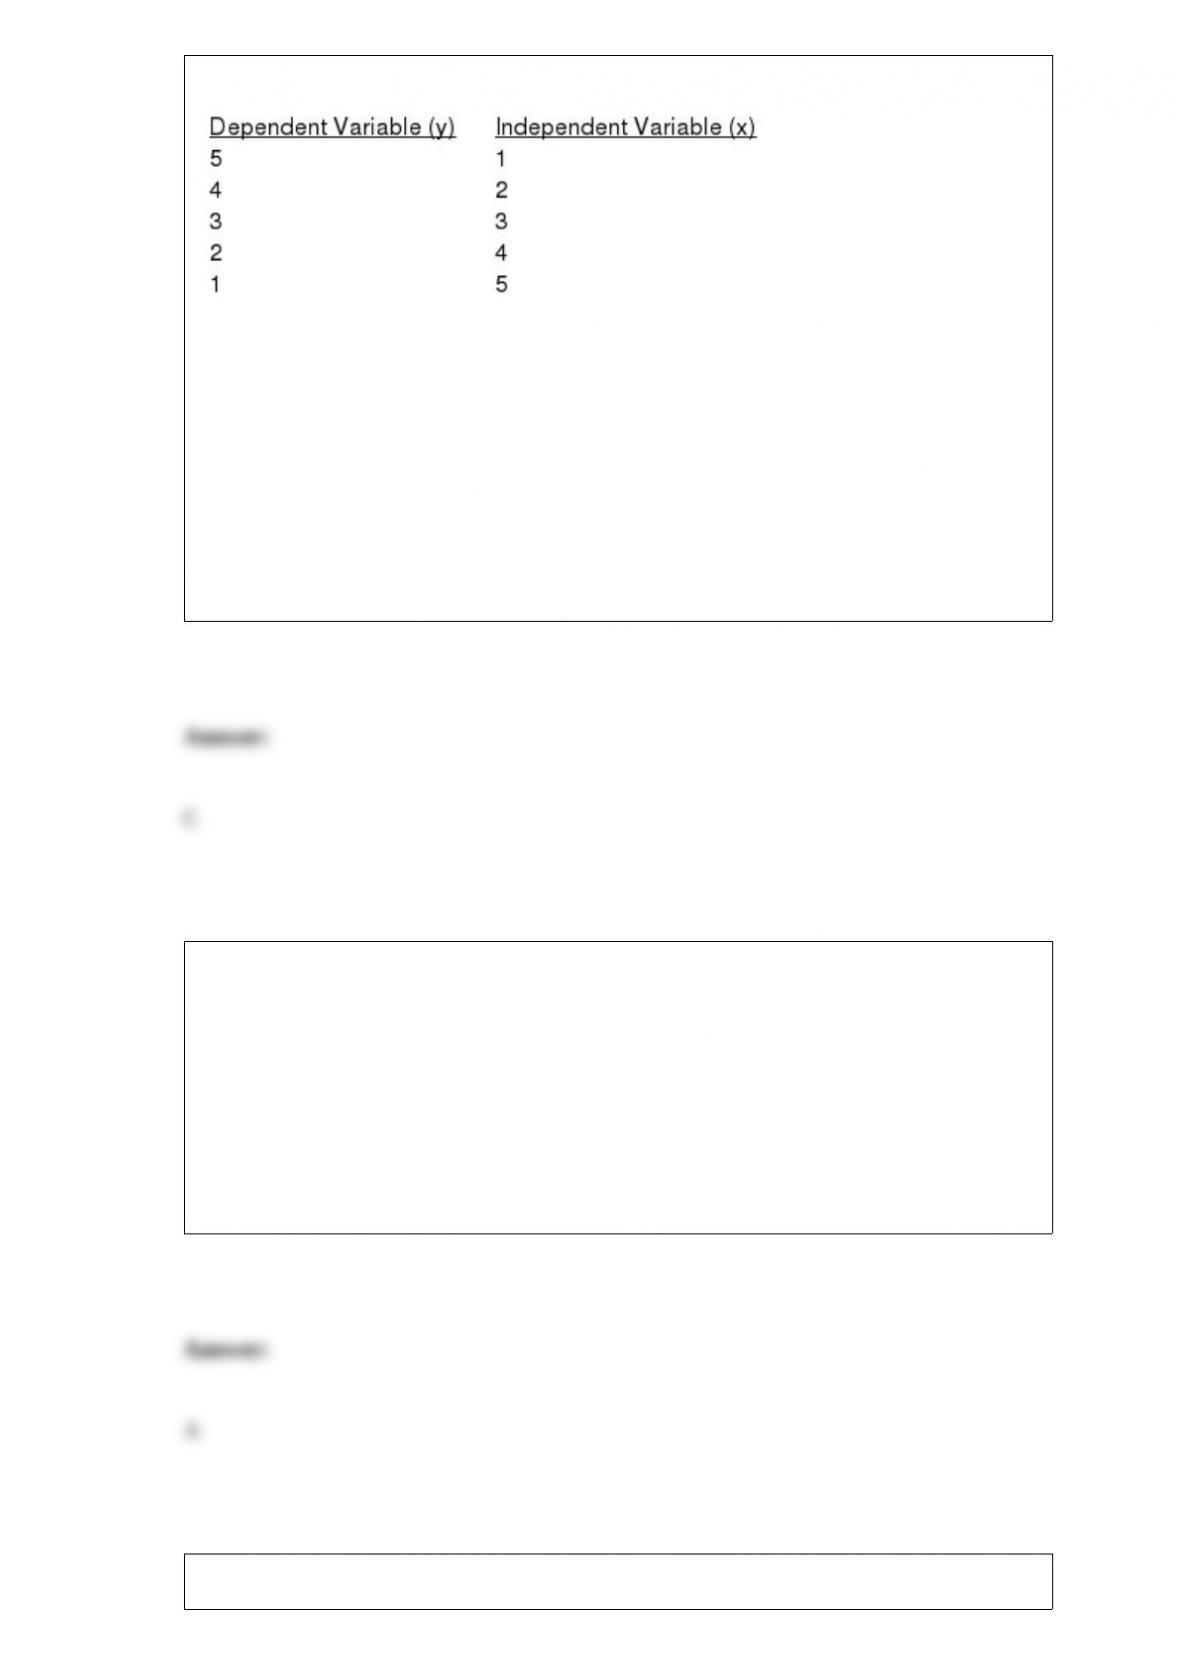
Refer to Exhibit 14-5. The coefficient of determination equals
a. 0
b. -1
c. +1
d. -0.5
A numerical measure from a sample, such as a sample mean, is known as
a. a statistic
b. a parameter
c. the mean deviation
d. the central limit theorem
Z is a standard normal variable. Find the value of z in the following.

a. The area between 0 and z is 0.4678.
b. The area to the right of z is 0.1112.
c. The area to the left of z is 0.8554
d. The area between –z and z is 0.754.
e. The area to the left of –z is 0.0681.
f. The area to the right of –z is 0.9803.
The number of customers that enter a store during one day is an example of
a. a continuous random variable
b. a discrete random variable
c. either a continuous or a discrete random variable, depending on the number of the
customers
d. either a continuous or a discrete random variable, depending on the gender of the
customers

The records of a department store show that 20% of its customers who make a purchase
return the merchandise in order to exchange it. In the next six purchases,
a. what is the probability that three customers will return the merchandise for
exchange?
b. what is the probability that four customers will return the merchandise for exchange?
c. what is the probability that none of the customers will return the merchandise for
exchange?