A professor at a local university noted that the grades of her students were normally
distributed with a mean of 78 and a standard deviation of 10.
a. The professor has informed us that 16.6% of her students received grades of A. What
is the minimum score needed to receive a grade of A?
b. If 12.1% of her students failed the course and received Fs, what was the maximum
score among those who received an F?
c. If 33% of the students received grades of B or better (i.e., As and Bs), what is the
minimum score of those who received a B?
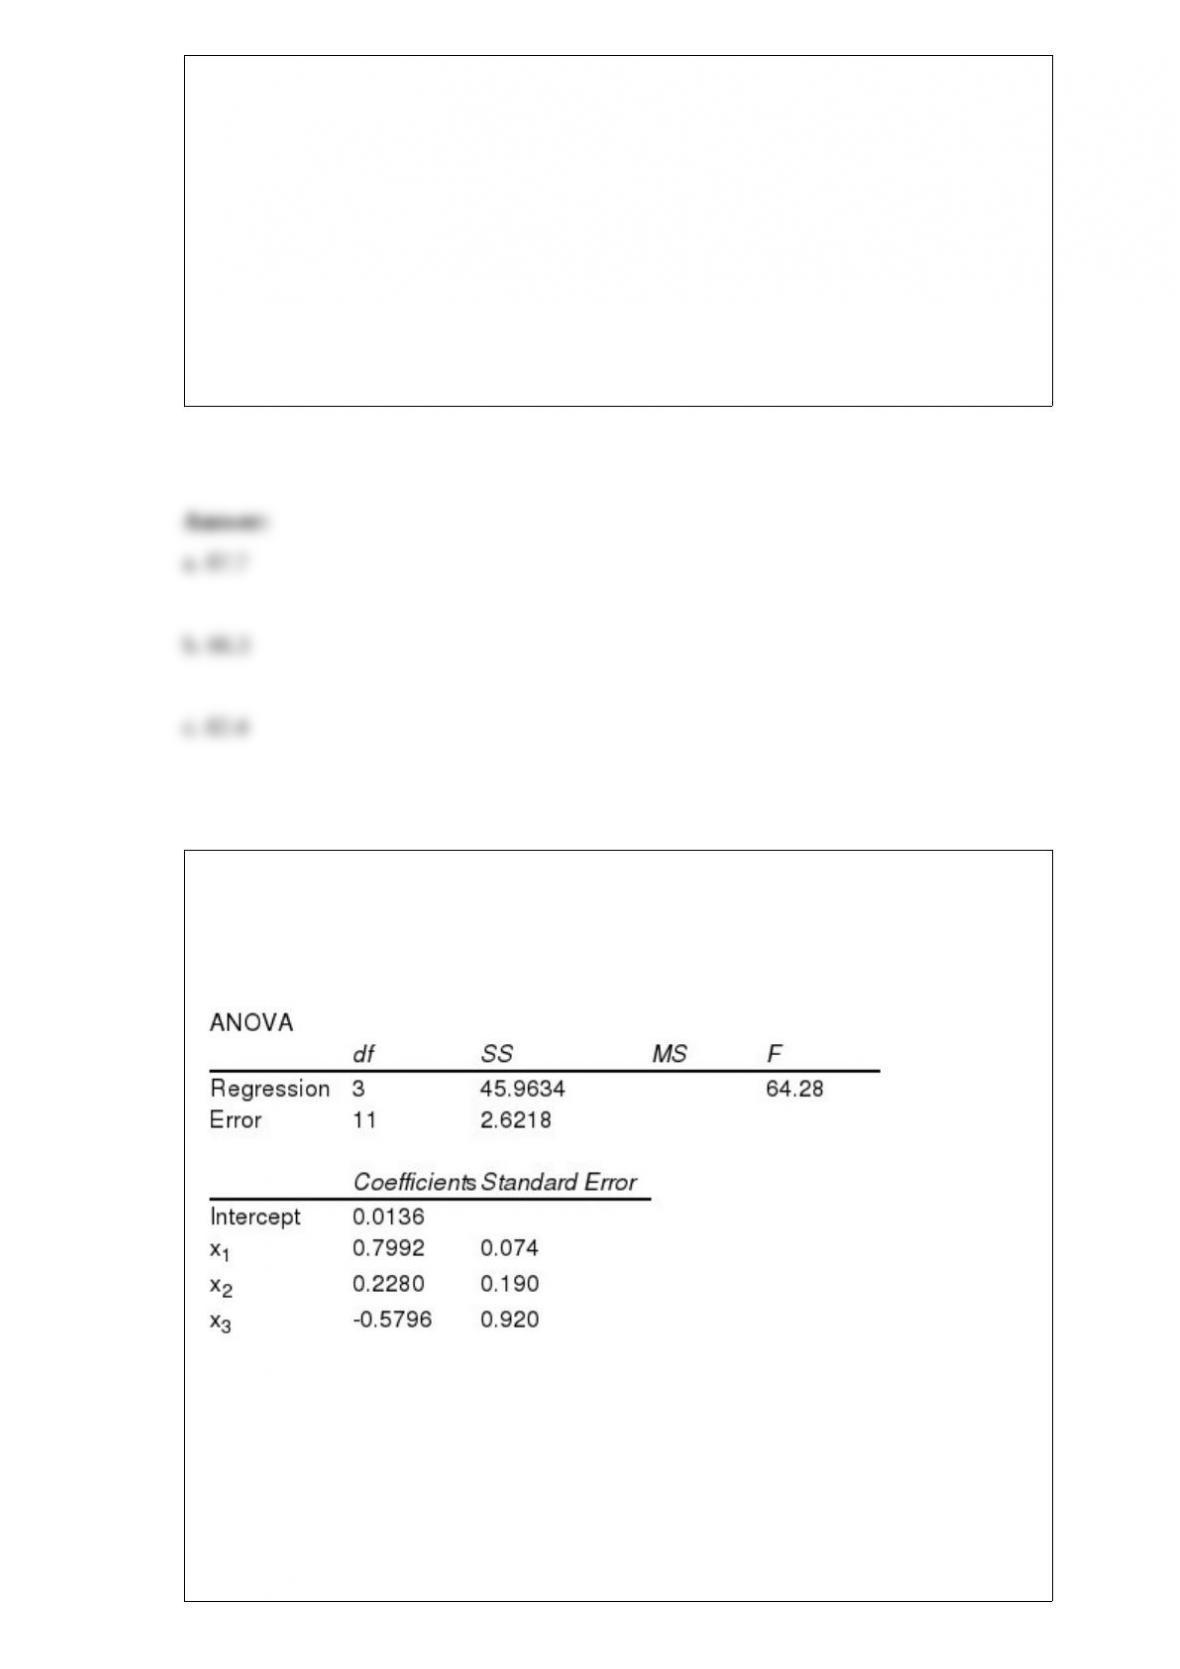
A student used multiple regression analysis to study how family spending (y) is
influenced by income (x1), family size (x2), and additions to savings (x3). The variables
y, x1, and x3 are measured in thousands of dollars. The following results were obtained.
Coefficient of determination = 0.946
a. Write out the estimated regression equation for the relationship between the
variables.
b. What can you say about the strength of this relationship?

c. Carry out a test of whether y is significantly related to the independent variables. Use
a .05 level of significance.
d. Carry out a test to see if x3 and y are significantly related. Use a .05 level of
significance.
e. Why would a coefficient of determination very close to 1.0 be expected here?
Before dawn Josh hurriedly packed some clothes for a job-interview trip while his
roommate was still sleeping. He reached in his disorganized sock drawer where there
were five black socks and five navy blue socks, although they appeared to be the same
color in the dimly lighted room. Josh grabbed six socks, hoping that at least two, and
preferably four, of them were black to match the gray suit he had packed. With no time
to spare, he then raced to the airport to catch his plane.
a. What is the probability that Josh packed at least two black socks so that he will be
dressed appropriately the day of his interview?
b. What is the probability that Josh packed at least four black socks so that he will be
dressed appropriately the latter day of his trip as well?

In a cumulative frequency distribution, the last class will always have a cumulative
frequency equal to
a. one
b. 100%
c. the total number of elements in the data set
d. None of the other answers are correct.
If the value of c in a single-stage sampling plan is increased, with n remaining constant,
the probability of accepting the lot
a. increases
b. decreases
c. is unchanged
d. might increase or decrease, depending on the lot percent defective
For a sample size of 30, changing from using the standard normal distribution to using
the t distribution in a hypothesis test,
a. will result in the rejection region being smaller
b. will result in the rejection region being larger
c. would have no effect on the rejection region
d. Not enough information is given to answer this question.
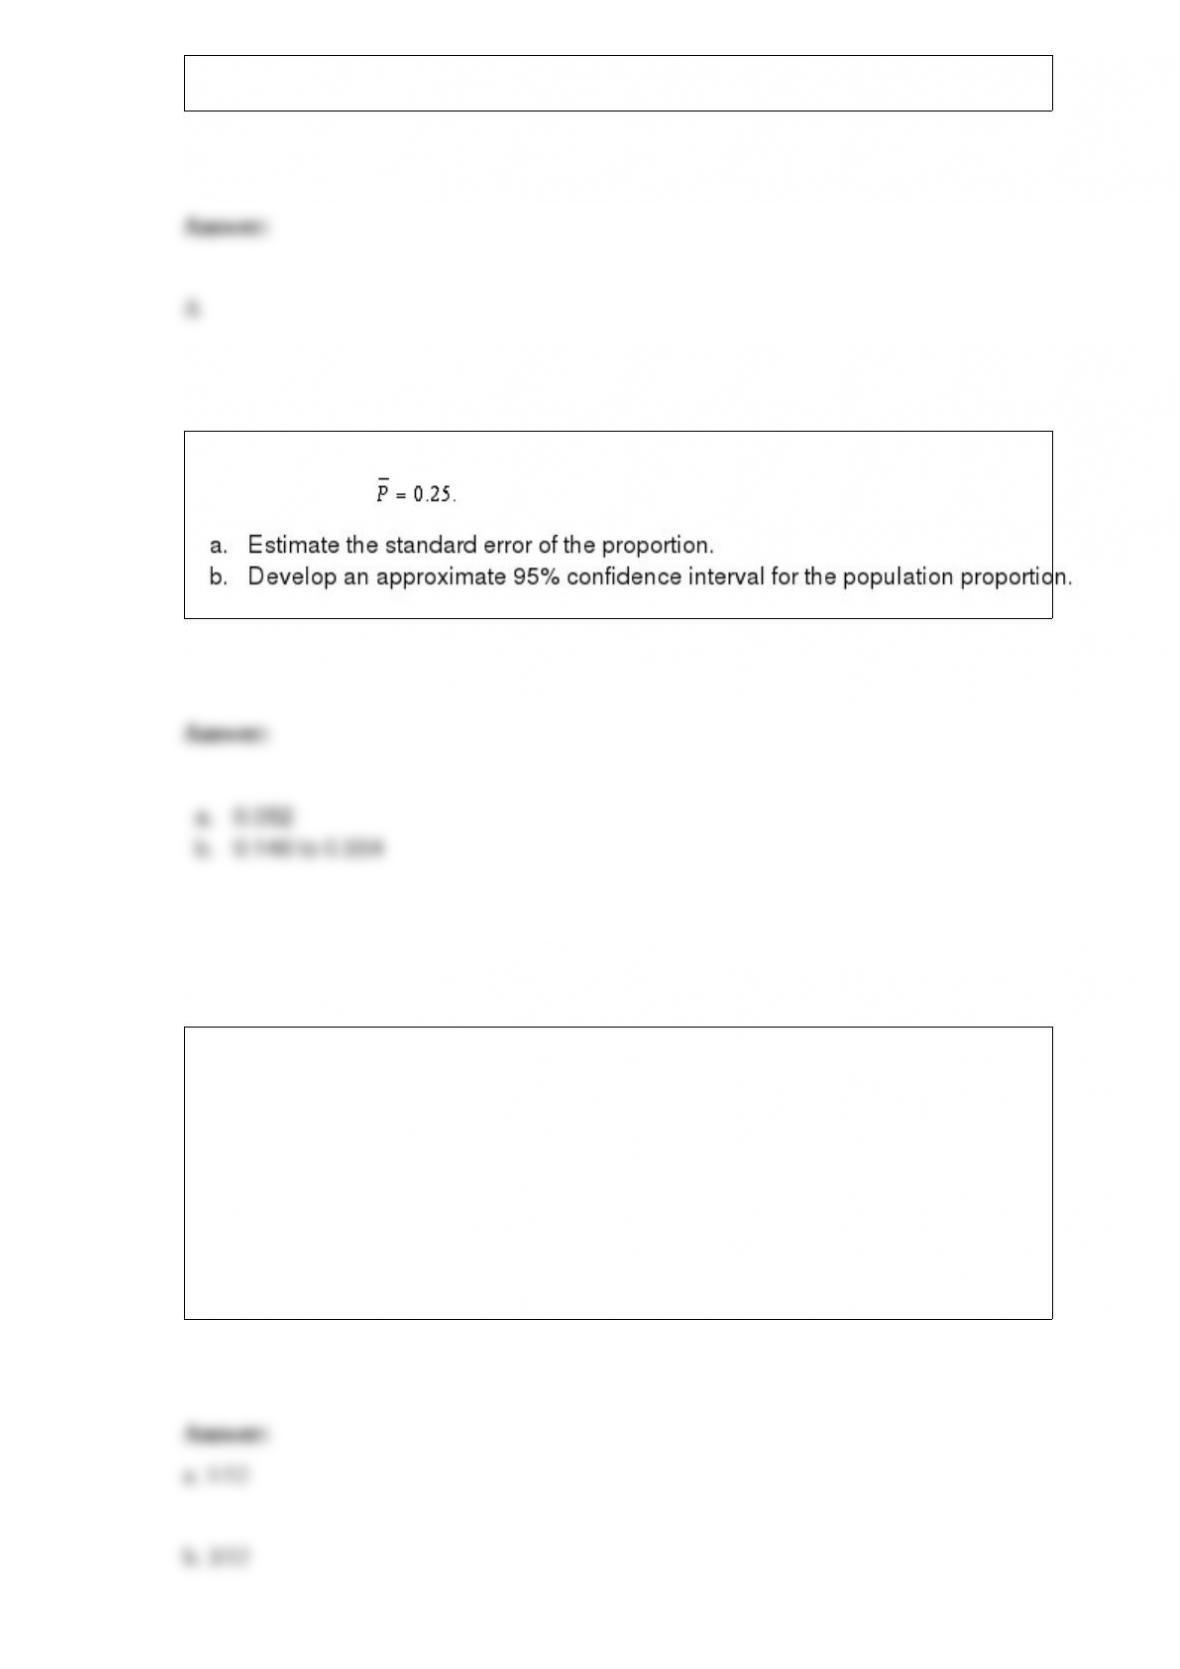
A random sample of 60 elements was selected from a population of size 400. The
sample proportion
Assume that in your hand you hold an ordinary six-sided die and a dime. You toss both
the die and the dime on a table.
a. What is the probability that a head appears on the dime and a six on the die?
b. What is the probability that a tail appears on the dime and any number more than 3
on the die?
c. What is the probability that a number larger than 2 appears on the die?

Exhibit 6-5
The weight of items produced by a machine is normally distributed with a mean of 8
ounces and a standard deviation of 2 ounces.
Refer to Exhibit 6-5. What is the probability that a randomly selected item will weigh
between 11 and 12 ounces?
a. 0.4772
b. 0.4332
c. 0.9104
d. 0.0440
Excel’s HYPGEOM.DIST function has how many inputs?
a. 2
b. 3
c. 4
d. 5

A sample of 16 cookies is taken to test the claim that each cookie contains at least 9
chocolate chips. The average number of chocolate chips per cookie in the sample was
7.875 with a standard deviation of 1. Assume the distribution of the population is
normal.
a. State the null and alternative hypotheses.
b. Using a critical value, test the hypothesis at the 1% level of significance.
c. Using a p-value, test the hypothesis at the 1% level of significance.
d. Compute the probability of a Type II error if the true number of chocolate chips per
cookie is 8.
Dr. Kurt Thearling, a leading practitioner in the field, defines data mining as ‘œthe
_________ extraction of _________ information from databases’.
a. thorough, insightful
b. timely, accurate
c. automated, predictive
d. intentional, useful

Exhibit 10-10
The results of a recent poll on the preference of shoppers regarding two products are
shown below.
Refer to Exhibit 10-10. The 95% confidence interval estimate for the difference
between the populations favoring the products is
a. -0.024 to 0.064
b. 0.6 to 0.7
c. 0.024 to 0.7
d. 0.02 to 0.3
In order to determine whether or not the sales volume of a company (y in millions of
dollars) is related to advertising expenditures (x1 in millions of dollars) and the number
of salespeople (x2), data were gathered for 10 years. Part of the Excel output is shown
below.
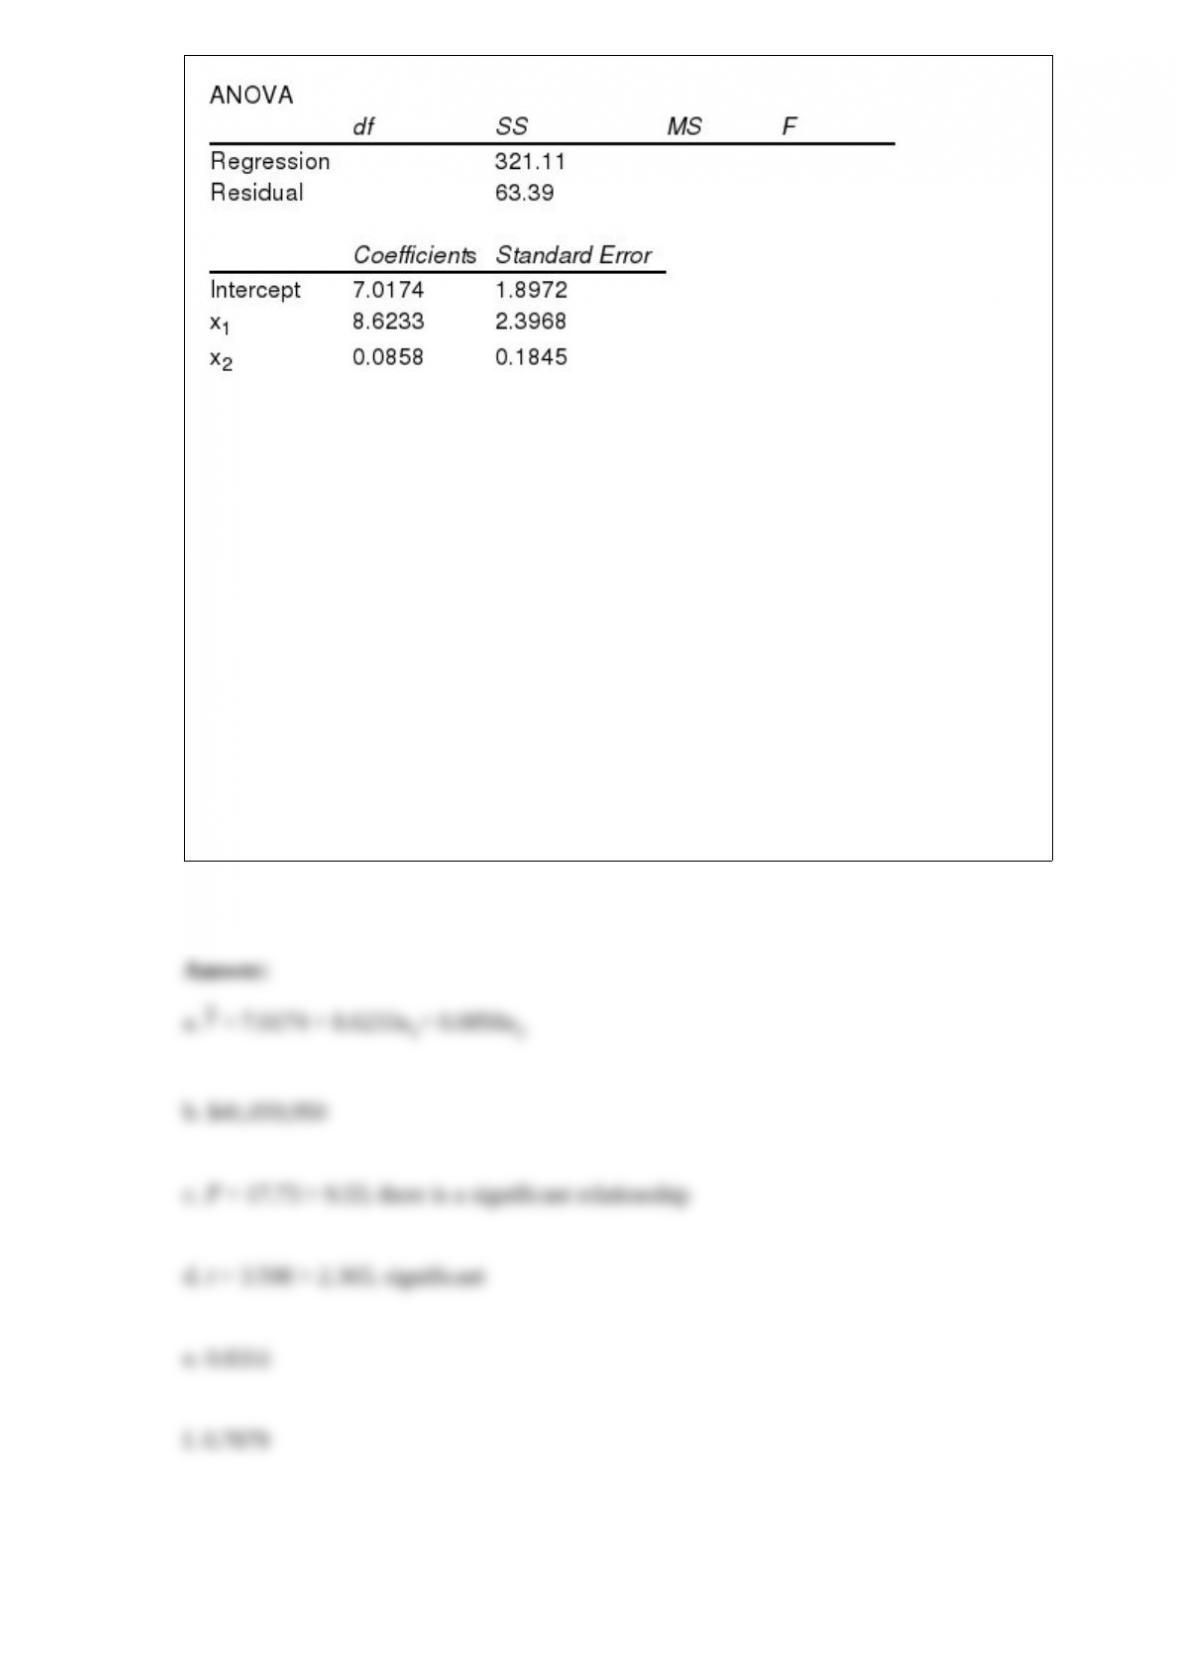
a. Use the above results and write the regression equation that can be used to predict
sales.
b. Estimate the sales volume for an advertising expenditure of 3.5 million dollars and
45 salespeople. Give your answer in dollars.
c. At = 0.01, test to determine if the fitted equation developed in Part a represents a
significant relationship between the independent variables and the dependent variable.
d. At = 0.05, test to see if 1 is significantly different from zero.
e. Determine the multiple coefficient of determination.
f. Compute the adjusted coefficient of determination.

A population consists of 500 elements. We want to draw a simple random sample of 50
elements from this population. On the first selection, the probability of an element
being selected is
a. 0.100
b. 0.010
c. 0.001
d. 0.002