The life expectancy of Timely brand watches is normally distributed with a mean of
four years and a standard deviation of eight months.
a. What is the probability that a randomly selected watch will be in working condition
for more than five years?
b. The company has a three-year warranty period on their watches. What percentage of
their watches will be in operating condition after the warranty period?
c. What are the minimum and the maximum life expectancy of the middle 95% of the
watches?
d. Ninety-five percent of the watches will have a life expectancy of at least how many
months?
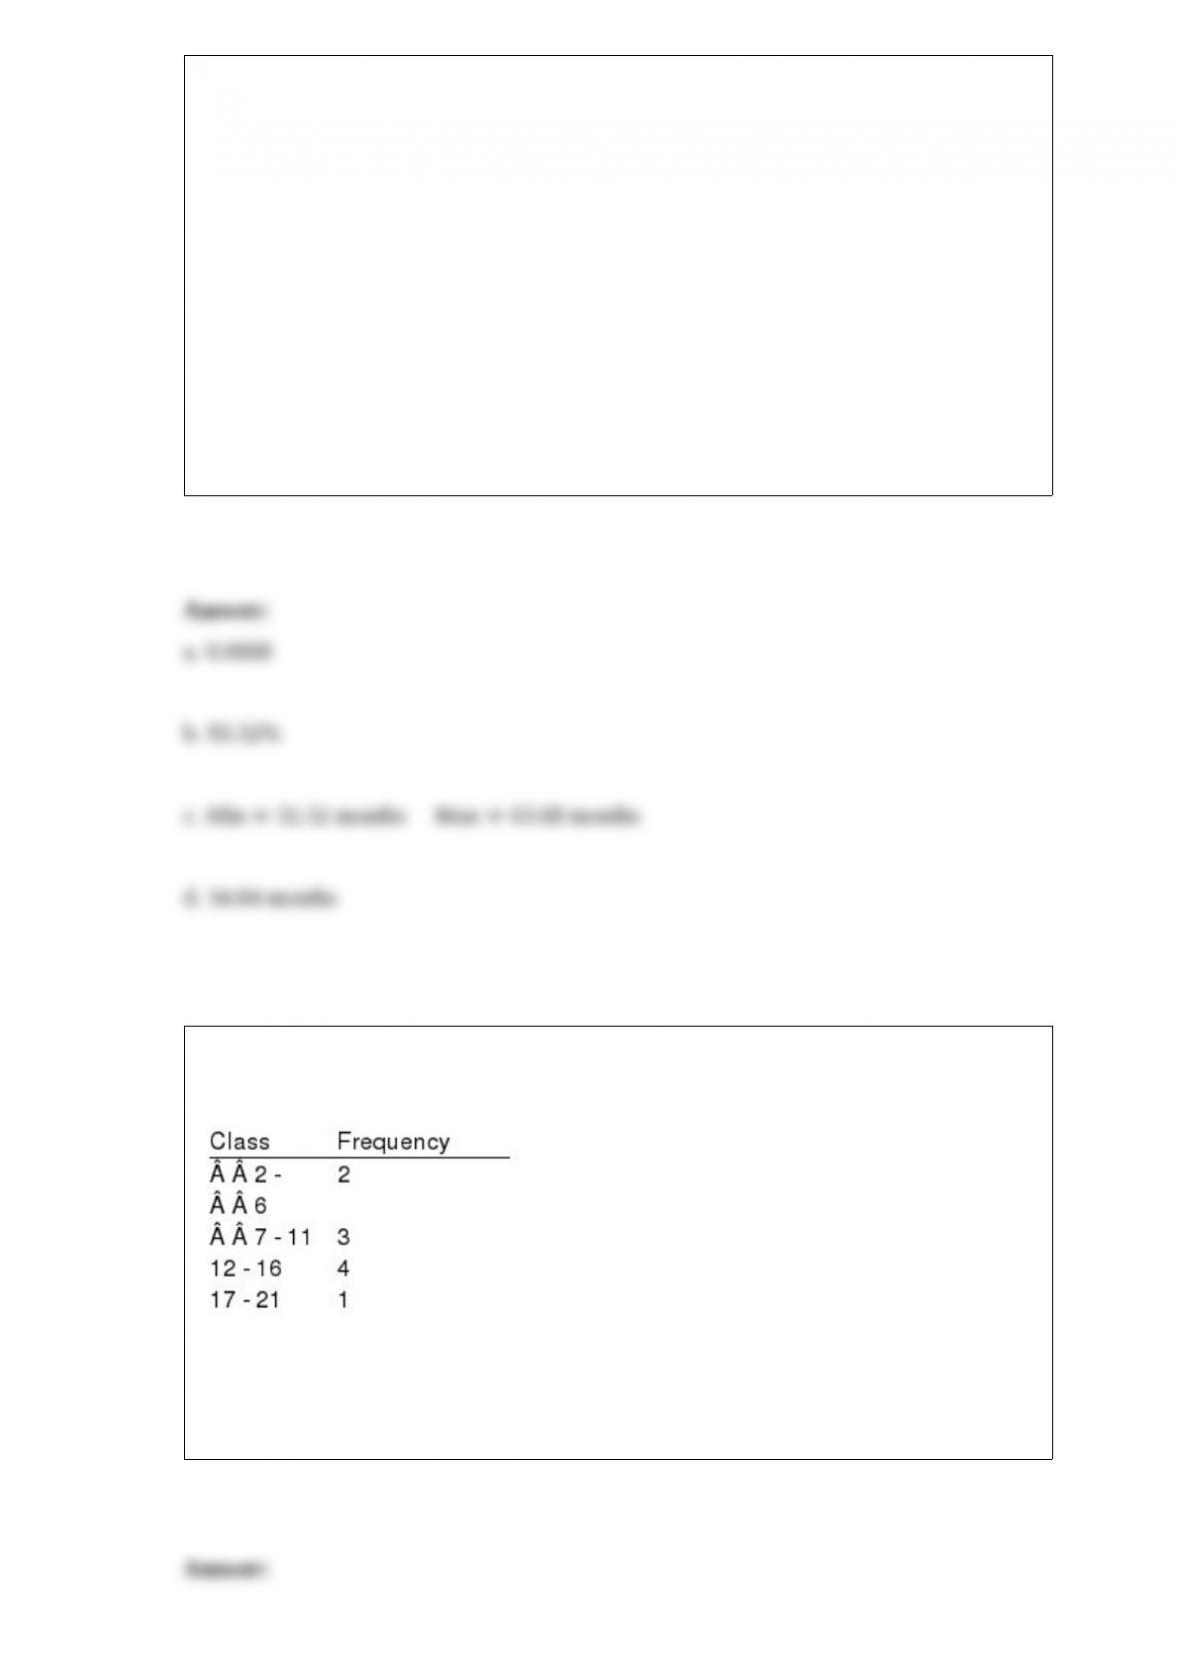
Consider the data in the following frequency distribution. Assume the data represent a
population.
For the above data, compute the following.
a. The mean
b. The variance
c. The standard deviation
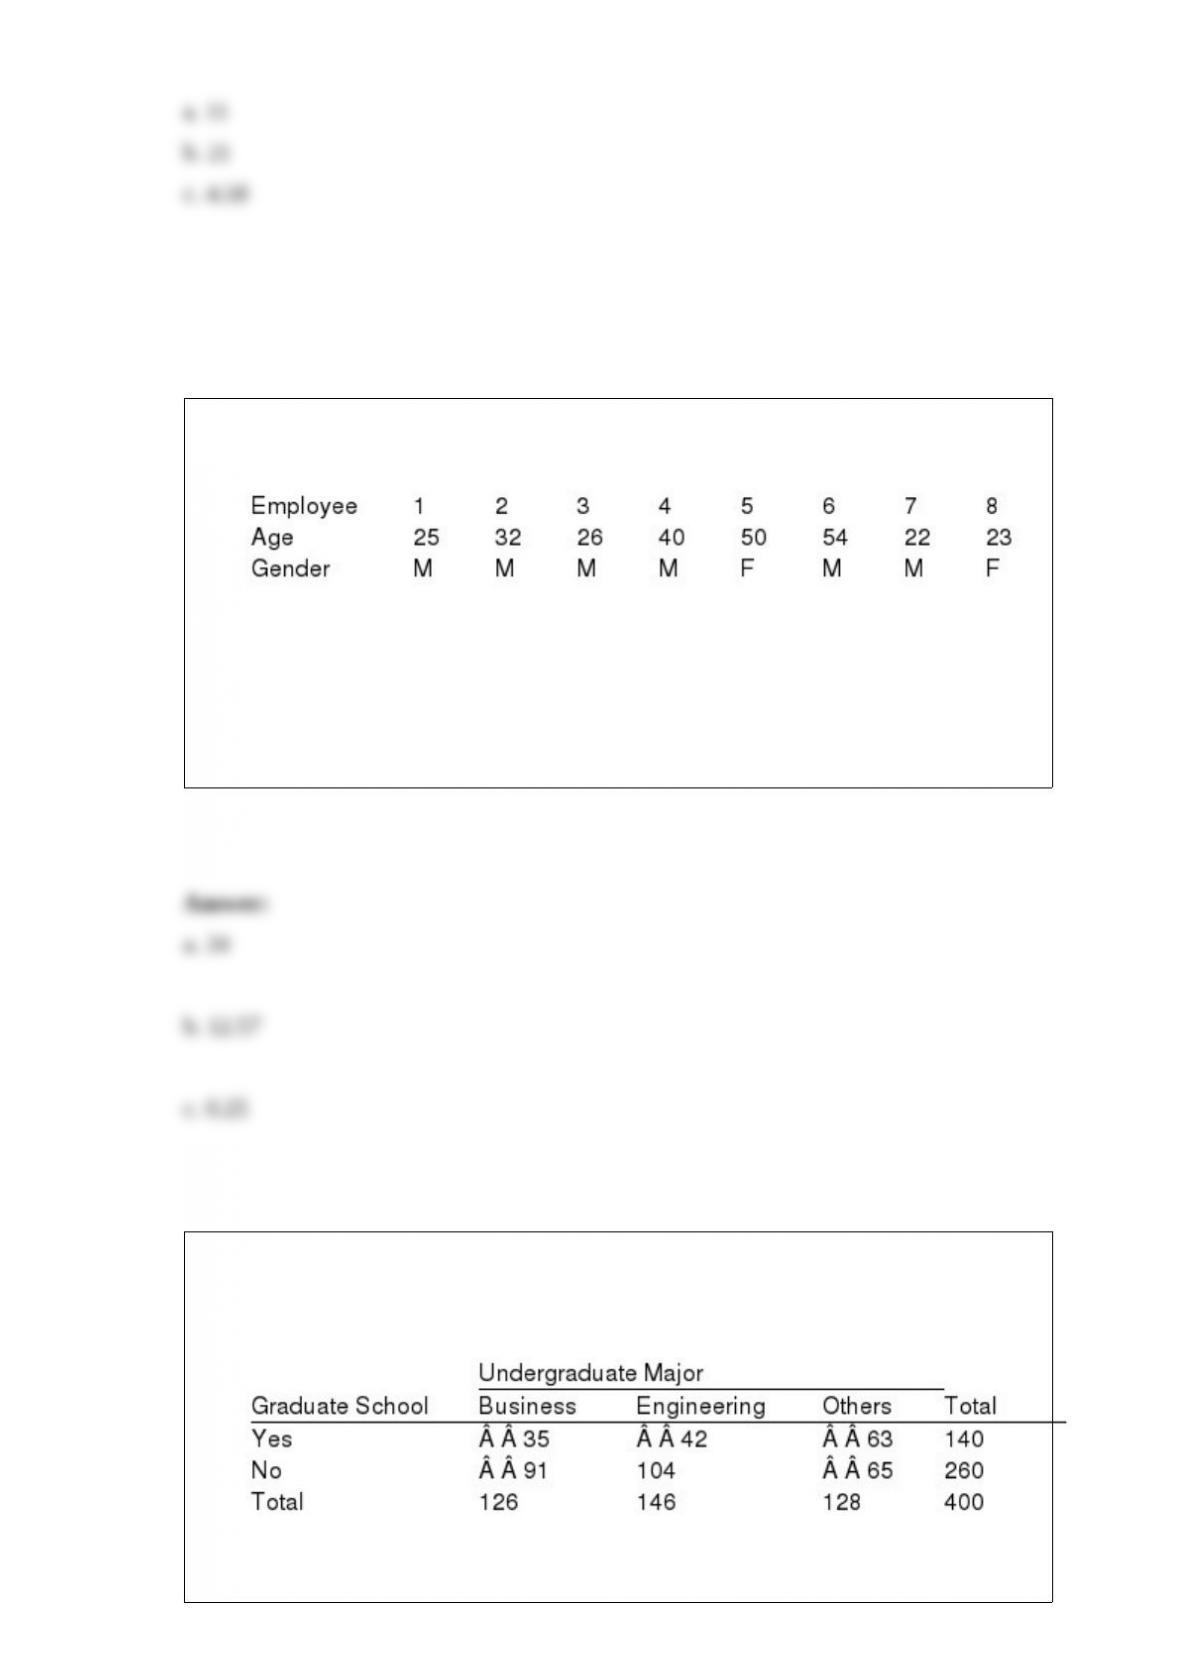
A simple random sample of 8 employees of a corporation provided the following
information.
a. Determine the point estimate for the average age of all employees.
b. What is the point estimate for the standard deviation of the population?
c. Determine a point estimate for the proportion of all employees who are female.
Exhibit 2-4
A survey of 400 college seniors resulted in the following crosstabulation regarding their
undergraduate major and whether or not they plan to go to graduate school.
Refer to Exhibit 2-4. Of those students who are majoring in business, what percentage
plans to go to graduate school?
a. 27.78
b. 8.75
c. 70
d. 72.22
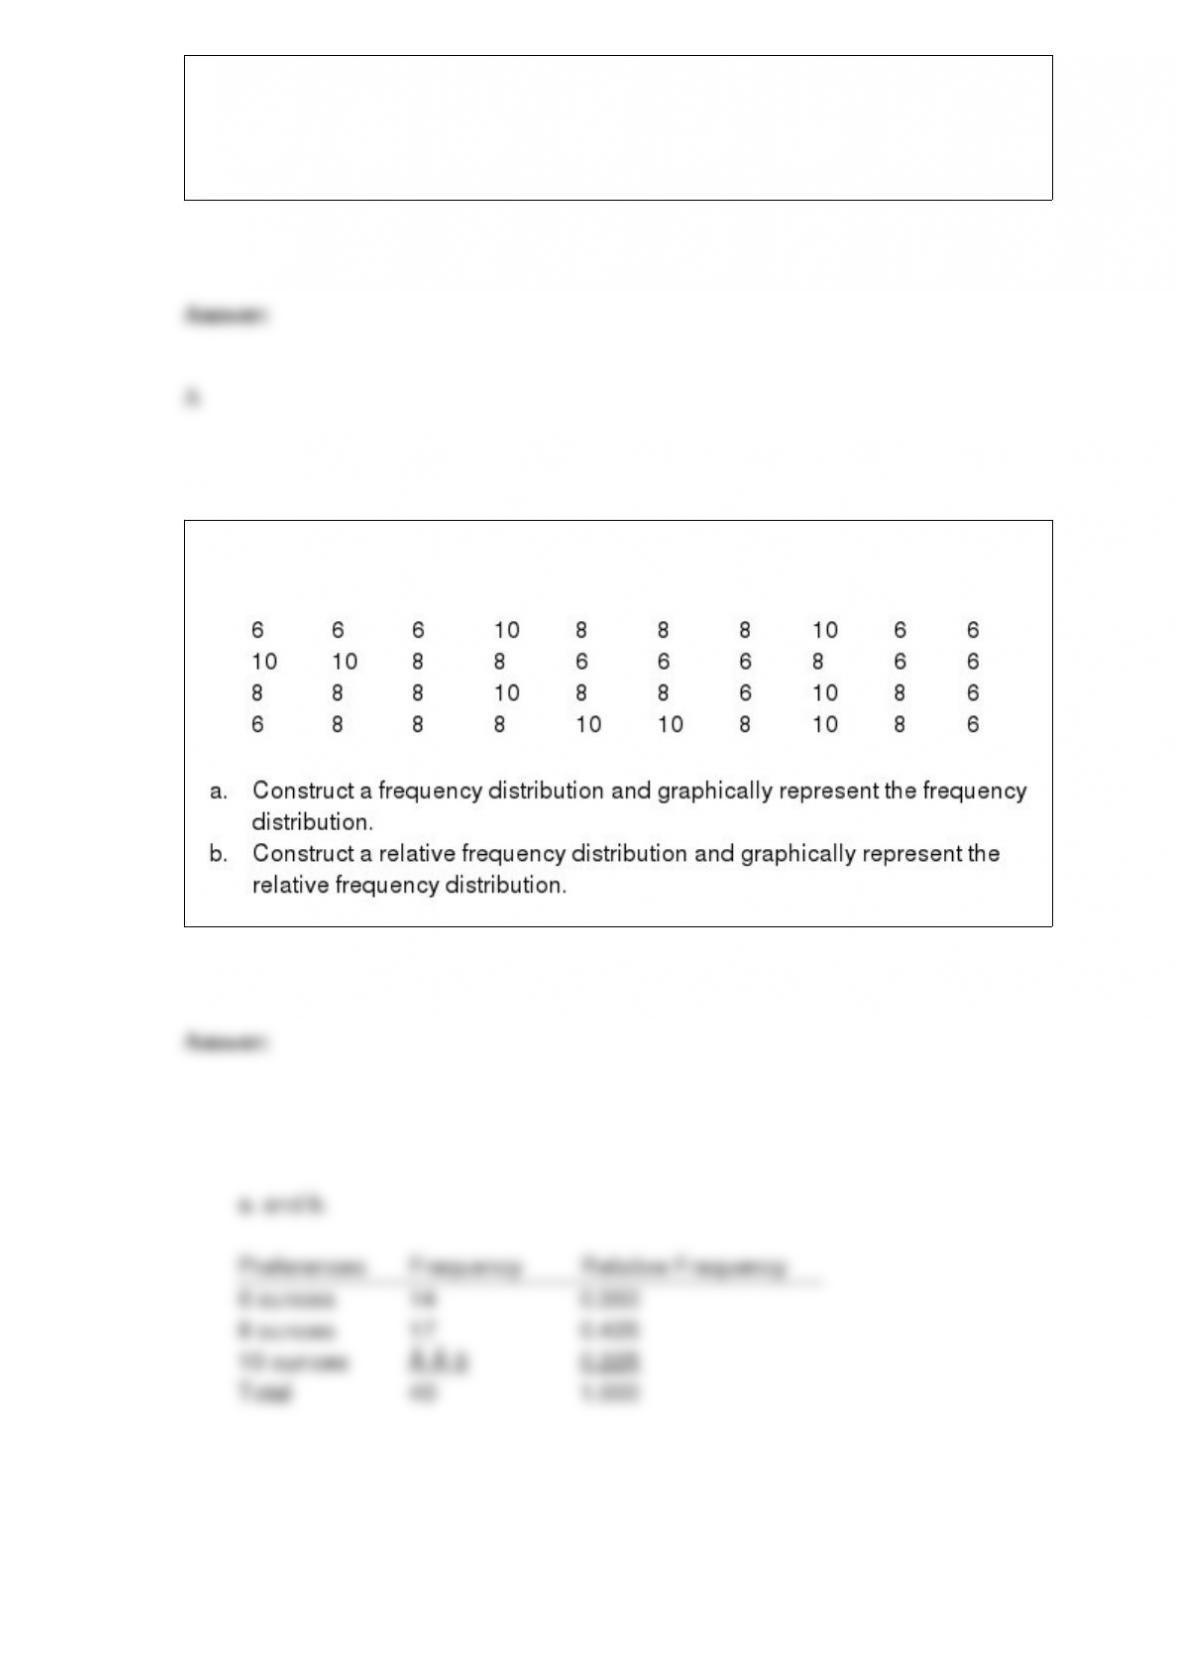
Forty shoppers were asked if they preferred the weight of a can of soup to be 6 ounces,
8 ounces, or 10 ounces. Below are their responses.

Exhibit 14-3
Regression analysis was applied between sales data (in $1,000s) and advertising data
(in $100s) and the following information was obtained.
Refer to Exhibit 14-3. Using 0.05, the critical t value for testing the significance of
the slope is
a. 1.753
b. 2.131
c. 1.746
d. 2.120
A probability distribution showing the probability of x successes in n trials, where the
probability of success does not change from trial to trial, is termed a
a. uniform probability distribution
b. binomial probability distribution
c. hypergeometric probability distribution
d. normal probability distribution
The standard deviation of a point estimator is the
a. standard error
b. sample statistic
c. point estimate
d. sampling error
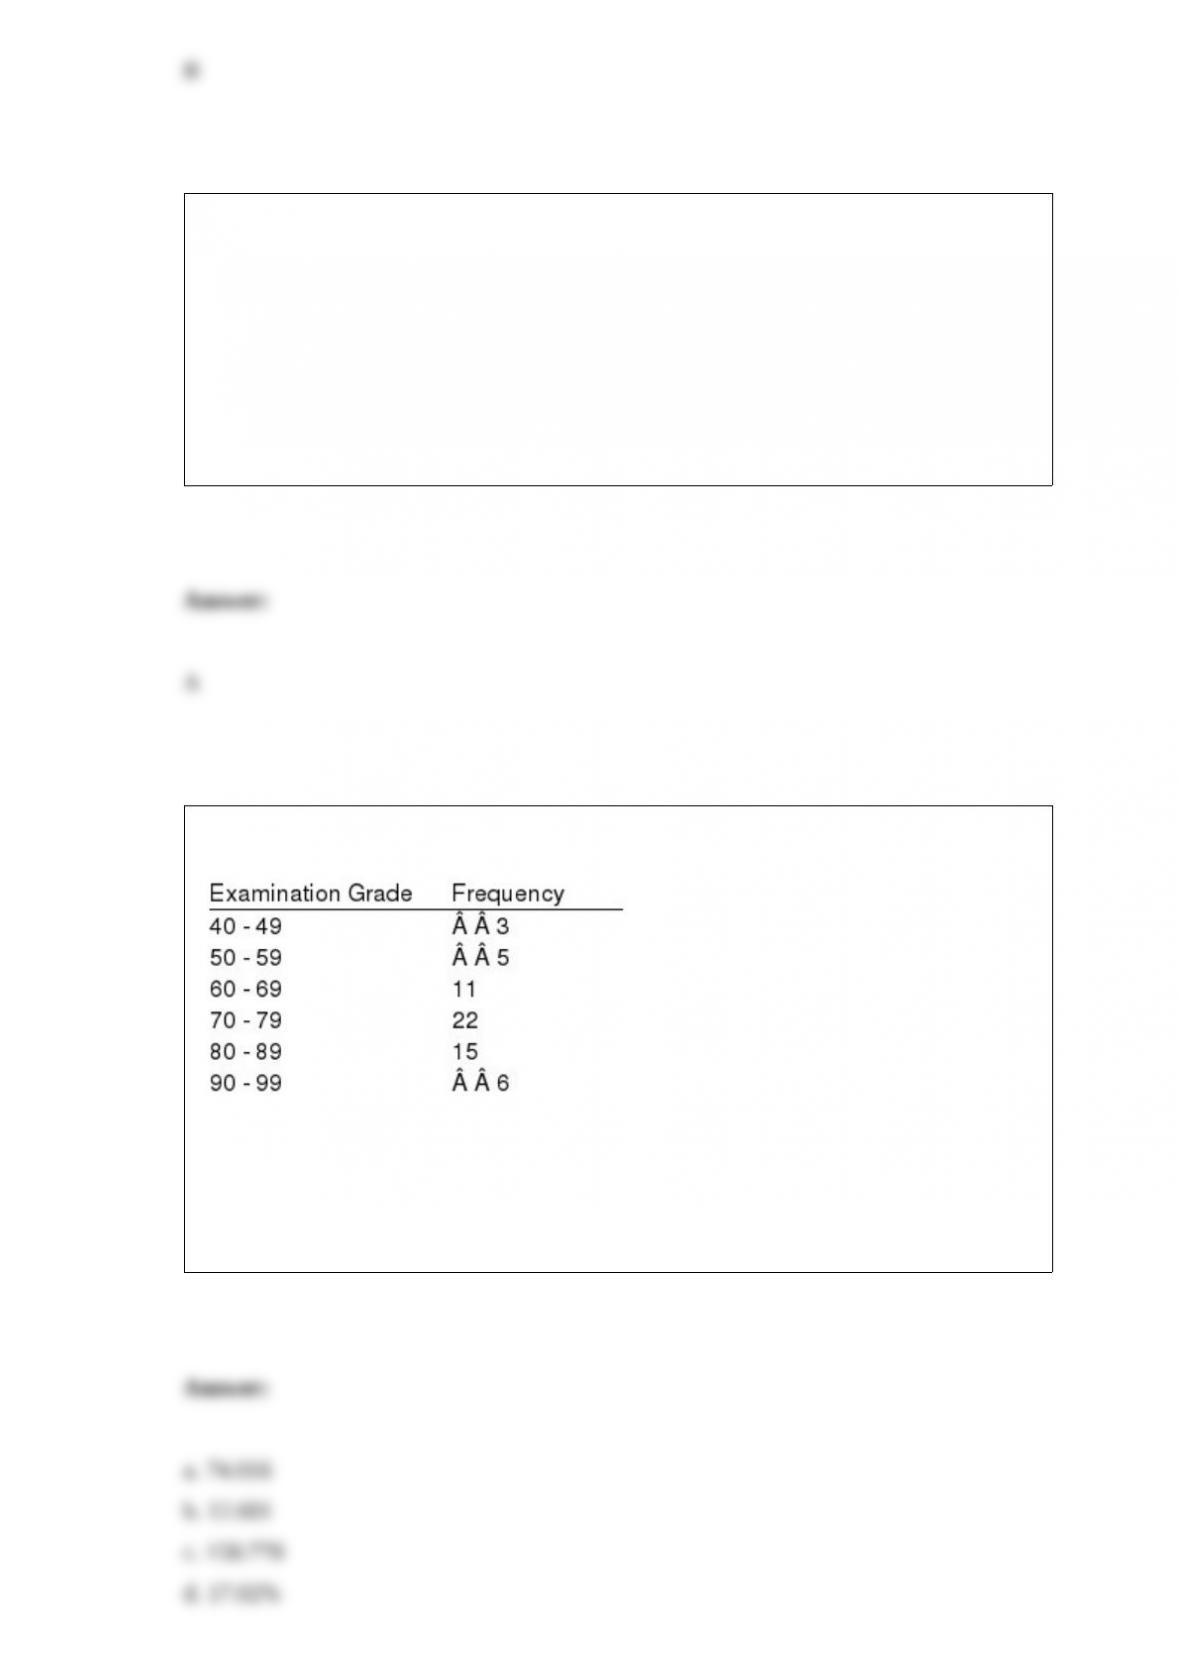
The following is a frequency distribution of grades for a statistics examination.
Treating these data as a sample, compute the following:
a. The mean
b. The standard deviation
c. The variance
d. The coefficient of variation
The makers of a soft drink want to identify the average age of its consumers. A sample
of 16 consumers is taken. The average age in the sample was 5 years with a standard
deviation of 5 years. Assume the population of consumer ages is normally distributed.
a. Construct a 95% confidence interval for the average age of all the consumers.
b. Construct an 80% confidence interval for the average age of all the consumers.
c. Discuss why the 95% and 80% confidence intervals are different.
Exhibit 14-6
You are given the following information about y and x.
Refer to Exhibit 14-6. The coefficient of determination equals
a. -0.4364
b. 0.4364
c. -0.1905
d. 0.1905
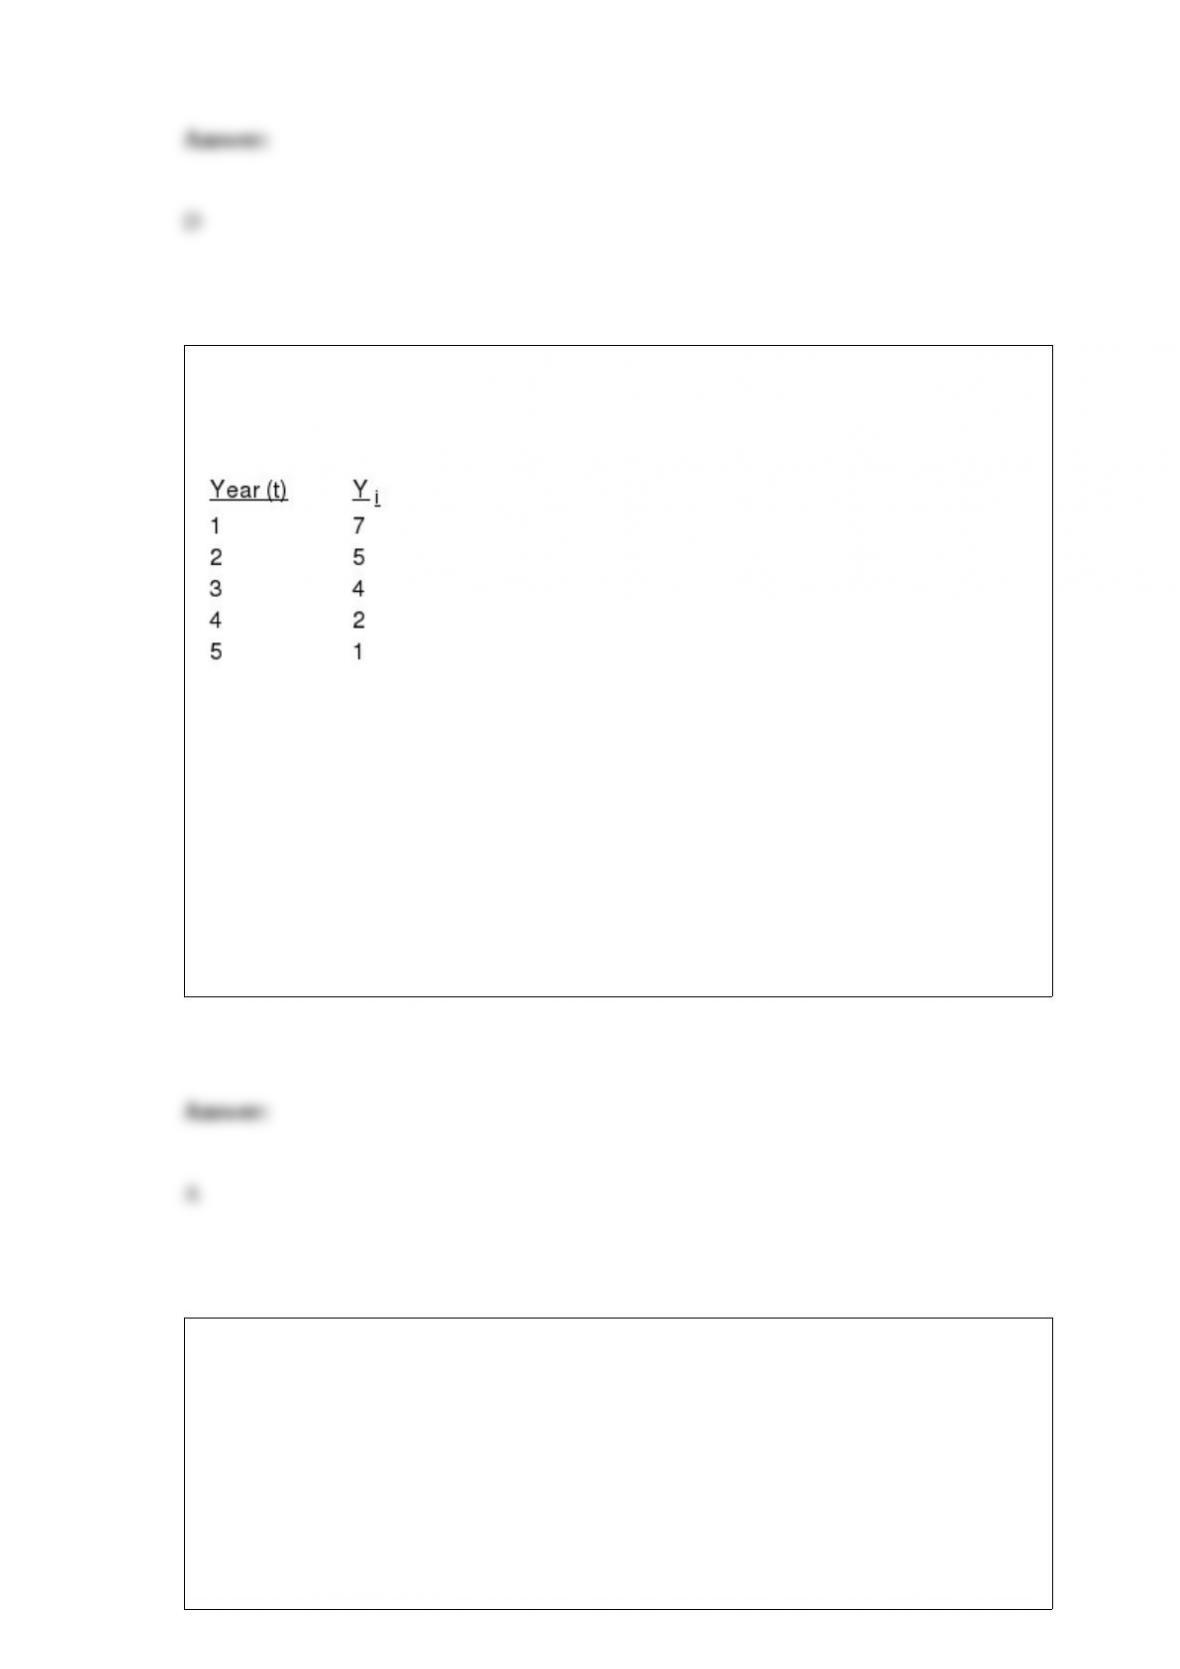
44. Exhibit 17-3
Consider the following time series.
Refer to Exhibit 17-3. The slope of linear trend equation, b1, is
a. -1.5
b. +1.5
c. 8.3
d. -8.3
In a large university, 20% of the students are business majors. A random sample of 100
students is selected, and their majors are recorded.
a. Compute the standard error of the proportion.
b. What is the probability that the sample contains at least 12 business majors?
c. What is the probability that the sample contains less than 15 business majors?

d. What is the probability that the sample contains between 12 and 14 business majors?
The probability of both sample information and a particular state of nature occurring
simultaneously is
a. joint probability
b. unconditional probability
c. marginal probability
d. conditional probability
To construct a bar chart using Excel’s Chart Tools, choose __________ as the chart
type.
a. column
b. pie
c. scatter
d. line

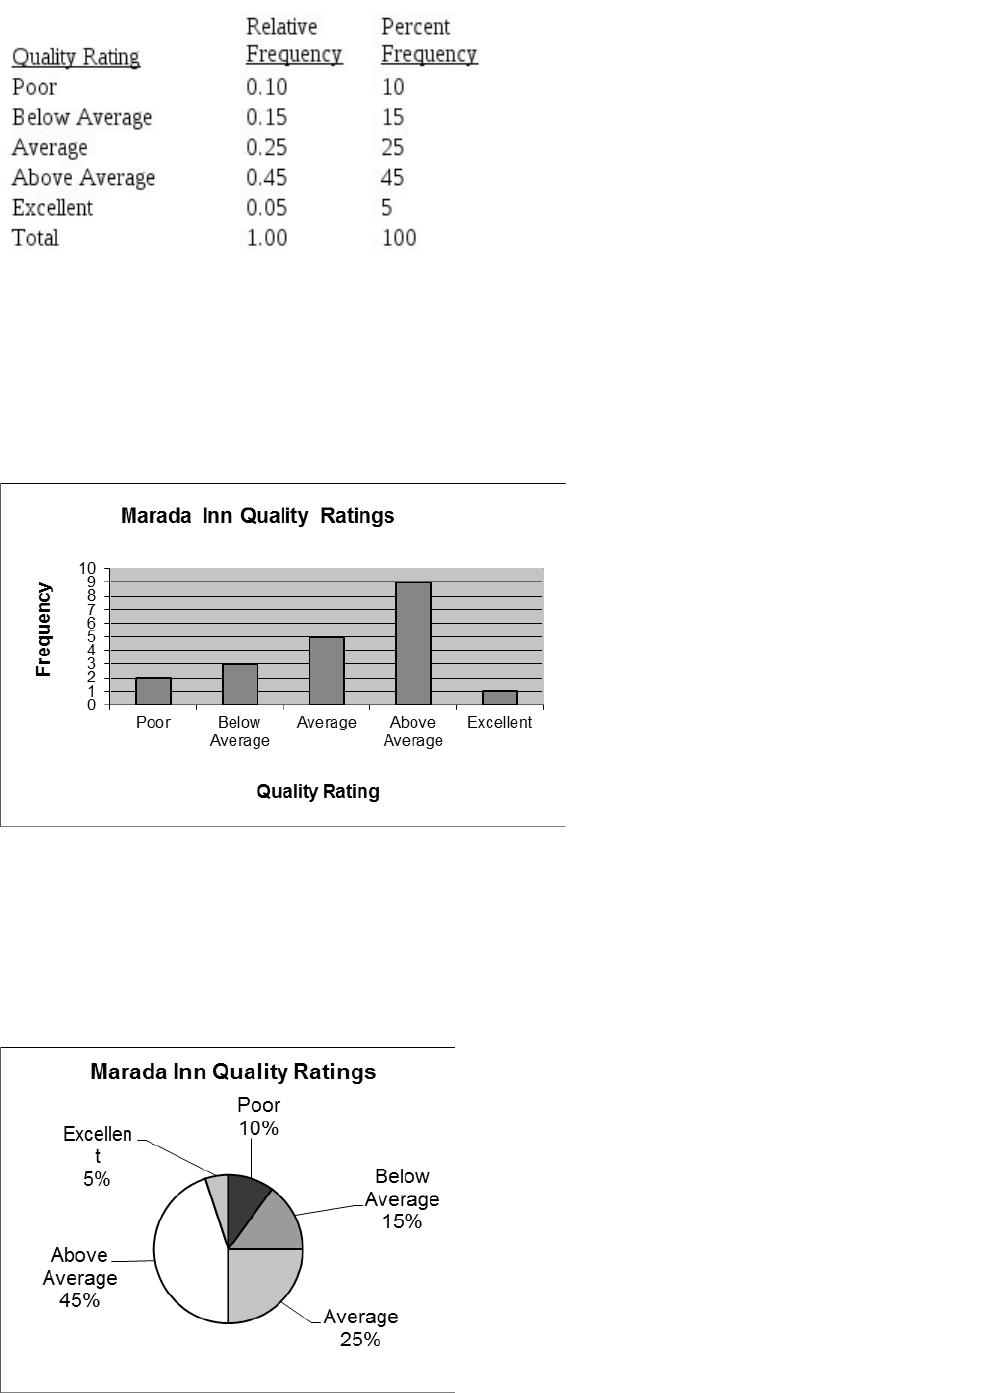
Guests staying at Marada Inn were asked to rate the quality of their
accommodations as being excellent, above average, average, below
average, or poor. The ratings provided by a sample of 20 quests are shown
below.
Below Average Average Above Average Above
Average
Above Average Above Average Above Average Below
Average
Below Average Average Poor Poor
Above Average Average Above Average Average
Excellent Above Average Average Above Average
a. Provide a frequency distribution showing the number of occurrences of
each rating level in the sample.
b. Construct relative frequency and percent frequency distributions for the
data.
c. Display the frequencies graphically with a bar graph.
d. Display the percent frequencies graphically with a pie chart.
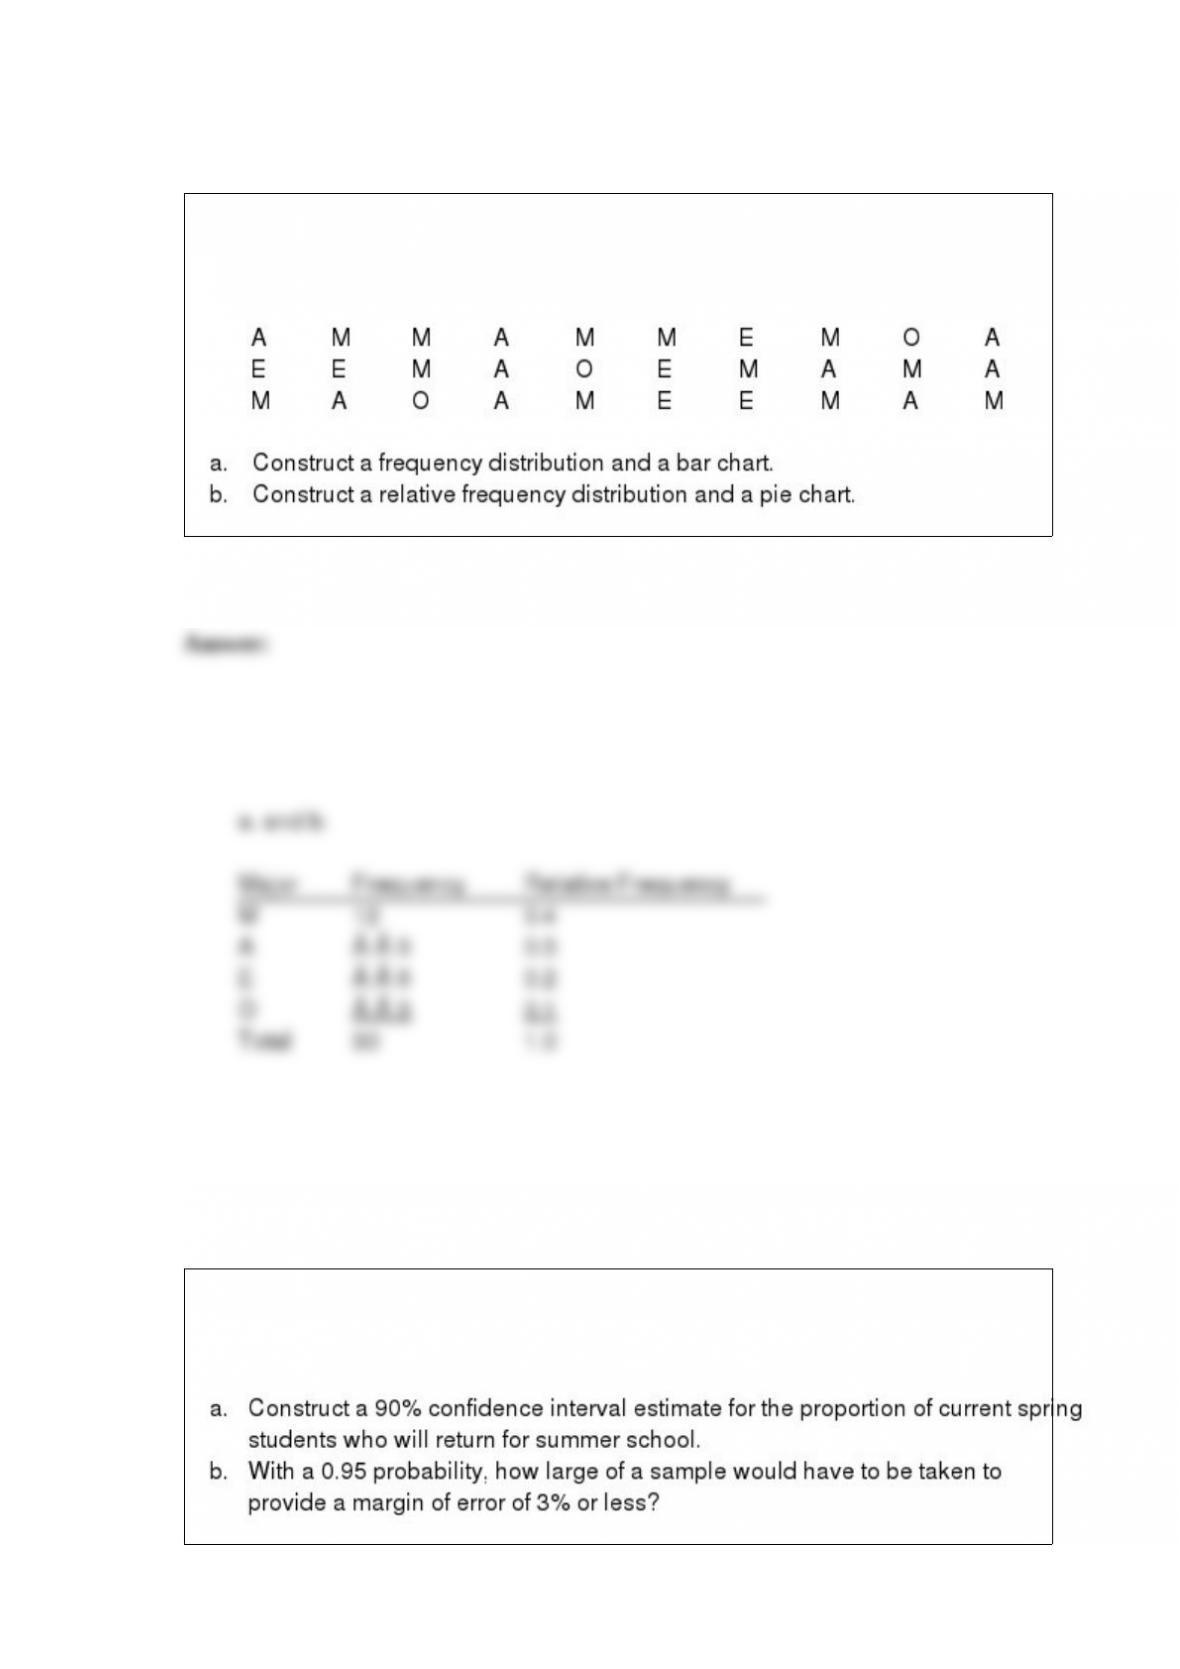
Thirty students in the School of Business were asked what their majors were. The
following represents their responses (M Management; A Accounting; E
Economics; O Others).
A university planner wants to determine the proportion of spring semester students who
will attend summer school. She surveys 32 current students discovering that 12 will
return for summer school.

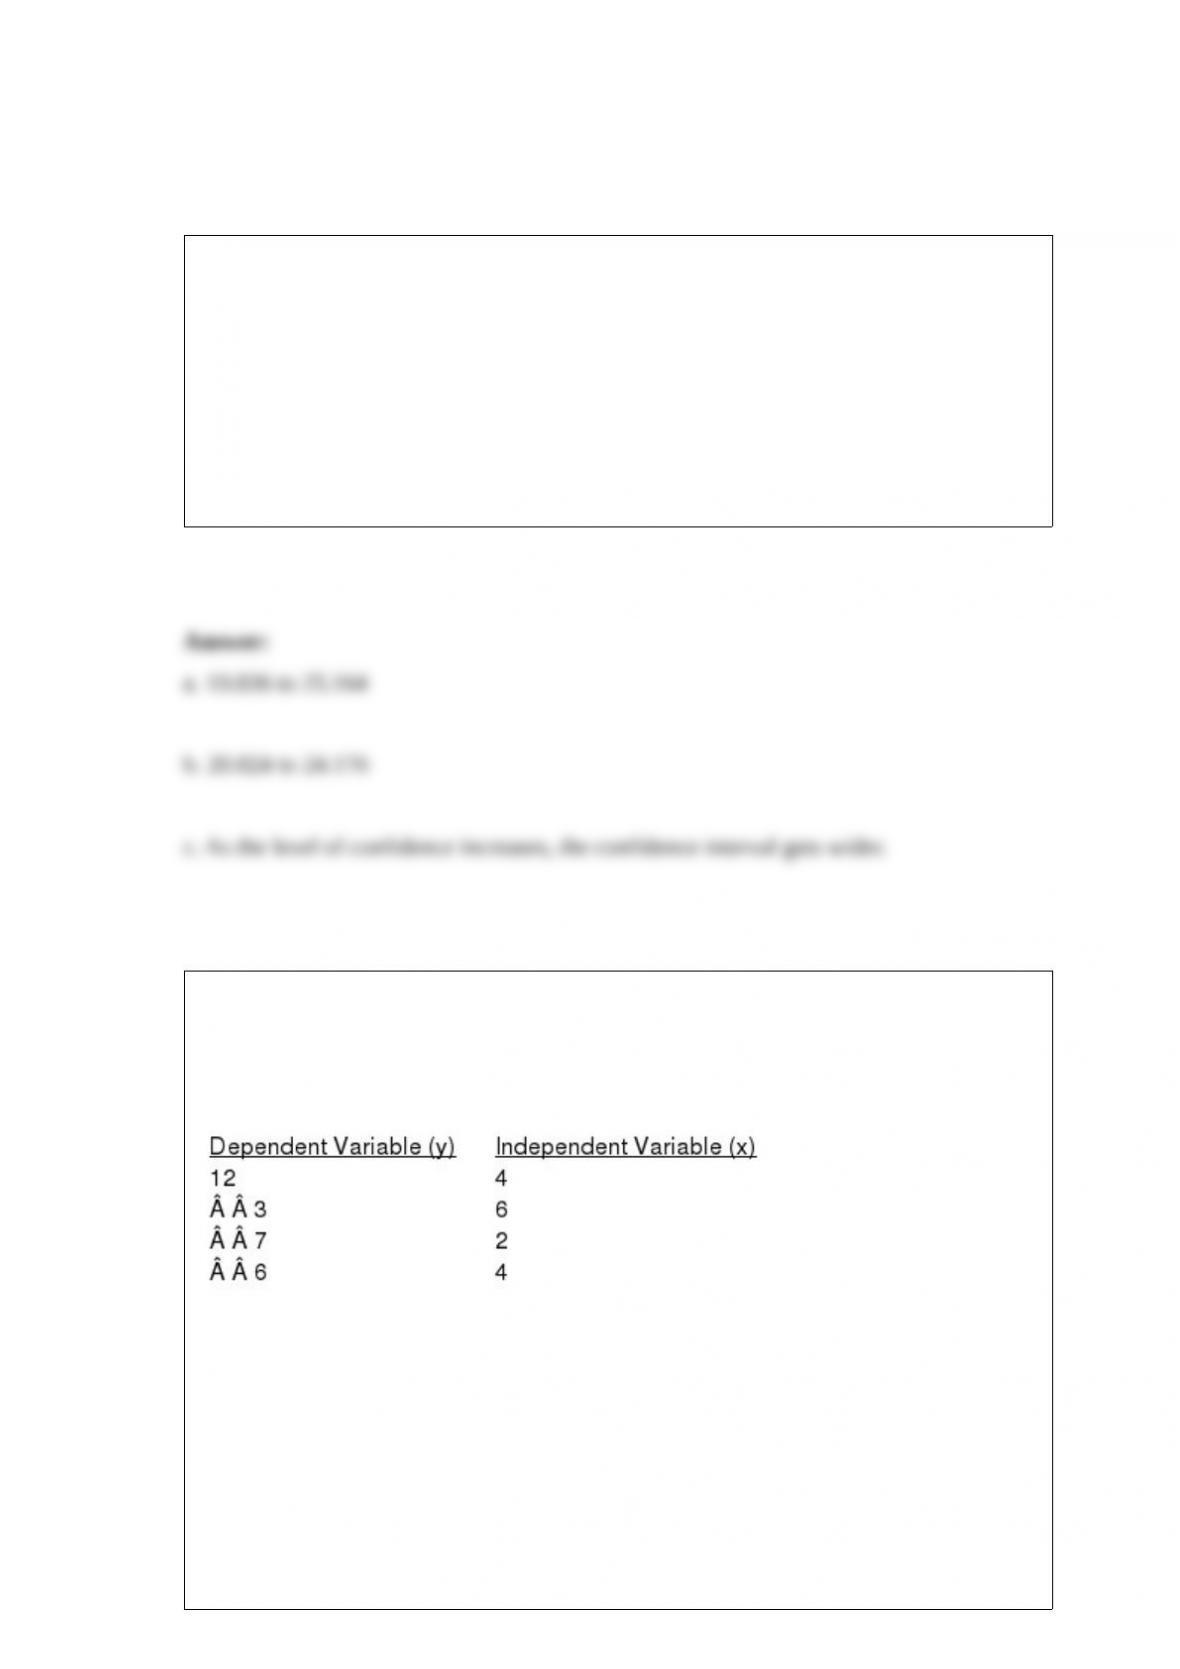
Exhibit 14-4
The following information regarding a dependent variable (Y) and an independent
variable (X) is provided.
SSE = 6
SST = 16
Refer to Exhibit 14-4. The coefficient of determination is
a. 0.7096
b. – 0.7906
c. 0.625
d. 0.375
The time required to assemble a part of a machine follows an exponential probability
distribution with a mean of 14 minutes.

Exhibit 15-3
In a regression model involving 30 observations, the following estimated regression
equation was obtained:
= 17 + 4x1 – 3x2 + 8x3 + 8x4
For this model SSR = 700 and SSE = 100.
Refer to Exhibit 15-3. The critical F value at 95% confidence is
a. 2.53
b. 2.69
c. 2.76
d. 2.99
An appliance dealer must decide how many (if any) new microwave ovens to order for
next month. The ovens cost $220 and sell for $300. Because the oven company is
coming out with a new product line in two months, any ovens not sold next month will
have to be sold at the dealer’s half price clearance sale.
Additionally, the appliance dealer feels he suffers a loss of $25 for every oven
demanded when he is out of stock. On the basis of past months’ sales data, the dealer
estimates the probabilities of monthly demand (D) for 0, 1, 2, or 3 ovens to be .3, .4, .2,
and .1, respectively.
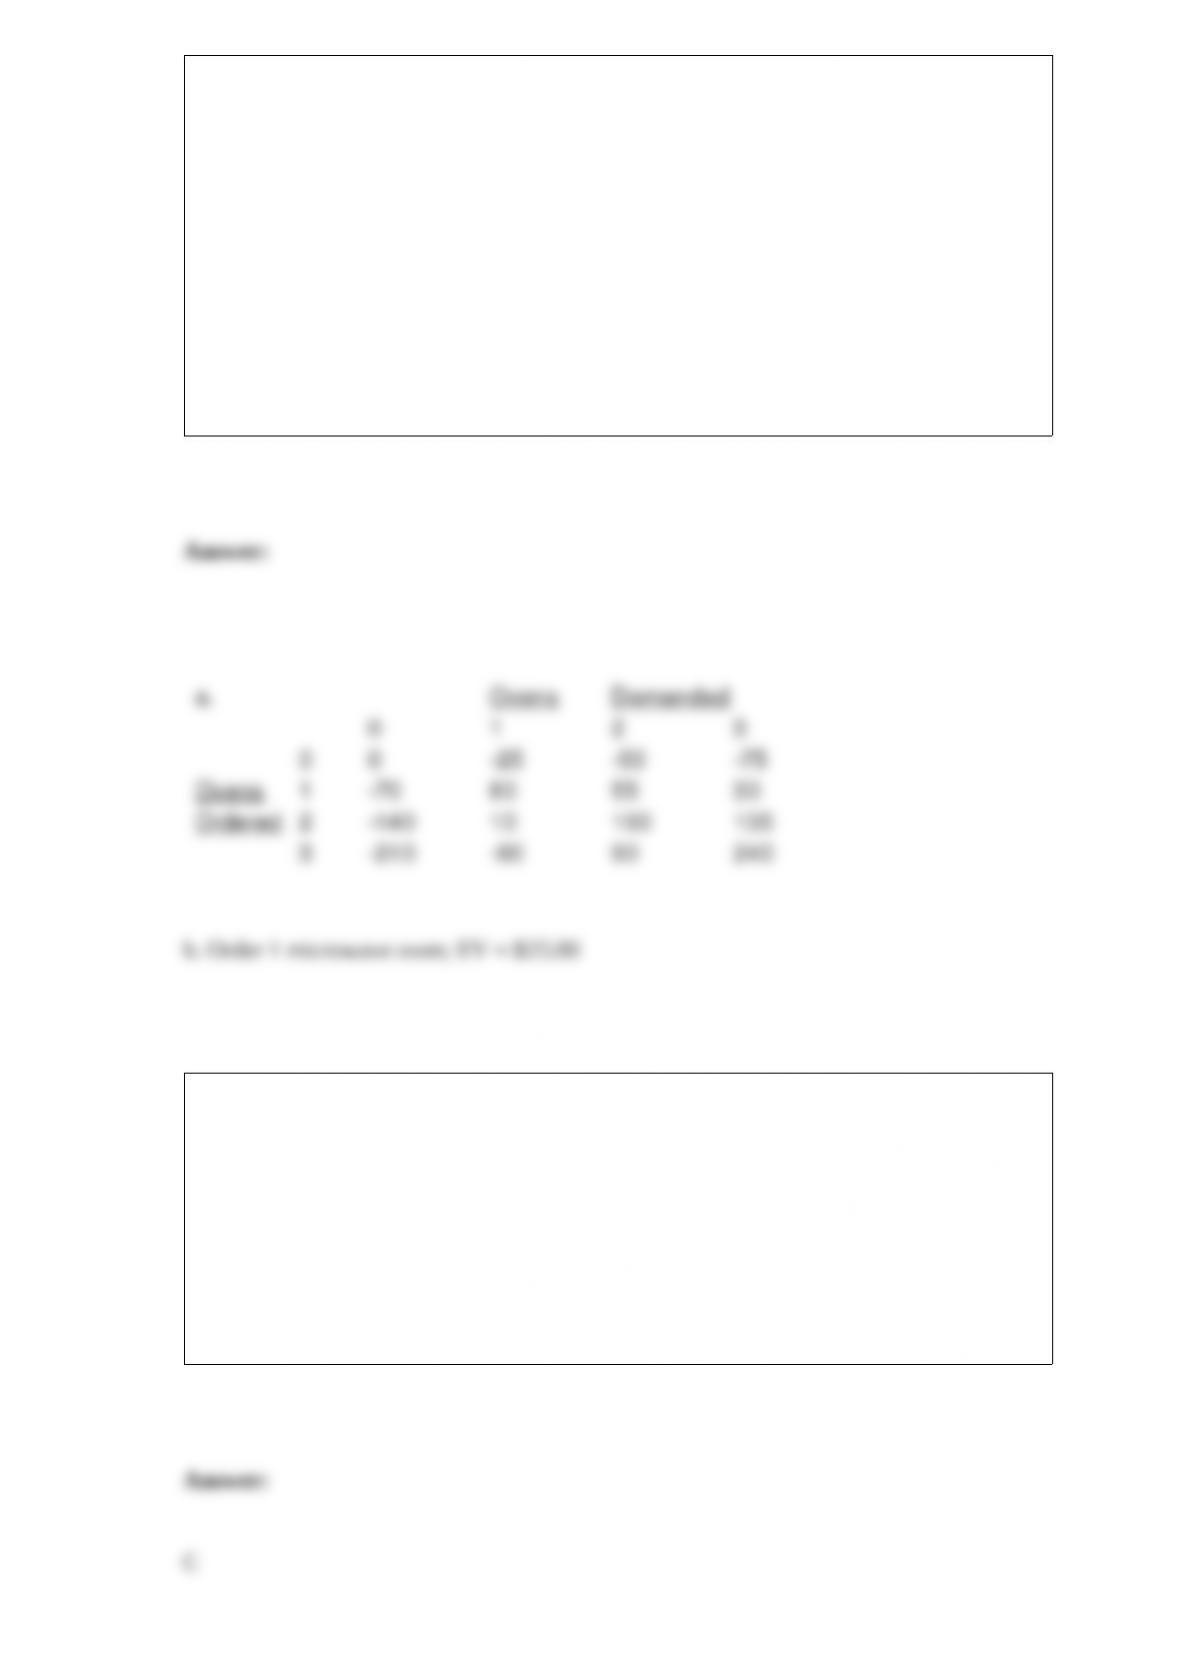
a. Construct a payoff table for this problem.
b. Determine the optimal decision using the expected value approach.
A characteristic of interest for the elements is called a(n)
a. sample
b. data set
c. variable
d. observation
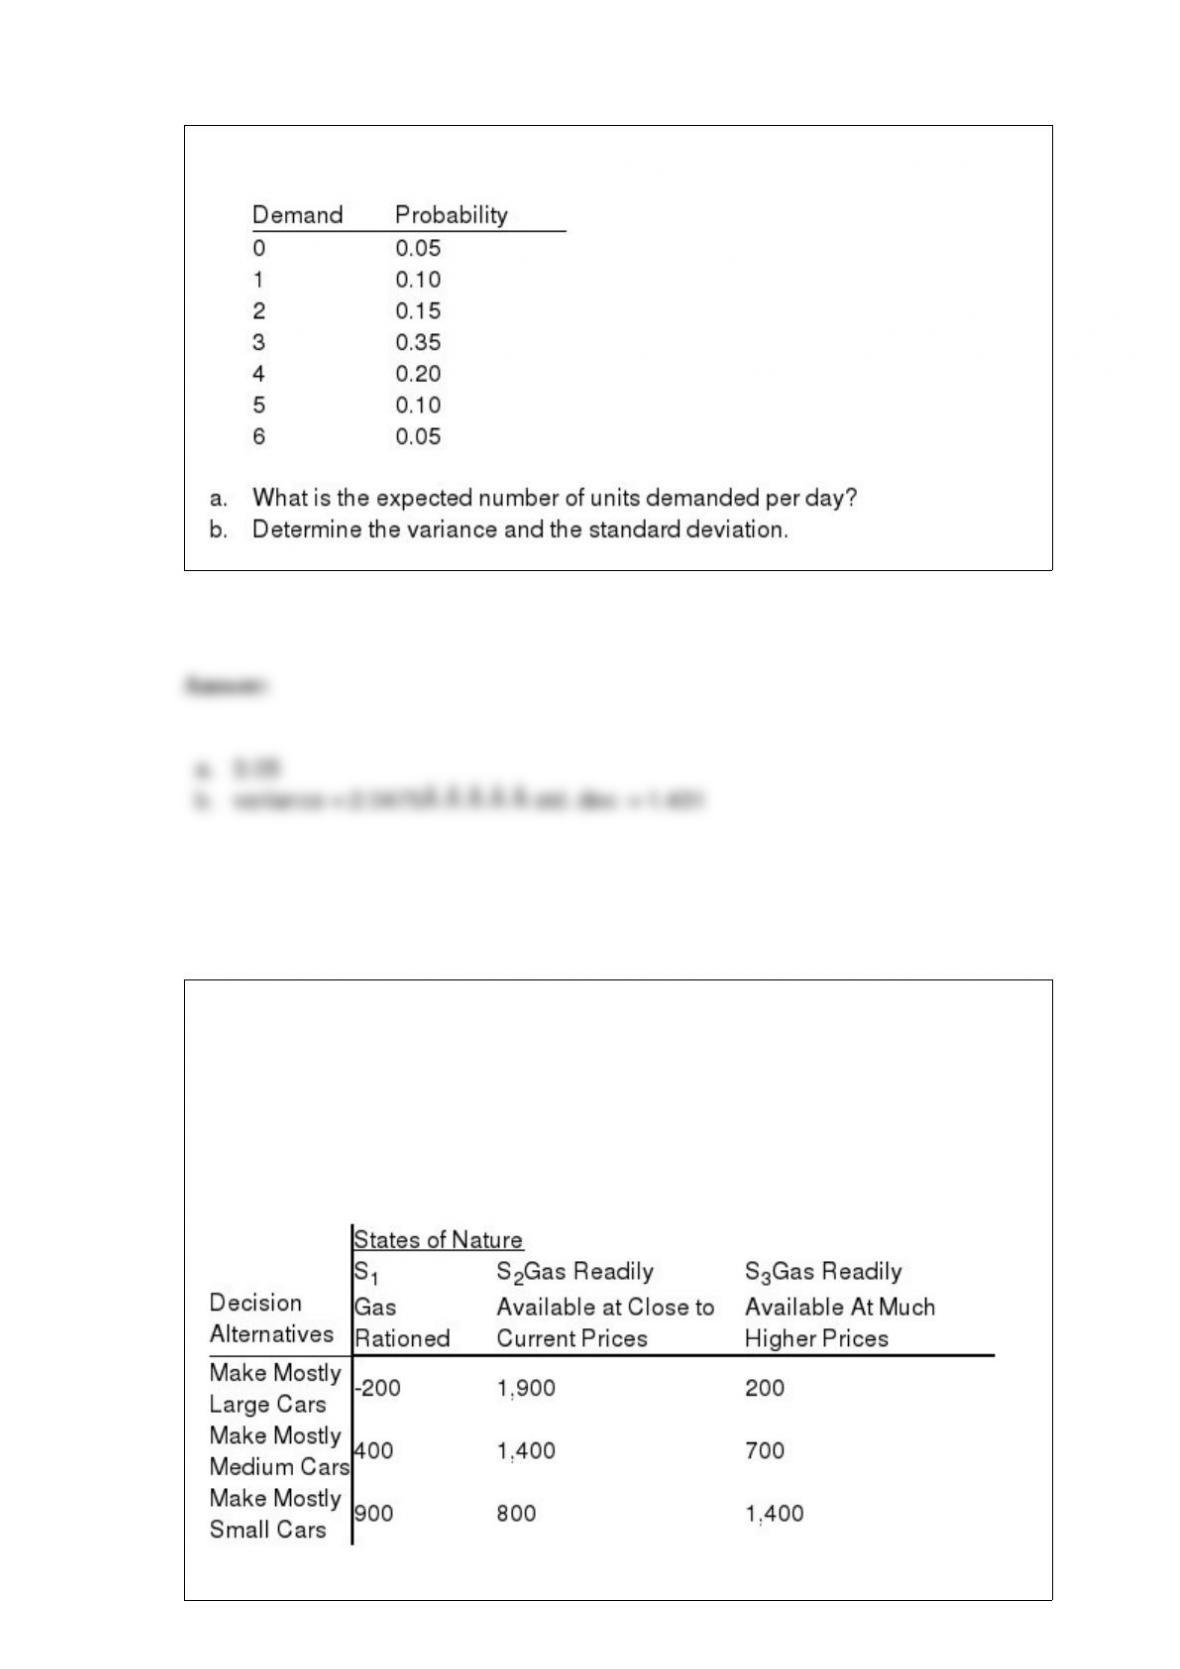
The probability distribution of the daily demand for a product is shown below.
An automobile manufacturer must make an immediate decision on the car size which
should account for the majority of the firm’s production two years from now. The firm
perceives three possible states of nature at that time: S1, gasoline will be rationed; S2,
gasoline will be readily available at close to current prices; and S3, gasoline will be
readily available, but at much higher prices. The firm has determined the following
profit payoff table (in $l,000s).
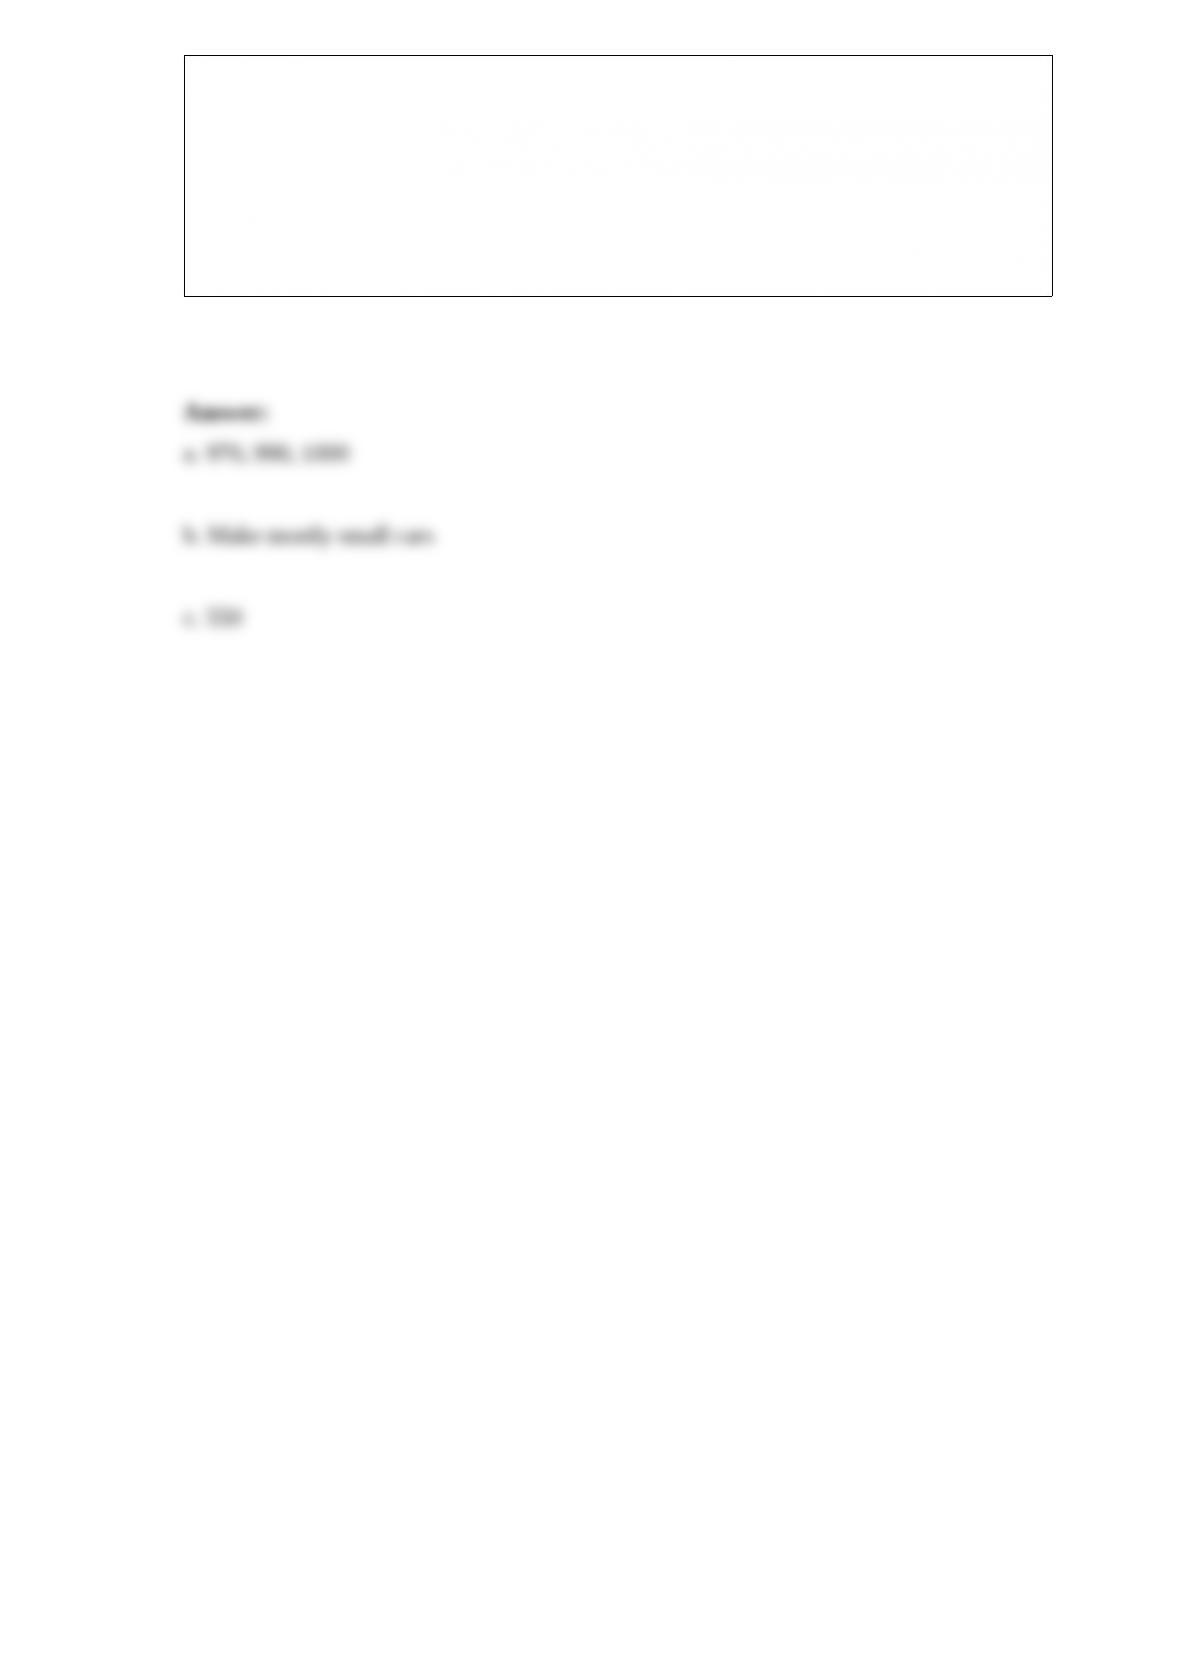
a. An economist at the auto company has advised the firm that the probabilities of the
states of nature are P(S1) = .2, P(S2) = .5, and P(S3) = .3. Find the expected value for
the three decisions.
b. Which decision should be chosen under the expected value criterion?
c. Determine the expected value of perfect information.