
Exhibit 10-5
The following information was obtained from matched samples.
Refer to Exhibit 10-5. The 95% confidence interval for the difference between the two
population means is
a. -3.776 to 1.776
b. -2.776 to 2.776
c. -1.776 to 2.776
d. 0 to 3.776
The sample space refers to
a. any particular experimental outcome
b. the sample size minus one
c. the set of all possible experimental outcomes
d. both any particular experimental outcome and the set of all possible experimental
outcomes are correct

Exhibit 5-8
The student body of a large university consists of 60% female students. A random
sample of 8 students is selected.
Refer to Exhibit 5-8. What is the probability that among the students in the sample at
least 6 are male?
a. 0.0413
b. 0.0079
c. 0.0007
d. 0.0499
Whenever using the t distribution in interval estimation, we must assume that the
a. sample size is less than 30
b. degrees of freedom equals n 1
c. population is approximately normal
d. finite population correction factor is necessary
Application of the least squares method results in values of the y intercept and the slope

that minimizes the sum of the squared deviations between the
a. observed values of the independent variable and the predicted values of the
independent variable
b. actual values of the independent variable and predicted values of the dependent
variable
c. observed values of the dependent variable and the predicted values of the dependent
variable
d. None of these answers is correct.
A regression analysis between sales (y in $1000) and advertising (x in dollars) resulted
in the following equation
50,000 + 6x
The above equation implies that an
a. increase of $6 in advertising is associated with an increase of $6,000 in sales
b. increase of $1 in advertising is associated with an increase of $6 in sales
c. increase of $1 in advertising is associated with an increase of $56,000 in sales
d. increase of $1 in advertising is associated with an increase of $6,000 in sales
Exhibit 2-3
The number of sick days taken (per month) by 200 factory workers is summarized

below.
Refer to Exhibit 2-3. The relative frequency of workers who took 10 or fewer sick days
a. was 185
b. was 0.925
c. was 93
d. was 15
Seventy percent of the students applying to a university are accepted. What is the
probability that among the next 18 applicants
a. At least 6 will be accepted?
b. Exactly 10 will be accepted?
c. Exactly 5 will be rejected?
d. Fifteen or more will be accepted?
e. Determine the expected number of acceptances.
f. Compute the standard deviation.

In a cumulative relative frequency distribution, the last class will have a cumulative
relative frequency equal to
a. one
b. zero
c. 100
d. None of the other answers are correct.
The smaller the p-value,
a. the greater the evidence against H0
b. the greater the chance of committing a Type II error
c. the greater the chance of committing a Type I error
d. the less likely you are to reject H0
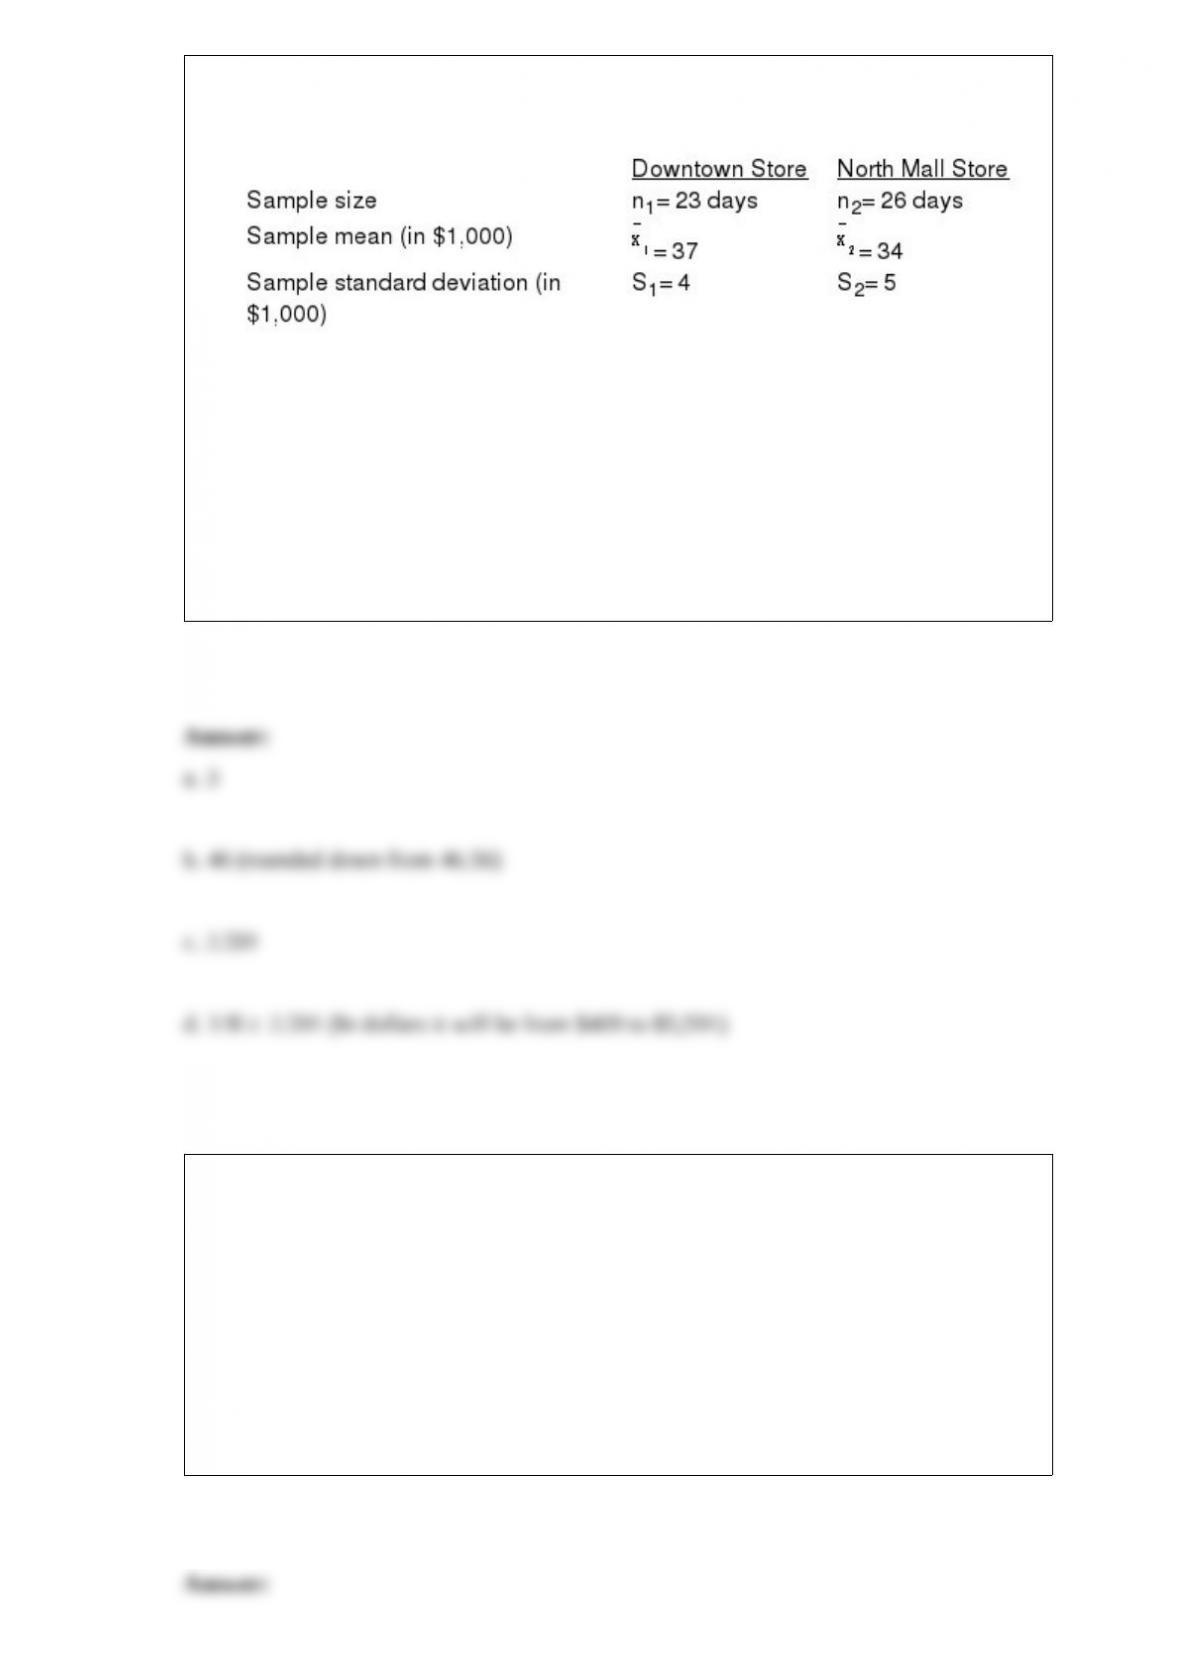
In order to estimate the difference between the average daily sales of two branches of a
department store, the following data has been gathered.
a. Determine the point estimate of the difference between the means.
b. Determine the degrees of freedom for this interval estimation.
c. Compute the margin of error.
d. Develop a 95% confidence interval for the difference between the two population
means.
When the data are labels or names used to identify an attribute of the elements and the
rank of the data is meaningful, the variable has which scale of measurement?
a. nominal
b. ordinal
c. interval
d. ratio

An important numerical measure of the shape of a distribution is the
a. correlation coefficient
b. variance
c. skewness
d. relative location
Which of the following statements about a discrete random variable and its probability
distribution are true?
a. Values of the random variable can never be negative.
b. Negative values of f(x) are allowed as long as f(x) 1.
c. Values of f(x) must be greater than or equal to zero.
d. The values of f(x) increase to a maximum point and then decrease.
If A and B are independent events with P(A) 0.4 and P(B) 0.25, then P(A ˆ B)
a. 0.65
b. 0.55

c. 0.10
d. Not enough information is given to answer this question.