Excel’s POISSON.DIST function has how many inputs?
a. 2
b. 3
c. 4
d. 5
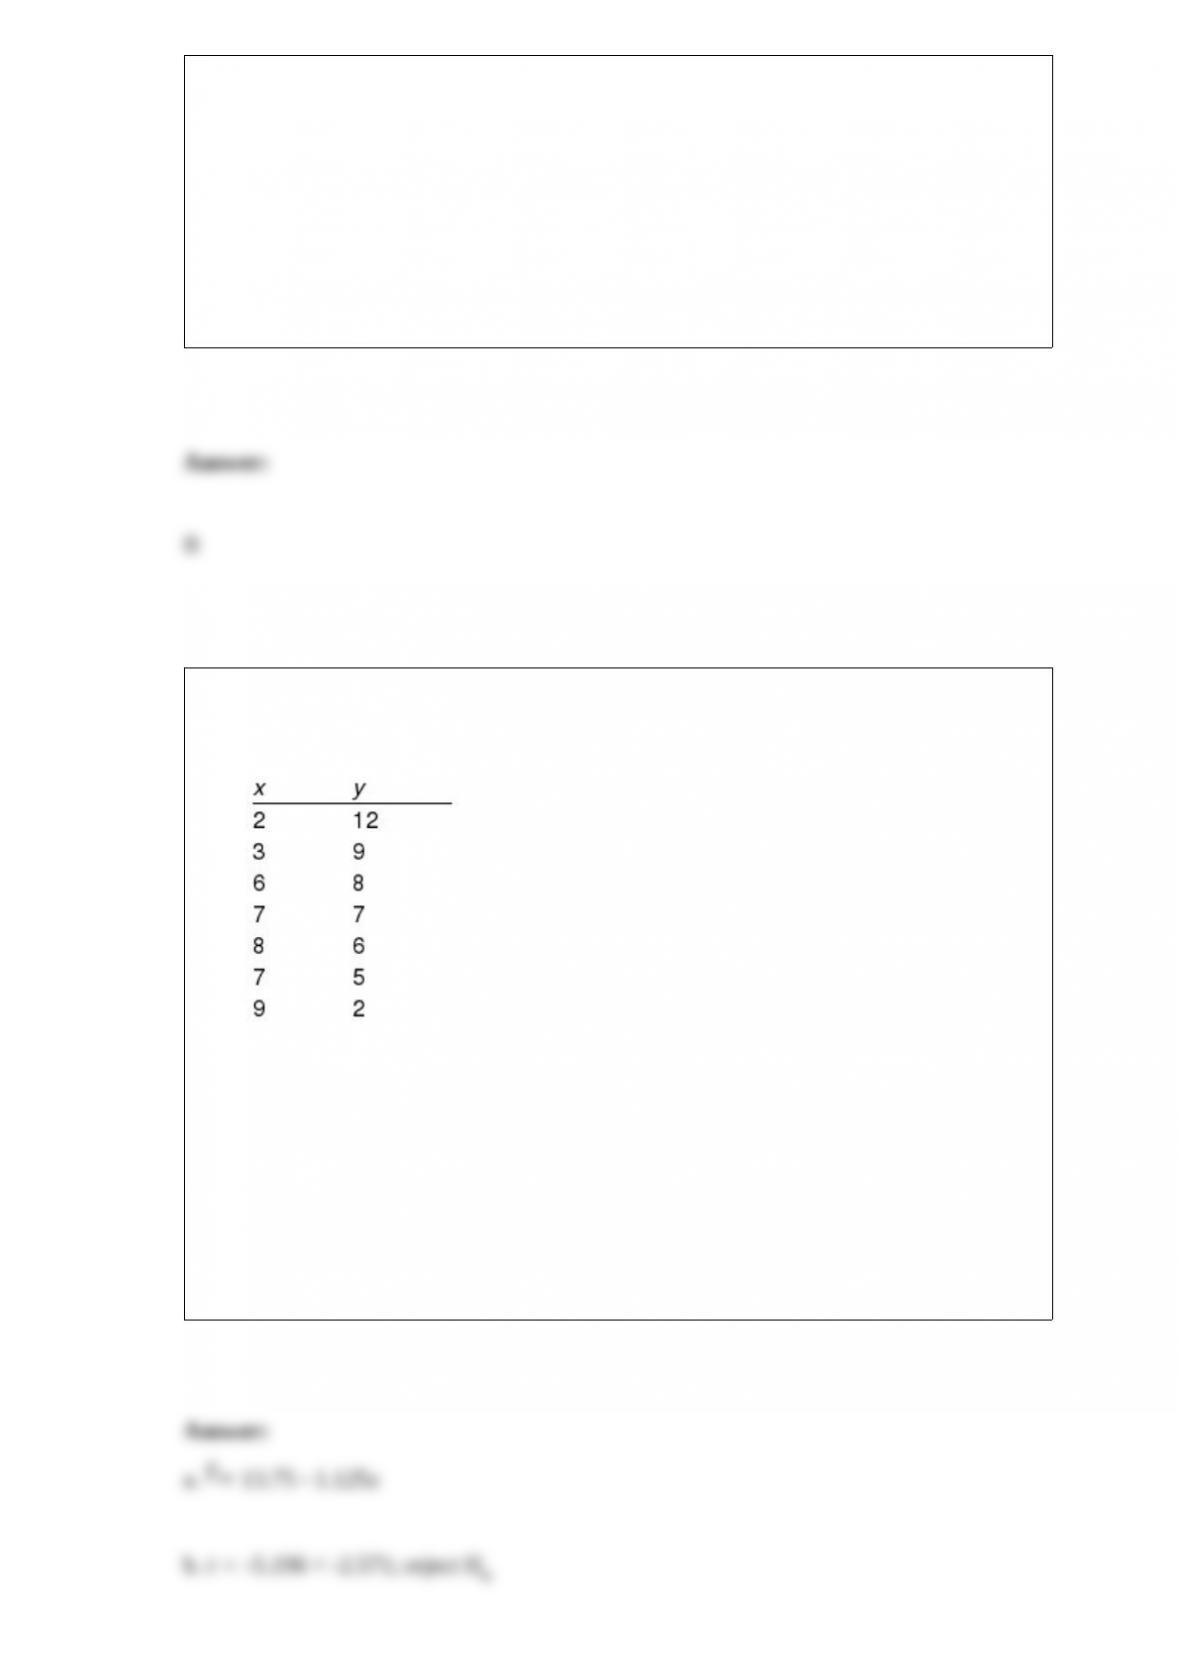
Given below are seven observations collected in a regression study on two variables, x
(independent variable) and y (dependent variable).
a. Develop the least squares estimated regression equation.
b. At 95% confidence, perform a t test and determine whether or not the slope is
significantly different from zero.
c. Perform an F test to determine whether or not the model is significant. Let 0.05.
d. Compute the coefficient of determination.

A simple random sample of 5 observations from a population containing 400 elements
was taken, and the following values were obtained.
A point estimate of the population mean is
a. 5
b. 18
c. 19
d. 20
Exhibit 7-1
The following data was collected from a simple random sample from a process (an
infinite population).
Refer to Exhibit 7-1. The mean of the population
a. is 14
b. is 15
c. is 15.1581
d. could be any value

In a five-number summary, which of the following is not used for data summarization?
a. the smallest value
b. the largest value
c. the median
d. the mean
The producer of a certain bottling equipment claims that the variance of all their filled
bottles is 0.027 or less. A sample of 30 bottles showed a standard deviation of 0.2. The
p-value for the test is
a. between 0.025 and 0.05
b. between 0.05 and 0.01
c. 0.05
d. 0.025
Events A and B are mutually exclusive with P(A) 0.3 and P(B) 0.2. The probability
of the complement of Event B equals
a. 0.00
b. 0.06
c. 0.7
d. None of the other answers is correct.
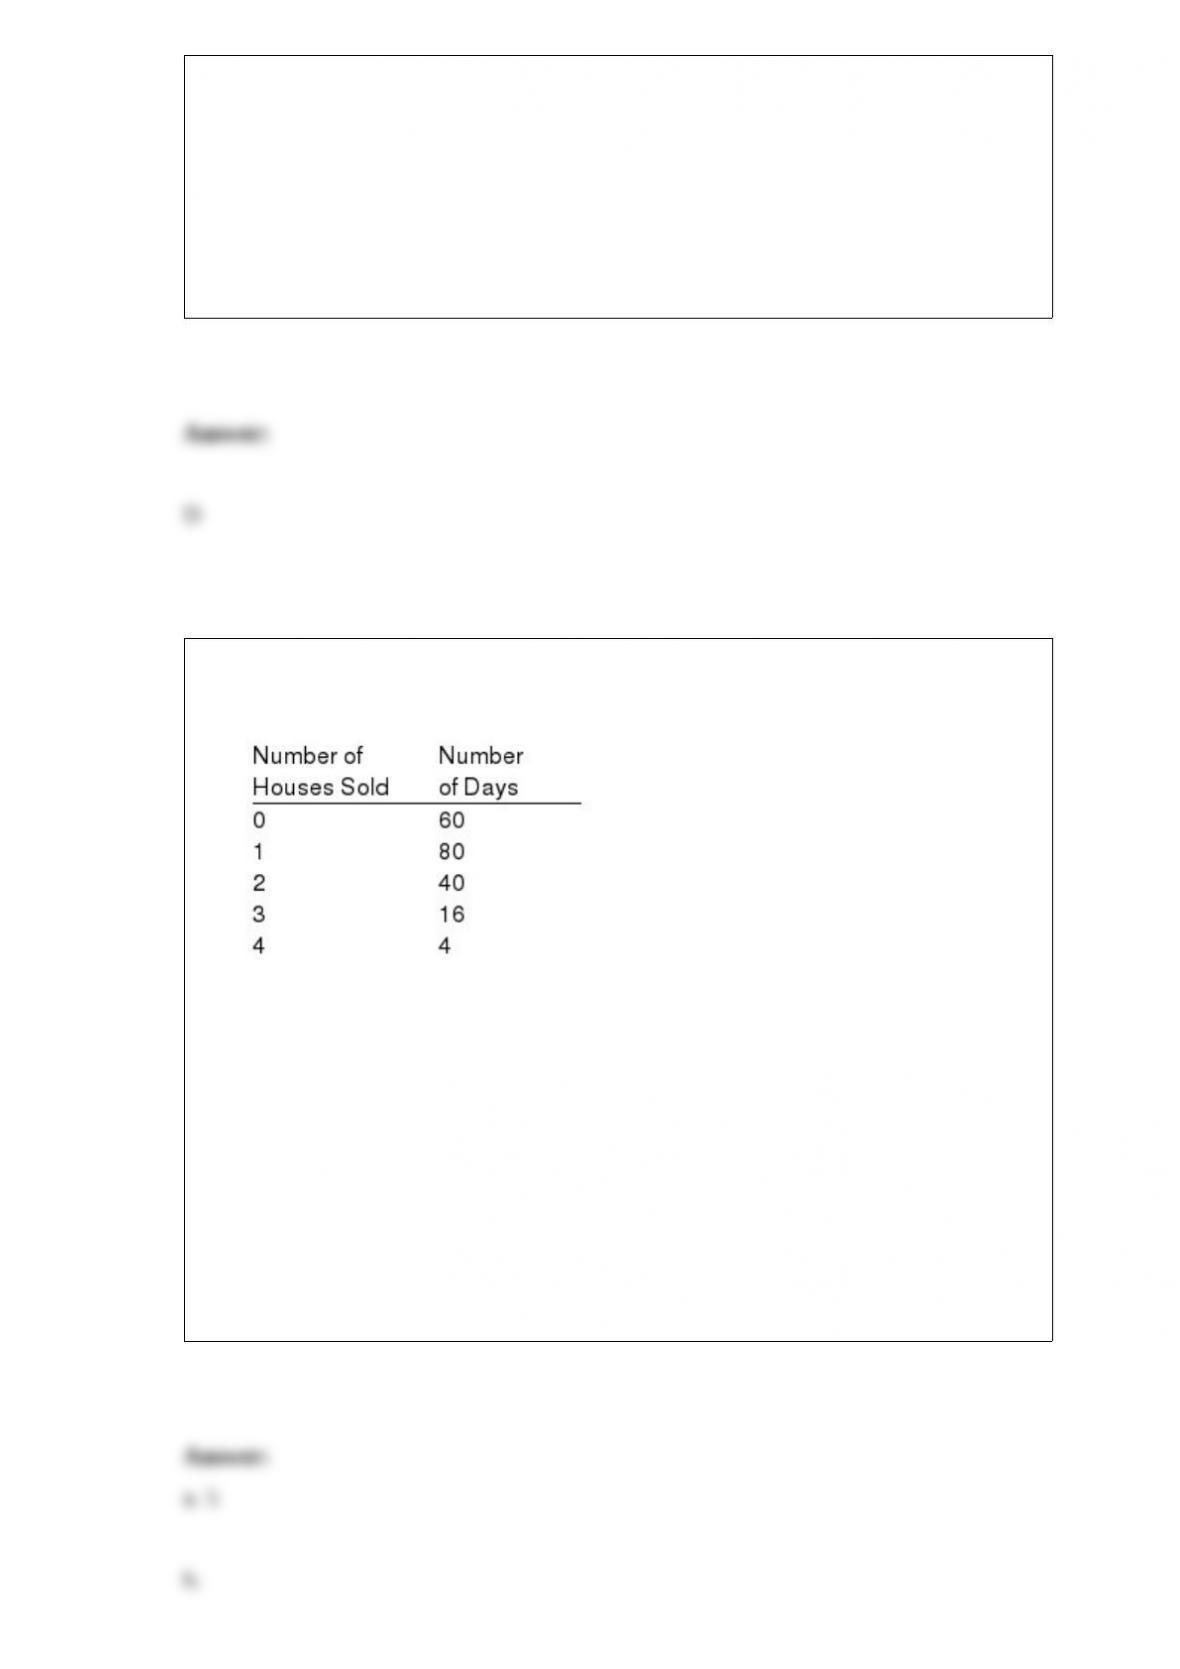
The sales records of a real estate agency show the following sales over the past 200
days:
a. How many sample points are there?
b. Assign probabilities to the sample points and show their values.
c. What is the probability that the agency will not sell any houses in a given day?
d. What is the probability of selling at least 2 houses?
e. What is the probability of selling 1 or 2 houses?
f. What is the probability of selling less than 3 houses?

Two events, A and B, are mutually exclusive and each has a nonzero probability. If
event A is known to occur, the probability of the occurrence of event B is
a. one
b. any positive value
c. zero
d. any value between 0 to 1
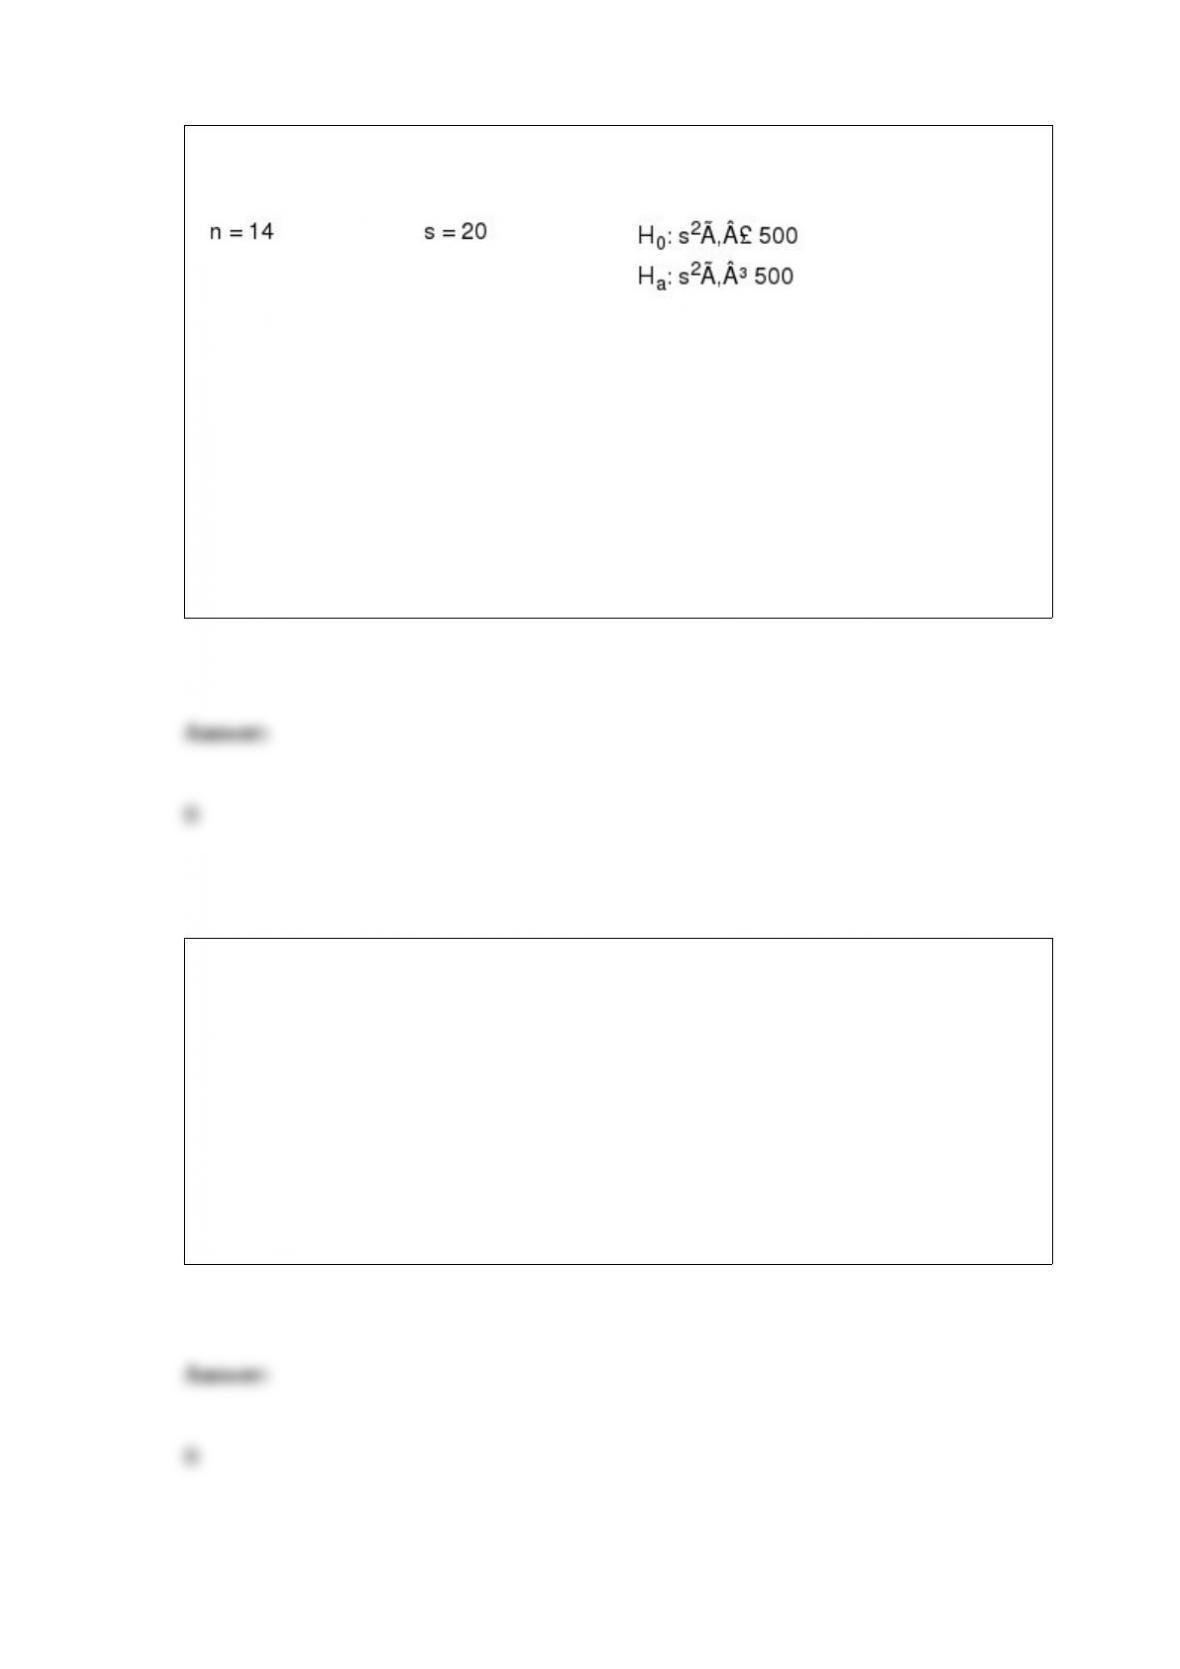
Exhibit 11-9
Refer to Exhibit 11-9. The test statistic for this problem equals
a. .63
b. 12.68
c. 13.33
d. 13.66
When using Excel to calculate a p-value for an upper-tail hypothesis test, the following
must be used
a. RAND
b. 1 NORM.S.DIST
c. NORM.S.DIST
d. Not enough information is given to answer this question.

Exhibit 21-2
A simple random sample of 43 elements has been selected from a population of size
800. The sample mean is 500, and the sample standard deviation is 60.
Refer to Exhibit 21-2. An approximate 95% confidence interval for the population mean
is
a. 482.2 to 517.8
b. 440.0 to 560.0
c. 500.0 to 560.0
d. 440.0 to 500.0
In developing an interval estimate of the population mean, if the population standard
deviation is unknown
a. it is impossible to develop an interval estimate
b. a sample proportion can be used
c. the sample standard deviation and t distribution can be used
d. None of the other answers are correct.
Exhibit 13-6
Part of an ANOVA table is shown below.

Refer to Exhibit 13-6. The mean square between treatments (MSTR) is
a. 36
b. 16
c. 64
d. 15
The owner of a factory regularly requests a graphical summary of all employees’
salaries. The graphical summary of salaries is an example of
a. a sample
b. descriptive statistics
c. statistical inference
d. an experiment
In a regression analysis if SSE 200 and SSR 300, then the coefficient of
determination is
a. 0.6667
b. 0.6000
c. 0.4000
d. 1.5000
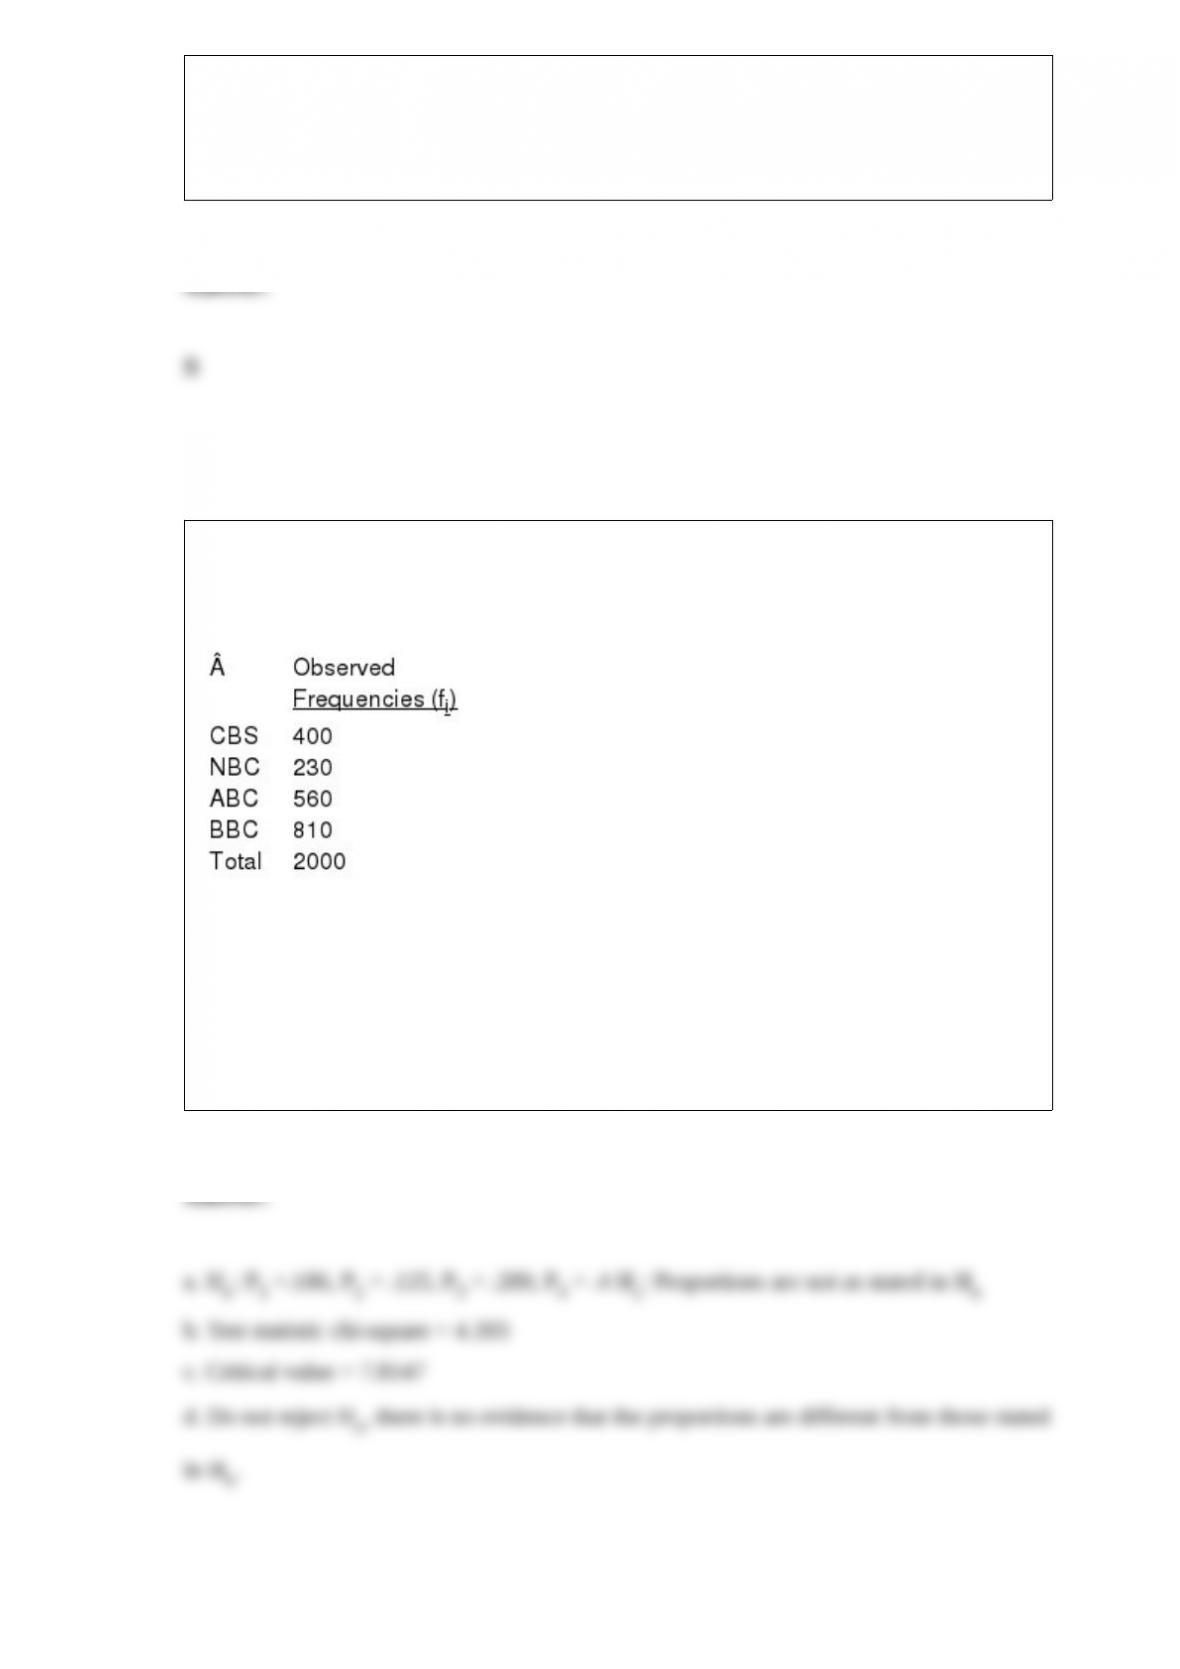
Prior to the start of the season, it was expected that audience proportions for the four
major news networks would be CBS 18.6%, NBC 12.5%, ABC 9% and BBC 40%. A
recent sample of homes yielded the following viewing audience data.
We want to determine whether or not the recent sample supports the expectations of the
number of homes of the viewing audience of the four networks.
a. State the null and alternative hypotheses to be tested.
b. Compute the test statistic.
c. The null hypothesis is to be tested at 95% confidence. Determine the critical value for
this test.
d. What do you conclude?

Exhibit 21-4
Simple random sampling has been used to obtain a sample of size 50 from a population
of size 500. The sample proportion was 0.7.
Refer to Exhibit 21-4. The estimate of the standard error of proportion is
a. 0.210
b. 0.700
c. 0.300
d. 0.062
When the data have the properties of ordinal data and the interval between observations
is expressed in terms of a fixed unit of measure, the variable has which scale of
measurement?
a. nominal
b. ordinal
c. interval
d. ratio

Exhibit 16-4
In a laboratory experiment, data were gathered on the life span (y in months) of 33 rats,
units of daily protein intake (x1), and whether or not agent x2 (a proposed life extending
agent) was added to the rats diet (x2 = 0 if agent x2 was not added, and x2 = 1 if agent
was added.) From the results of the experiment, the following regression model was
developed.
= 36 + 0.8x1 – 1.7x2
Also provided are SSR = 60 and SST = 180.
Refer to Exhibit 16-4. The multiple coefficient of determination is
a. 0.2
b. 0.5
c. 0.333
d. 5
Tony Zamora, a real estate investor, has just moved to Clarksville and wants to learn
about the local real estate market. He wants to understand, for example, the relationship
between geographical segment of the city and selling price of a house, the relationship
between selling price and number of bedrooms, and so on. Tony has randomly selected
25 house-for-sale listings from the Sunday newspaper and collected the data listed
below.
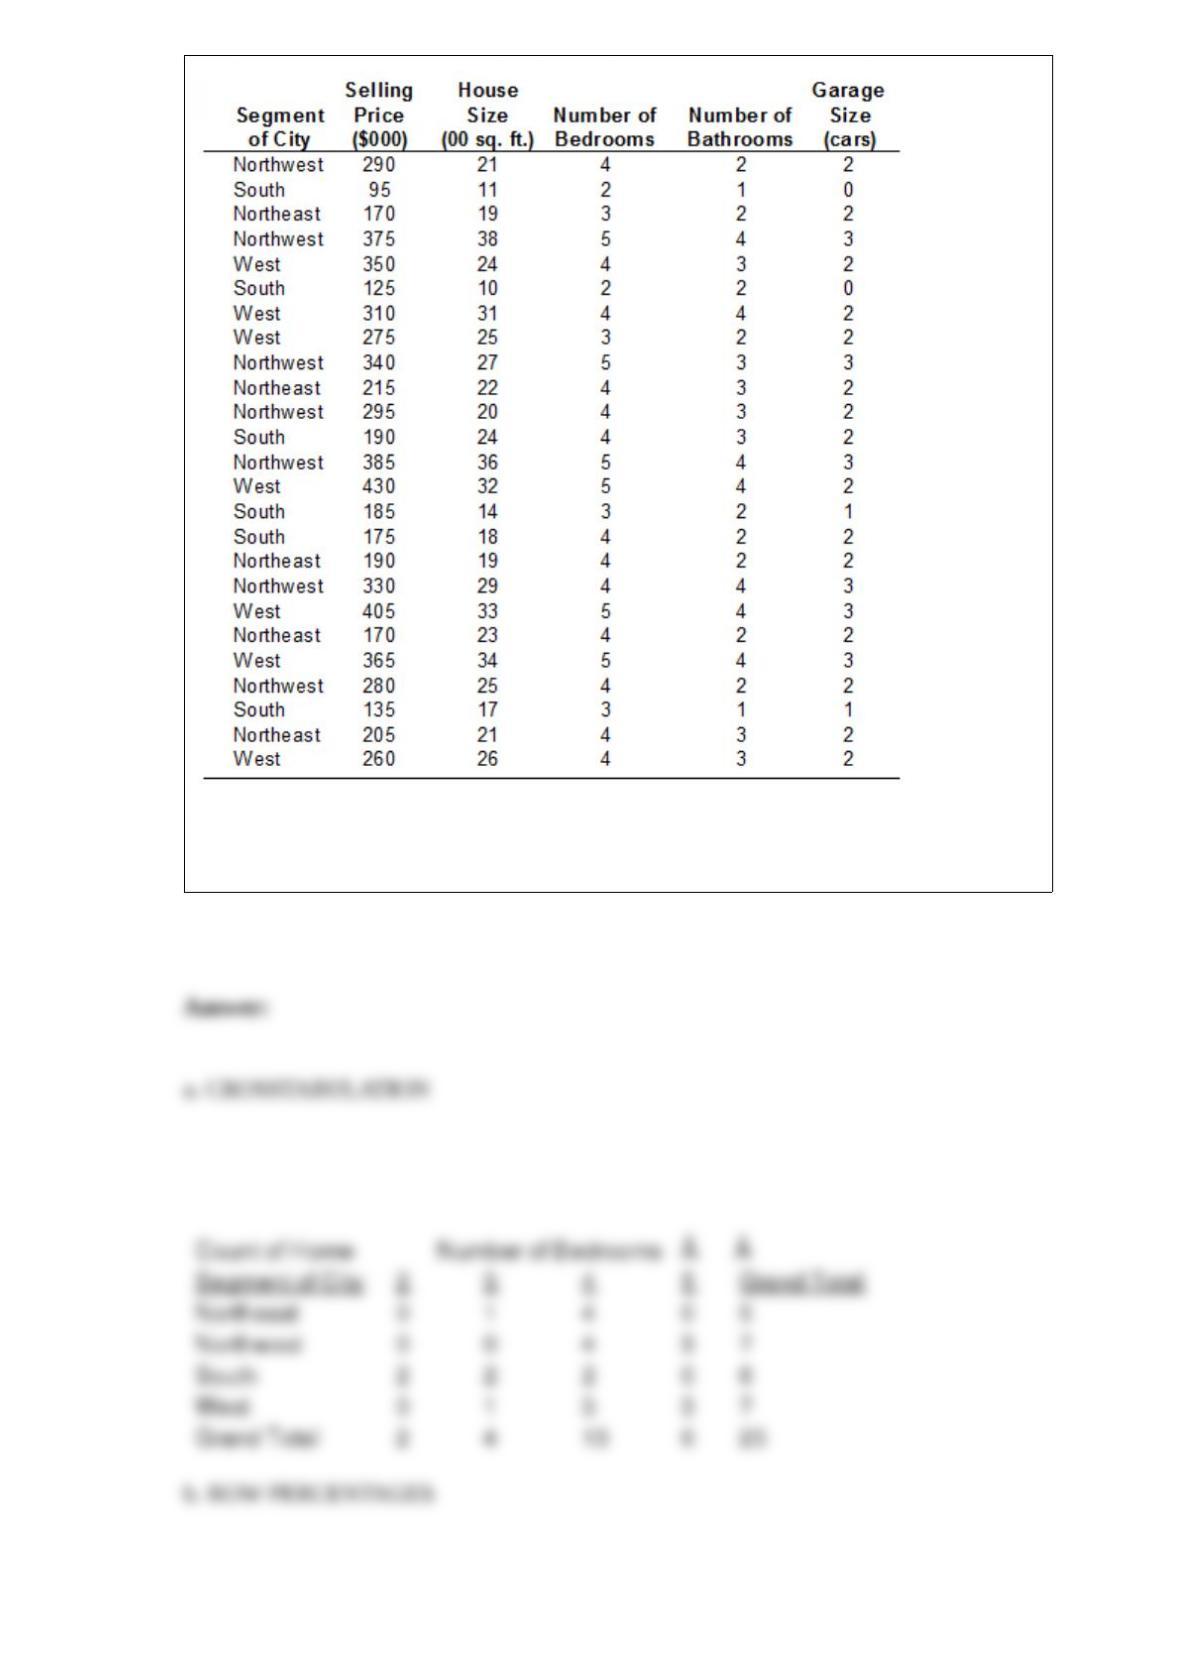
a. Construct a crosstabulation for the variables segment of city and number of bedrooms.
b. Compute the row percentages for your crosstabulation in part (a).
c. Comment on any apparent relationship between the variables.

The set of measurements collected for a particular element is (are) called
a. census
b. variables
c. observations
d. samples
The probability function for the number of insurance policies John will sell to a
customer is given by
f(x) .5 (x/6) for x 0, 1, or 2
a. Is this a valid probability function? Explain your answer.
b. What is the probability that John will sell exactly 2 policies to a customer?
c. What is the probability that John will sell at least 2 policies to a customer?
d. What is the expected number of policies John will sell?
e. What is the variance of the number of policies John will sell?