
Exhibit 15-2
A regression model between sales (y in $1,000), unit price (x1 in dollars) and television
advertisement (x2 in dollars) resulted in the following function:
= 7 – 3x1 + 5x2
For this model SSR = 3500, SSE = 1500, and the sample size is 18.
Refer to Exhibit 15-2. The coefficient of the unit price indicates that if the unit price is
a. increased by $1 (holding advertising constant), sales are expected to increase by $3
b. decreased by $1 (holding advertising constant), sales are expected to decrease by $3
c. increased by $1 (holding advertising constant), sales are expected to increase by
$4,000
d. increased by $1 (holding advertising constant), sales are expected to decrease by
$3,000
In a multiple regression model, the variance of the error term is assumed to be
a. the same for all values of the dependent variable
b. zero
c. the same for all values of the independent variable
d. -1

Exhibit 21-1
A simple random sample of size 64 is taken from a population of size 800. The sample
mean is determined to be 2,550 with a standard deviation of 500.
Refer to Exhibit 21-1. The point estimate of the population total is
a. 51,200
b. 1,275,000
c. 102,000
d. 2,040,000
The average gasoline price of one of the major oil companies has been $3.00 per gallon.
Because of shortages in production of crude oil, it is believed that there has been a
significant increase in the average price. In order to test this belief, we randomly
selected a sample of 36 of the company’s gas stations and determined that the average
price for the stations in the sample was $3.06. Assume that the standard deviation of the
population () is $0.09.
a. State the null and the alternative hypotheses.
b. Test the claim at .05.
c. What is the p-value associated with the above sample results?
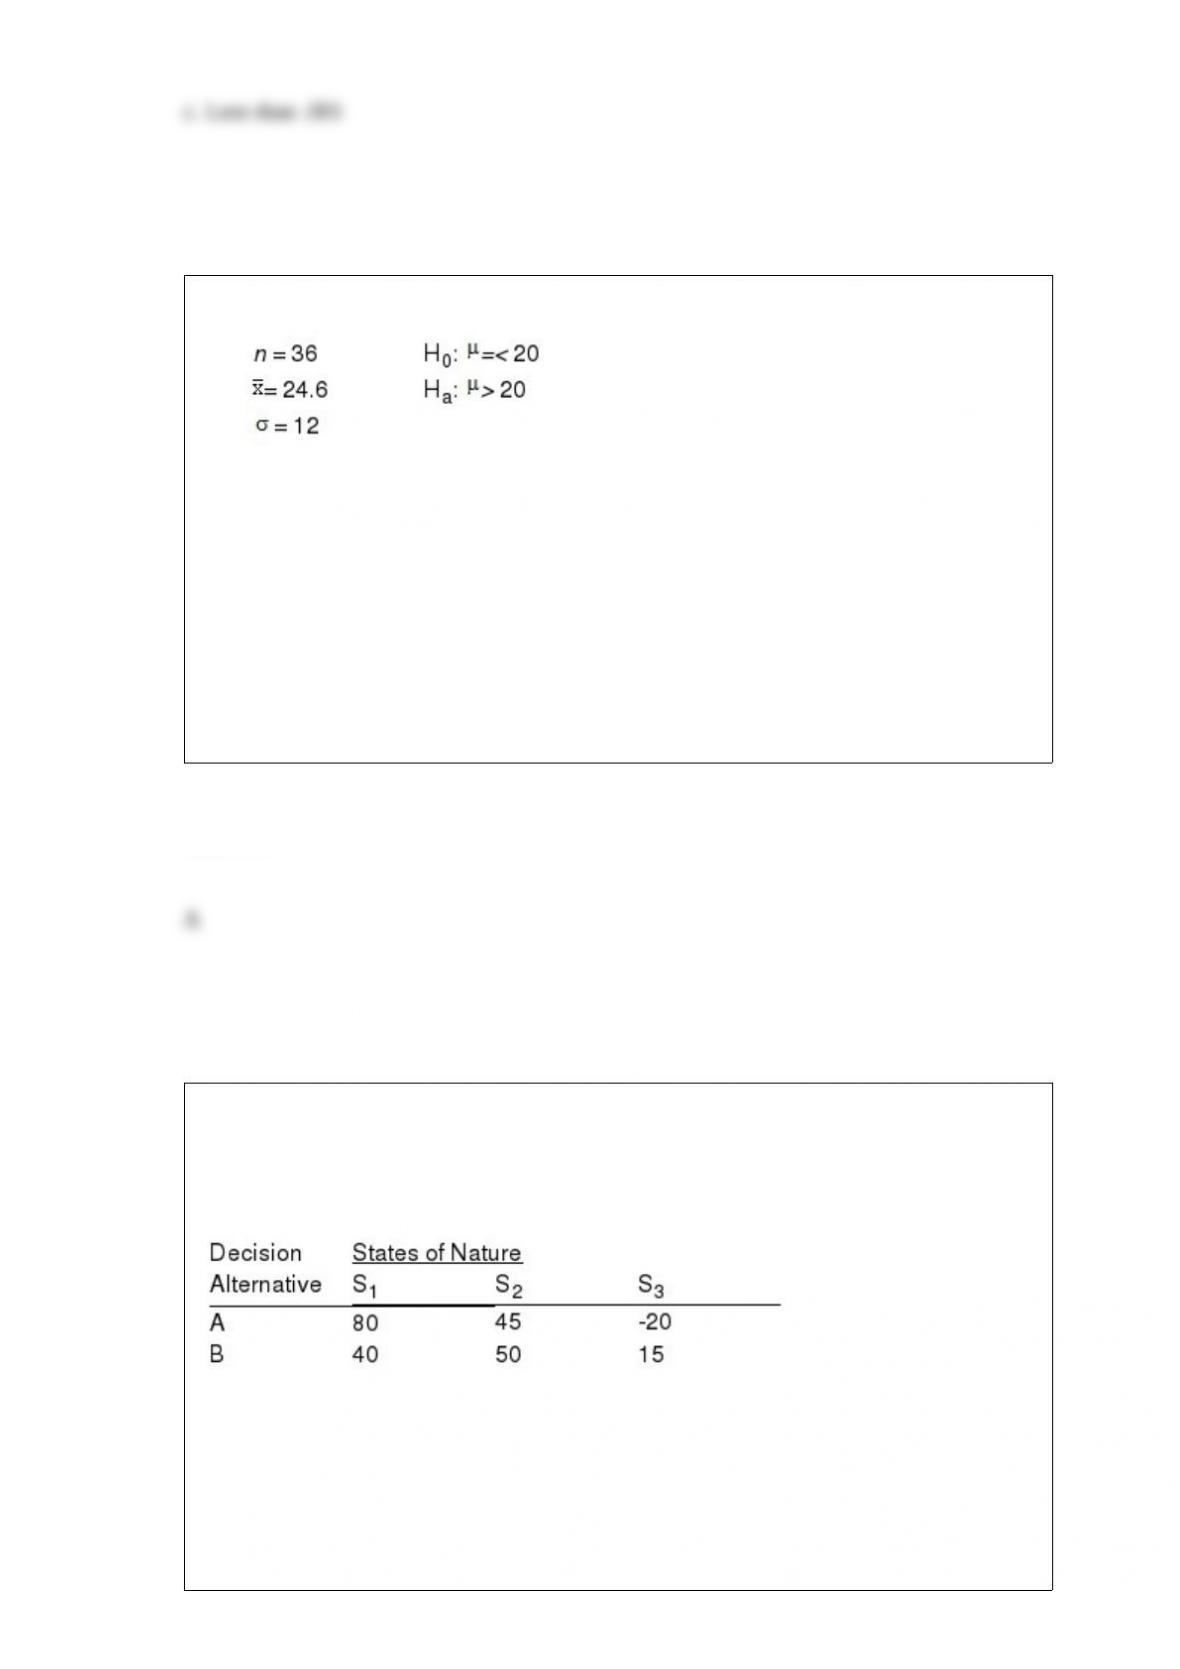
Exhibit 9-1
Refer to Exhibit 9-1. The test statistic equals
a. 2.3
b. 0.38
c. -2.3
d. -0.38
Exhibit 20-2
Below you are given a payoff table involving three states of nature and two decision
alternatives.
The probability that S1 will occur is 0.1; the probability that S2 will occur is 0.6; and
the probability that S3 will occur is 0.3.
Refer to Exhibit 20-2. The expected value of perfect information equals
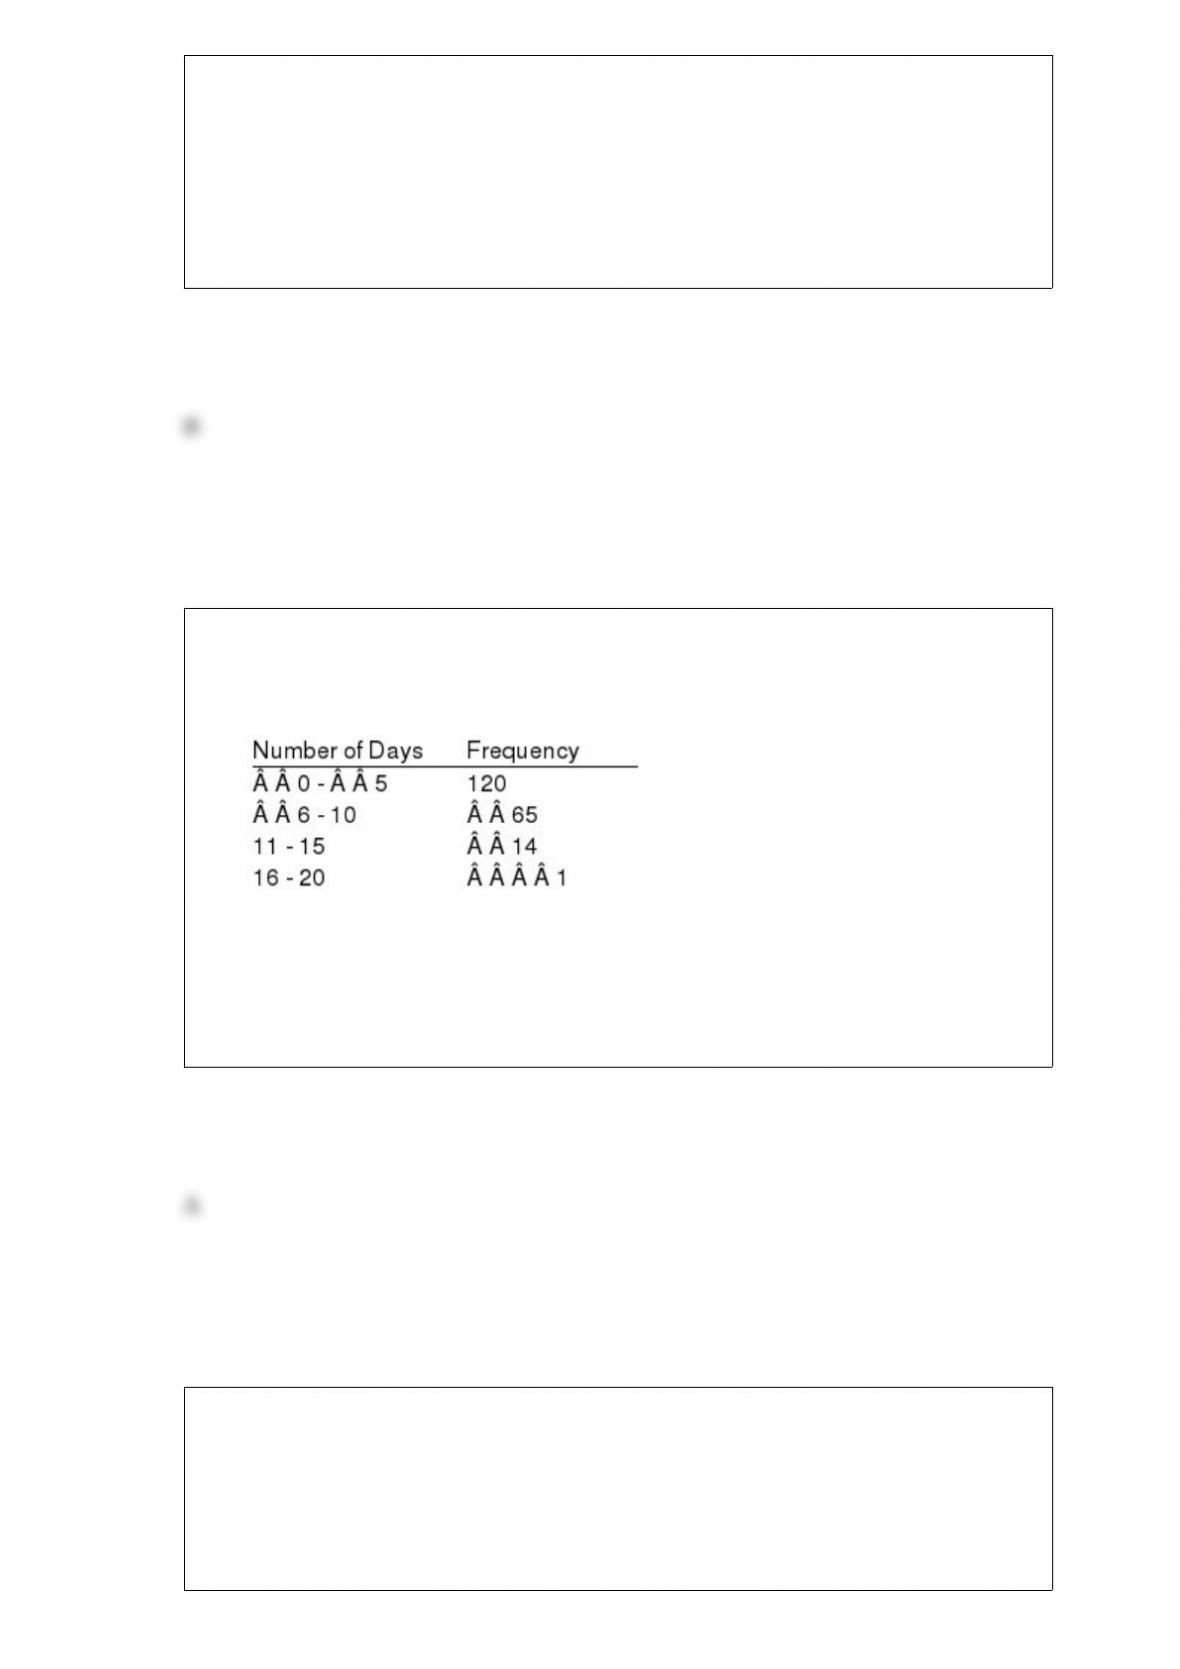
a. 12
b. 4
c. 37
d. 29
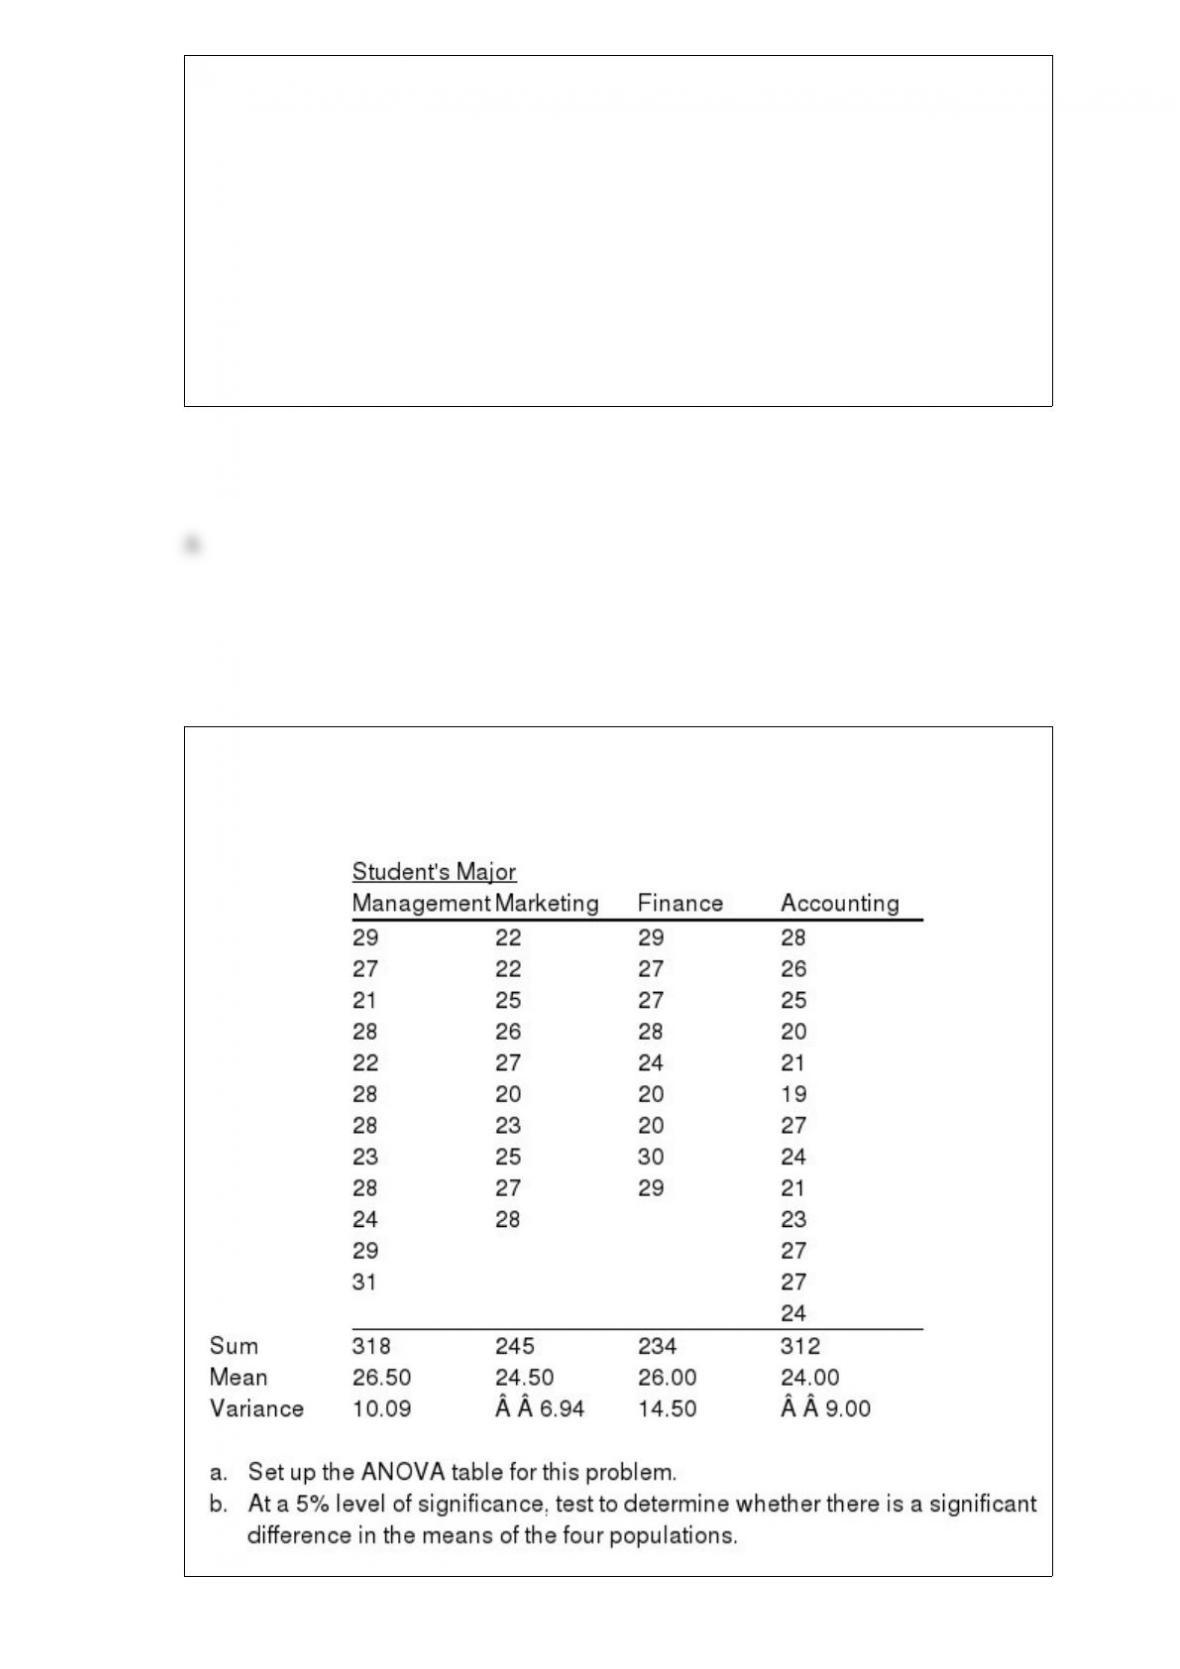
Exhibit 2-3
The number of sick days taken (per month) by 200 factory workers is summarized
below.
Refer to Exhibit 2-3. The number of workers who took at least 11 sick days per month
a. was 15
b. was 200
c. was 185
d. was 65
Exhibit 5-11
The random variable x is the number of occurrences of an event over an interval of ten
minutes. It can be assumed that the probability of an occurrence is the same in any two
time periods of an equal length. It is known that the mean number of occurrences in ten
minutes is 5.3.
Refer to Exhibit 5-11. The appropriate probability distribution for the random variable
is
a. discrete
b. continuous
c. either a or b depending on how the interval is defined
d. not enough information is given
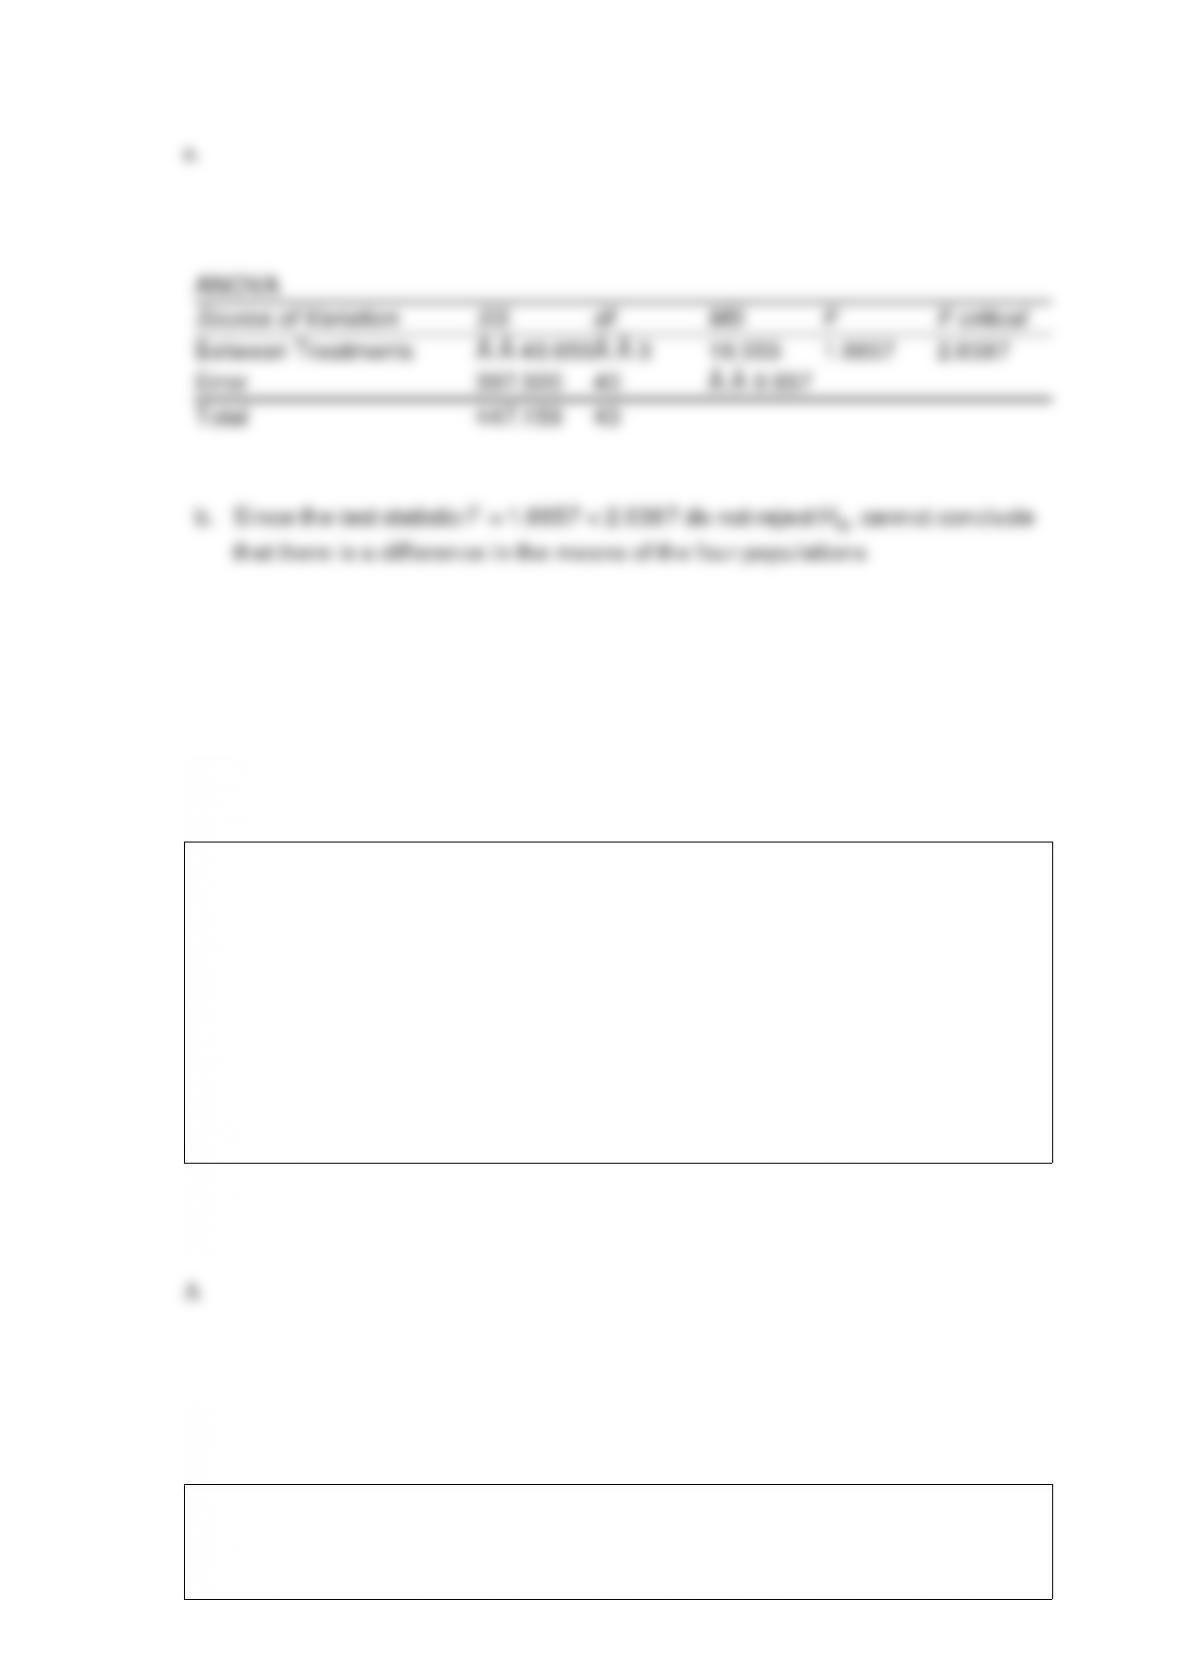
Information regarding the ACT scores of samples of students in four different majors
are given below.
The forecasting method that is appropriate when the time series has no significant trend,
cyclical, or seasonal effect is
a. moving averages
b. mean squared error
c. mean average deviation
d. qualitative forecasting methods
Exhibit 5-6
Probability Distribution

Refer to Exhibit 5-6. The variance of x equals
a. 9.165
b. 84
c. 85
d. 93.33
Exhibit 15-8
The following estimated regression model was developed relating yearly income (y in
$1,000s) of 30 individuals with their age (x1) and their gender (x2) (0 if male and 1 if
female).
= 30 + 0.7x1 + 3x2
Also provided are SST = 1,200 and SSE = 384.
Refer to Exhibit 15-8. From the above function, it can be said that the expected yearly
income of
a. males is $3 more than females
b. females is $3 more than males
c. males is $3,000 more than females
d. females is $3,000 more than males
A random variable x is uniformly distributed between 45 and 150.
a. Determine the probability of x 48.
b. What is the probability of x 60?
c. What is the probability of x 50?
d. Determine the expected vale of x and its standard deviation.
A production process that is in control has a mean () of 80 and a standard deviation ()
of 10.

In regression and correlation analysis, if SSE and SST are known, then with this
information the
a. coefficient of determination can be computed
b. slope of the line can be computed
c. y intercept can be computed
d. All of the above can be computed.
In determining the sample size necessary to estimate a population proportion, which of
the following information is not needed?
a. the maximum margin of error that can be tolerated
b. the confidence level required
c. a preliminary estimate of the true population proportion p
d. the mean of the population
Excel’s __________ function can be used to compute the sample standard deviation.
a. MAX
b. MODE

c. VAR
d. STDEV
For the Wilcoxon signed-rank test, ties among absolute differences are assigned the
a. lowest of their ranks
b. average of their ranks
c. highest of their ranks
d. sum of their ranks
On a December day, the probability of snow is .30. The probability of a “cold” day is .
50. The probability of snow and a “cold” day is .15. Are snow and “cold” weather
independent events?
a. only if given that it snowed
b. no
c. yes
d. only when they are also mutually exclusive