Unlock document.
This document is partially blurred.
Unlock all pages and 1 million more documents.
Get Access
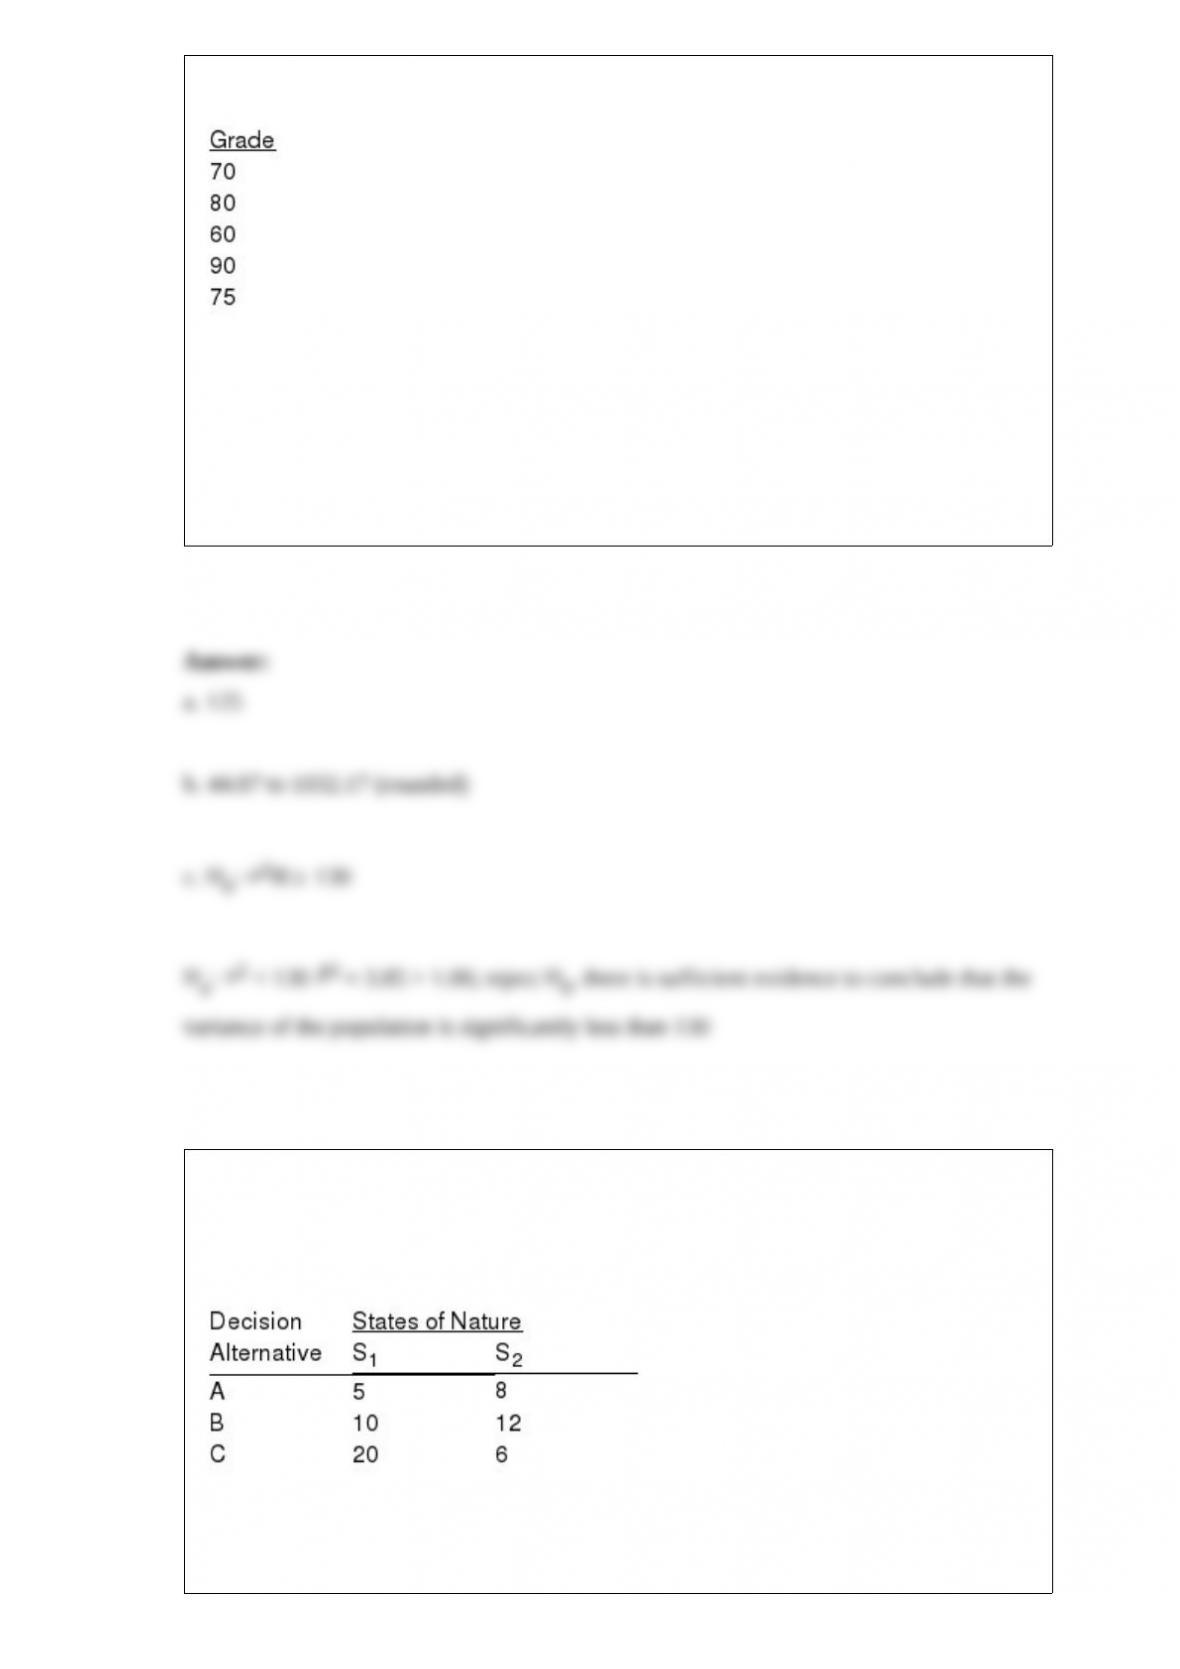
The grades of a sample of 5 students, selected from a large population, are given below.
a. Determine a point estimate for the variance of the population.
b. Determine a 95% confidence interval for the variance of the population.
c. At 90% confidence, test to determine if the variance of the population is significantly
less than 130.
Exhibit 20-1
Below you are given a payoff table involving two states of nature and three decision
alternatives.
The probability of occurrence of S1 = 0.2.
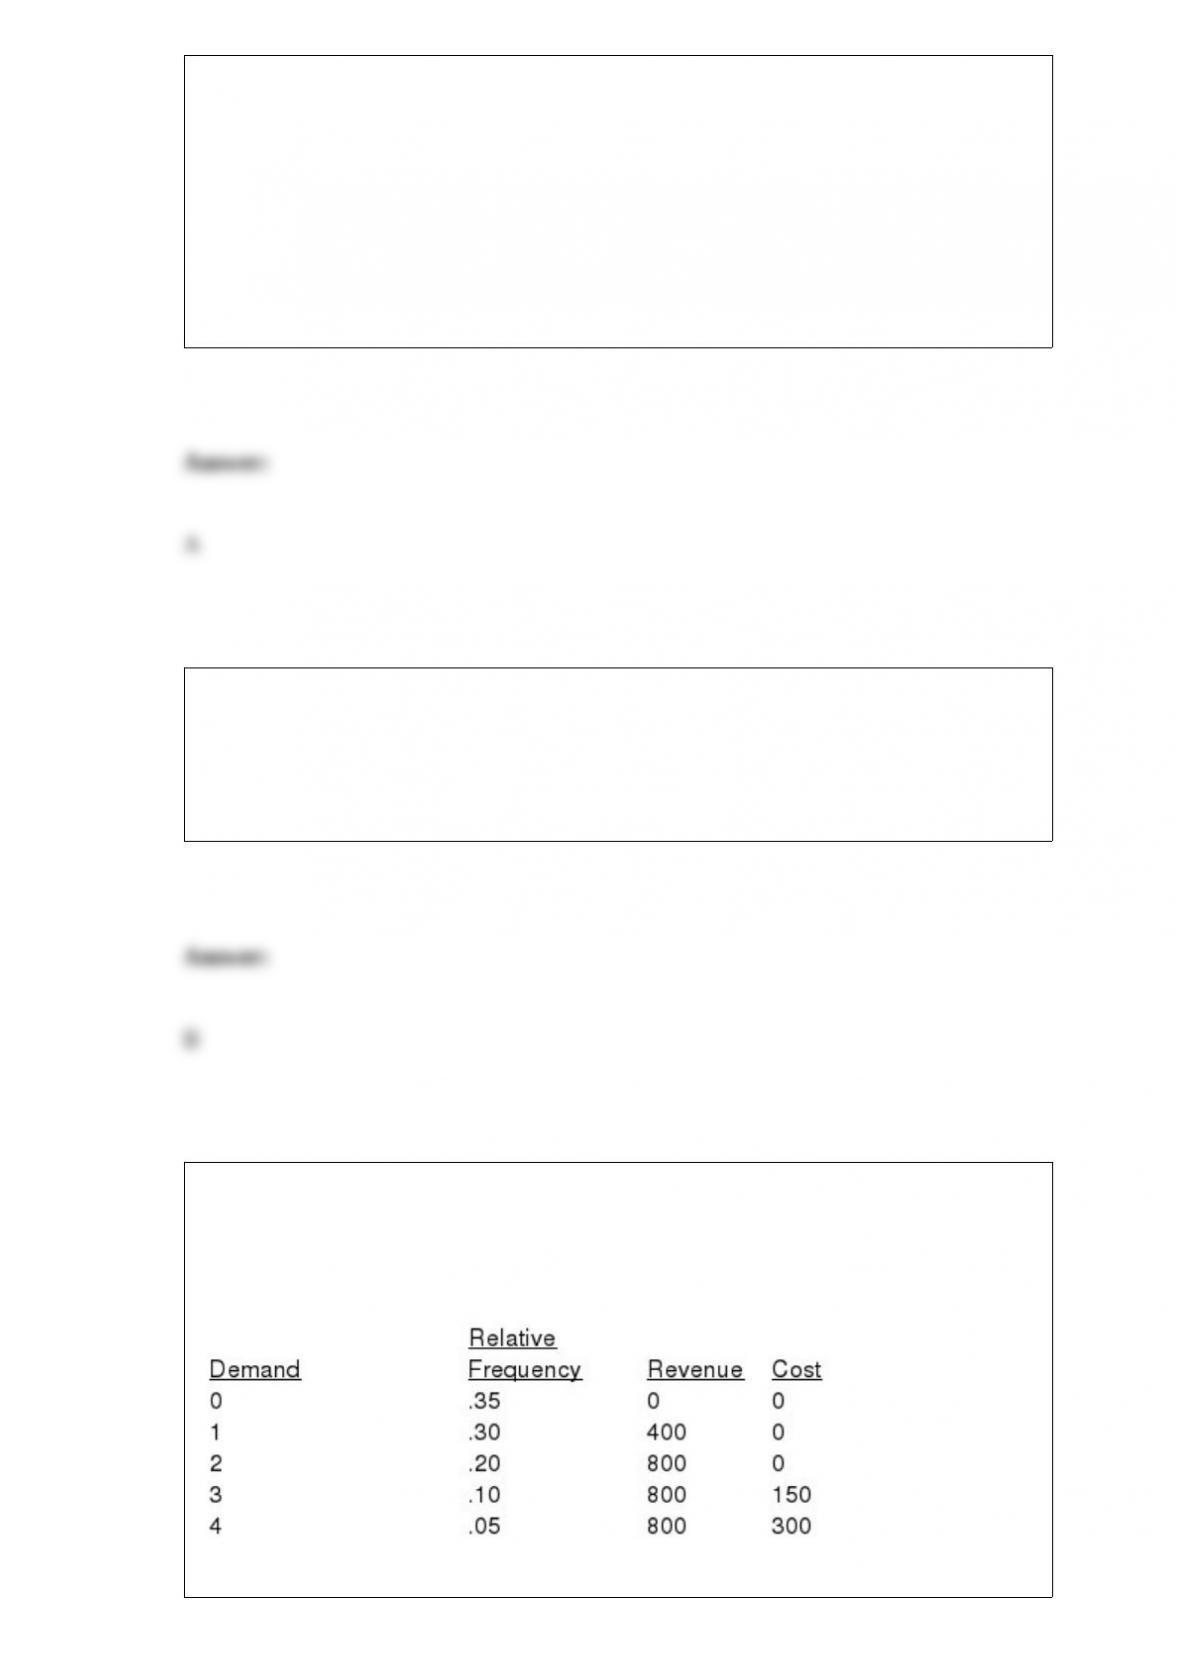
Refer to Exhibit 20-1. The expected value of alternative A is
a. 7.4
b. 11.6
c. 8.8
d. 13
The coefficient of determination is equal to the
a. absolute value of the correlation coefficient
b. squared value of the correlation coefficient
c. square-root of the correlation coefficient
d. inverse value of the correlation coefficient
A marina has two party boats available for customers to rent. Historically, demand for
party boats has followed this distribution shown below. The revenue per rental is $400.
If a customer wants a party boat and none is available, the store gives a $150 coupon
for jet ski rental.
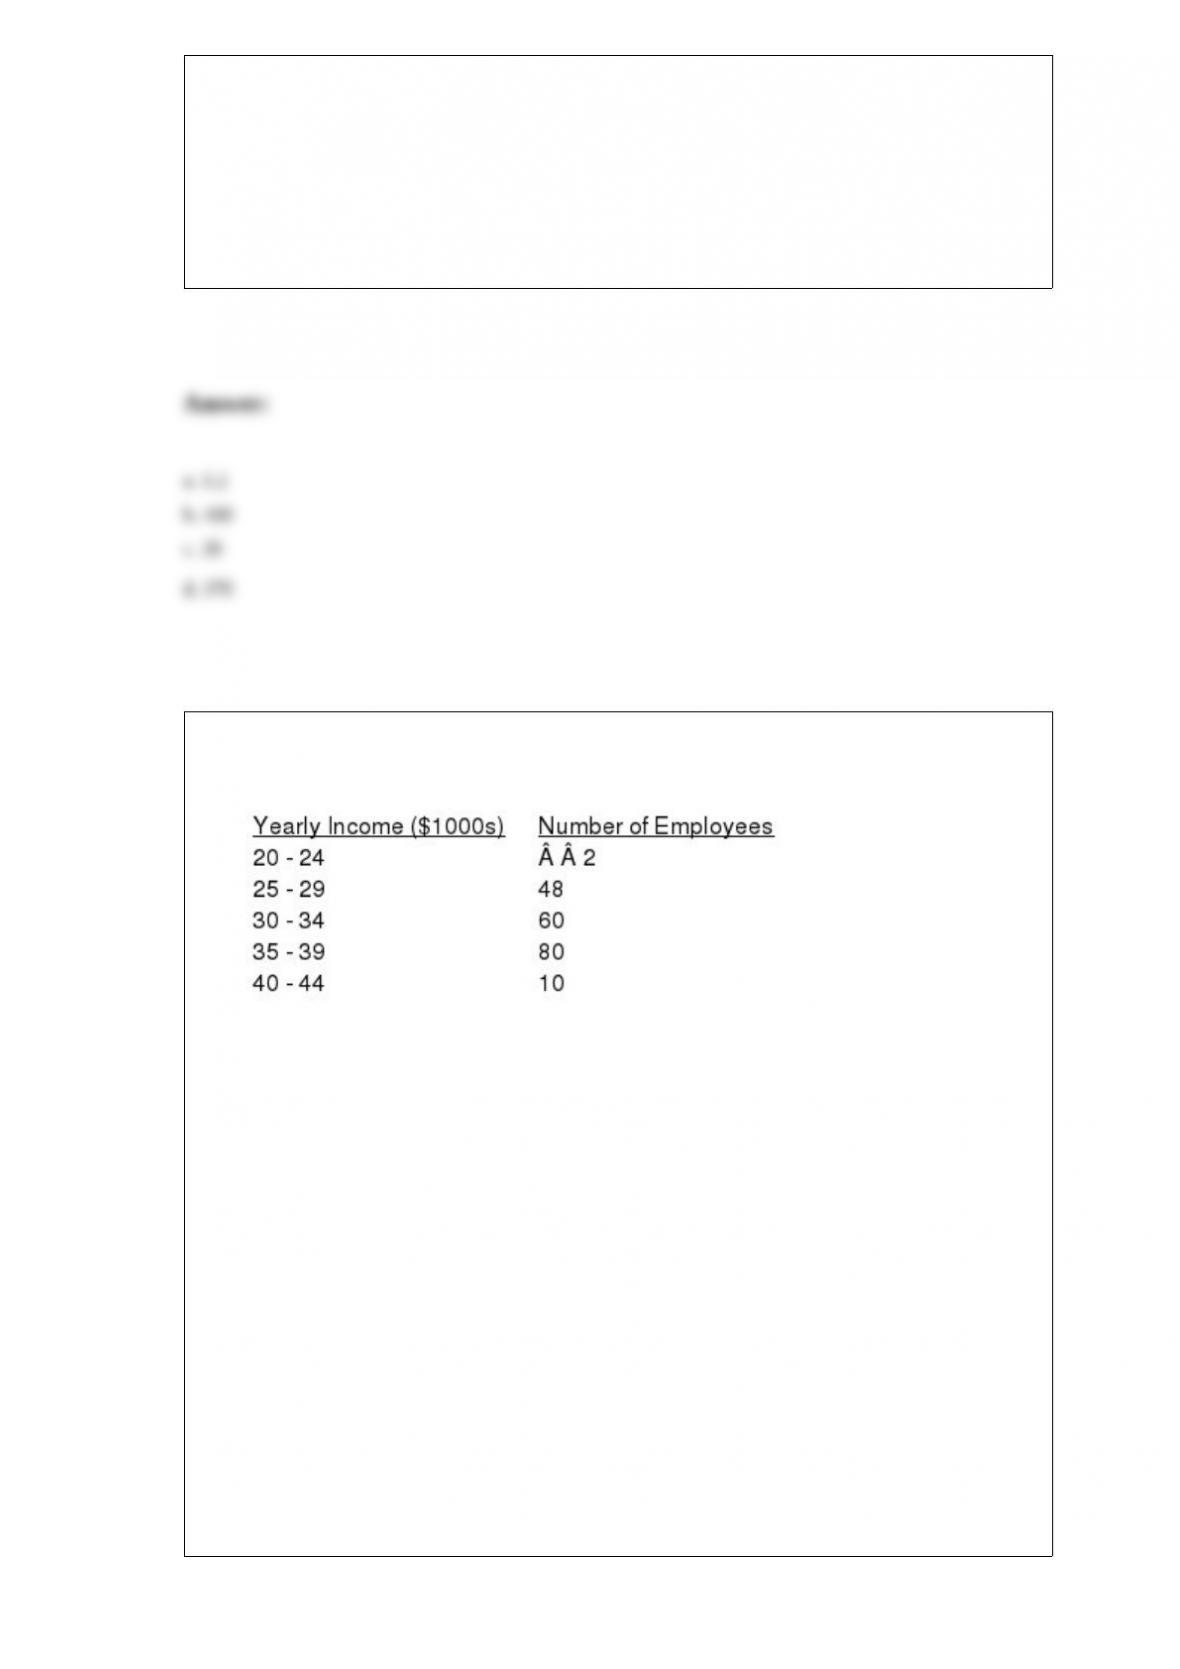
a. What is the expected demand?
b. What is the expected revenue?
c. What is the expected cost?
d. What is the expected profit?
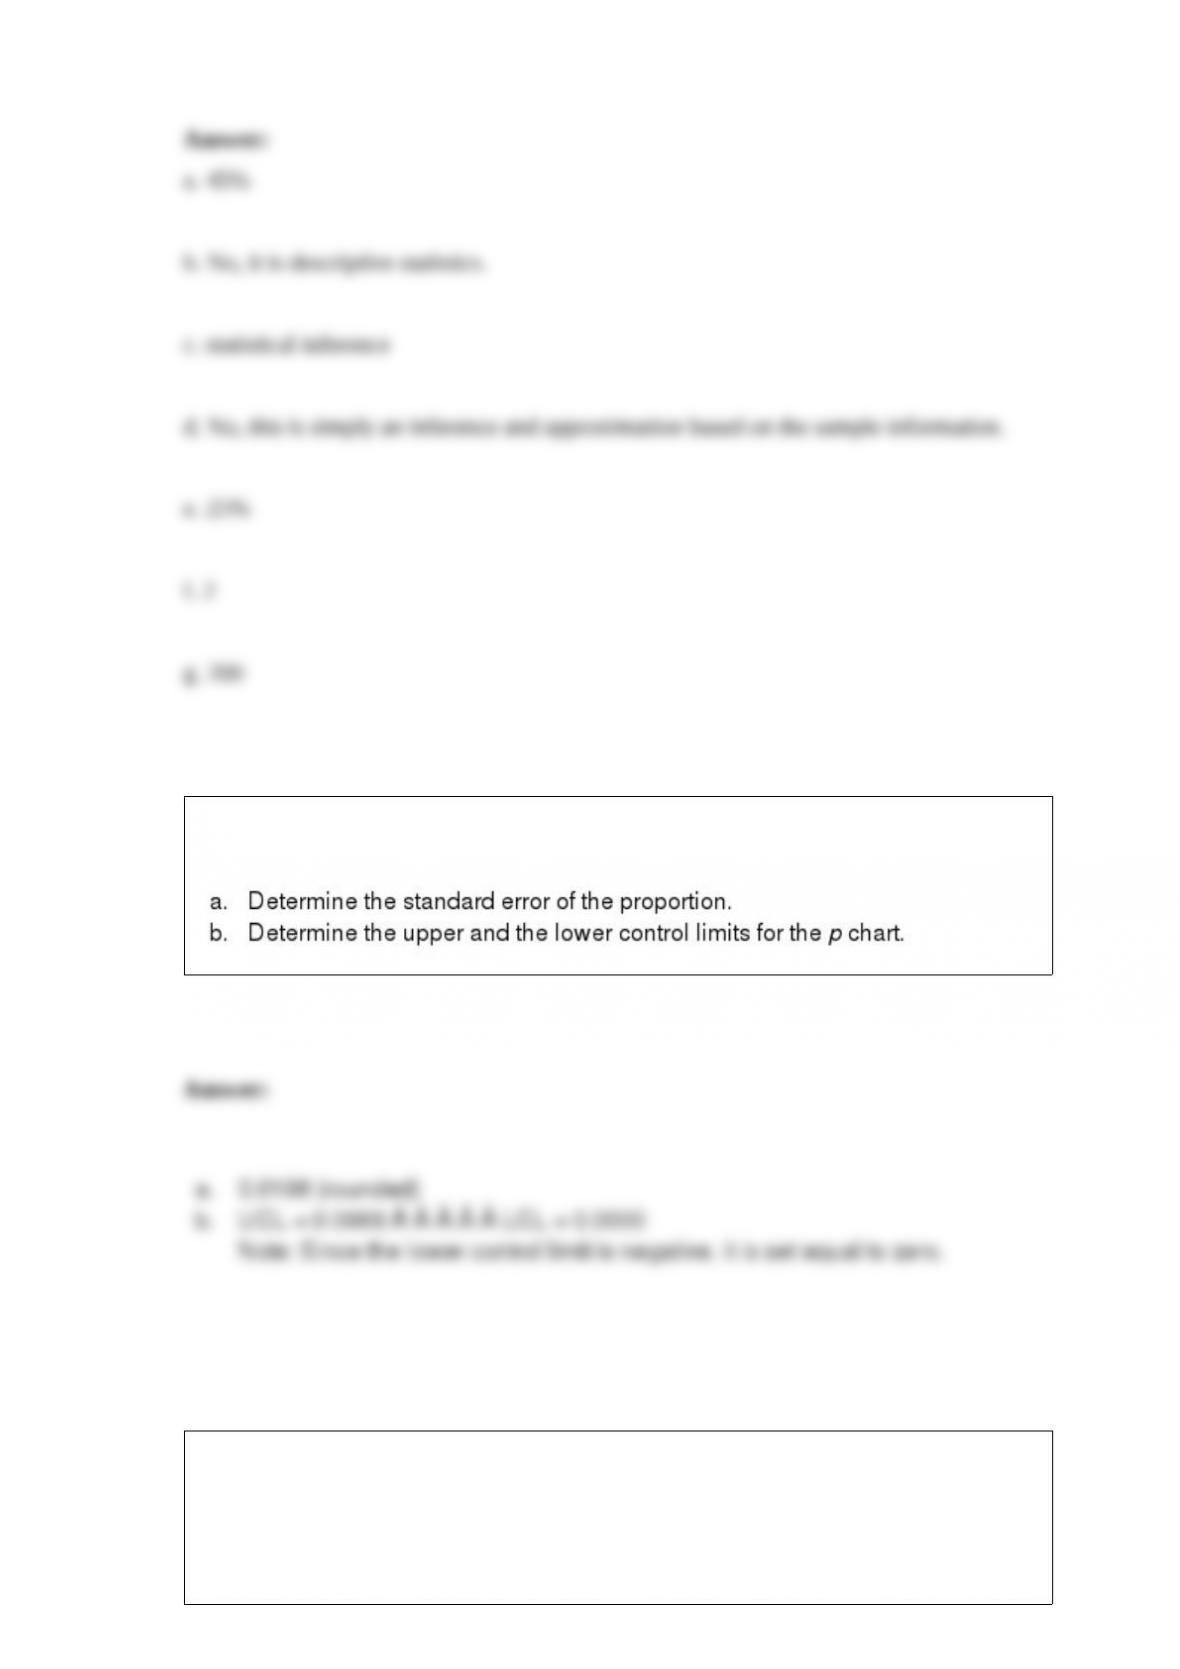
The following data shows the yearly income distribution of a sample of 200 employees
at MNM, Inc.
a. What percentage of employees has yearly incomes of more than $35,000?
b. Is the figure (percentage) that you computed in Part a an example of statistical
inference? If no, what kind of statistics does it represent?
c. Based on this sample, the president of the company said that "45% of all our
employees' yearly incomes are over $35,000." The president's statement represents what
kind of statistics?
d. With the statement made in Part c, can we be assured that more than 45% of all
employees' yearly incomes are at least $35,000? Explain.
e. What percentage of employees of the sample has yearly incomes of $29,000 or less?
f. How many variables are presented in the above data set?
g. The above data set represents the results of how many observations?
A production process is considered in control if 4% of the items produced are defective.
Samples of size 100 are used for the inspection process.
A new soft drink is being market tested. It is estimated that 60% of consumers will like
the new drink. A sample of 96 taste-tested the new drink.
a. Determine the standard error of the proportion
b. What is the probability that more than 70.4% of consumers will indicate they like the
drink?
c. What is the probability that more than 30% of consumers will indicate they do not
like the drink?
The probability of making a Type I error is denoted by
a.
b.
c. 1
d. 1
For ease of data entry into a university database, 1 denotes that the student is an
undergraduate and 2 indicates that the student is a graduate student. In this case data are
a. categorical
b. quantitative
c. either categorical or quantitative
d. neither categorical nor quantitative
When using Excel to calculate a p-value for a lower-tail hypothesis test, the following
must be used
a. RAND
b. 1 NORM.S.DIST
c. NORM.S.DIST
d. Not enough information is given to answer this question.
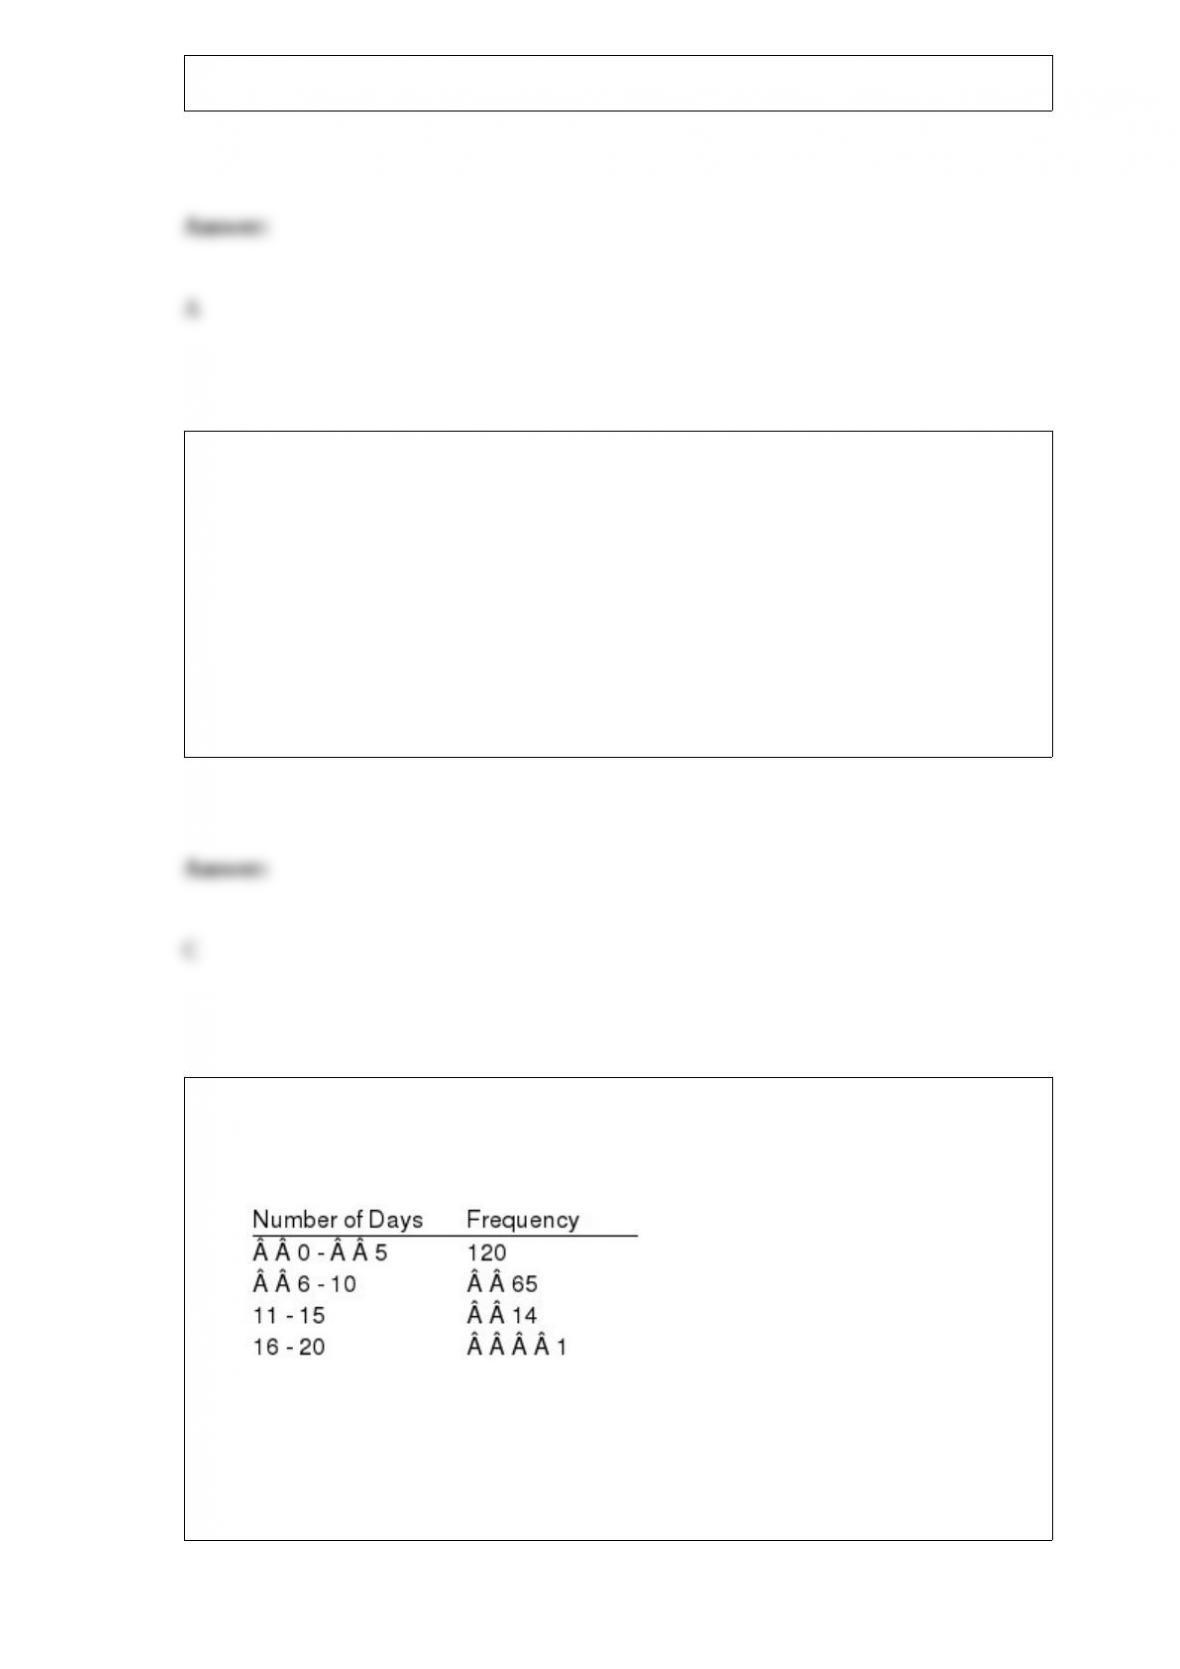
Exhibit 2-3
The number of sick days taken (per month) by 200 factory workers is summarized
below.
Refer to Exhibit 2-3. The cumulative percent frequency for the class of 16 20 is
a. 100%
b. 65%
c. 92.5%
d. 0.5%

An interval estimate is used to estimate
a. the shape of the population's distribution
b. the sampling distribution
c. a sample statistic
d. a population parameter
In regression analysis if the dependent variable is measured in dollars, the independent
variable
a. must also be in dollars
b. must be in some unit of currency
c. can be any units
d. cannot be in dollars
Consider the sales for six consecutive weeks for Sam's Strawberries. The sales are in
'œflats' sold.
Week Sales
1 16
2 18
3 14
4 10
5 20
6 22
a. Using a moving average with AP = 3, forecast the sales for weeks four through six.
b. Use a weighted moving average with weights of .5 (most recent), .4, and .1 (oldest)
to predict the sales for weeks four through six.
c. Use the naïve approach to predict the sales for weeks four through six.
d. Use exponential smoothing with = .3 to forecast sales for weeks four through six.
The parameters of nonlinear models have exponents
a. larger than zero
b. other than 1
c. only equal to 2
d. larger than 3
Which of the following is correct?
a. SSE SSR SST
b. SSR SSE SST
c. SST SSR SSE
d. SST (SSR)2
A control chart that is used when the output of a production process is measured in
terms of the proportion defective is
a. a p chart
b. an x-bar chart
c. an R chart
d. an np chart
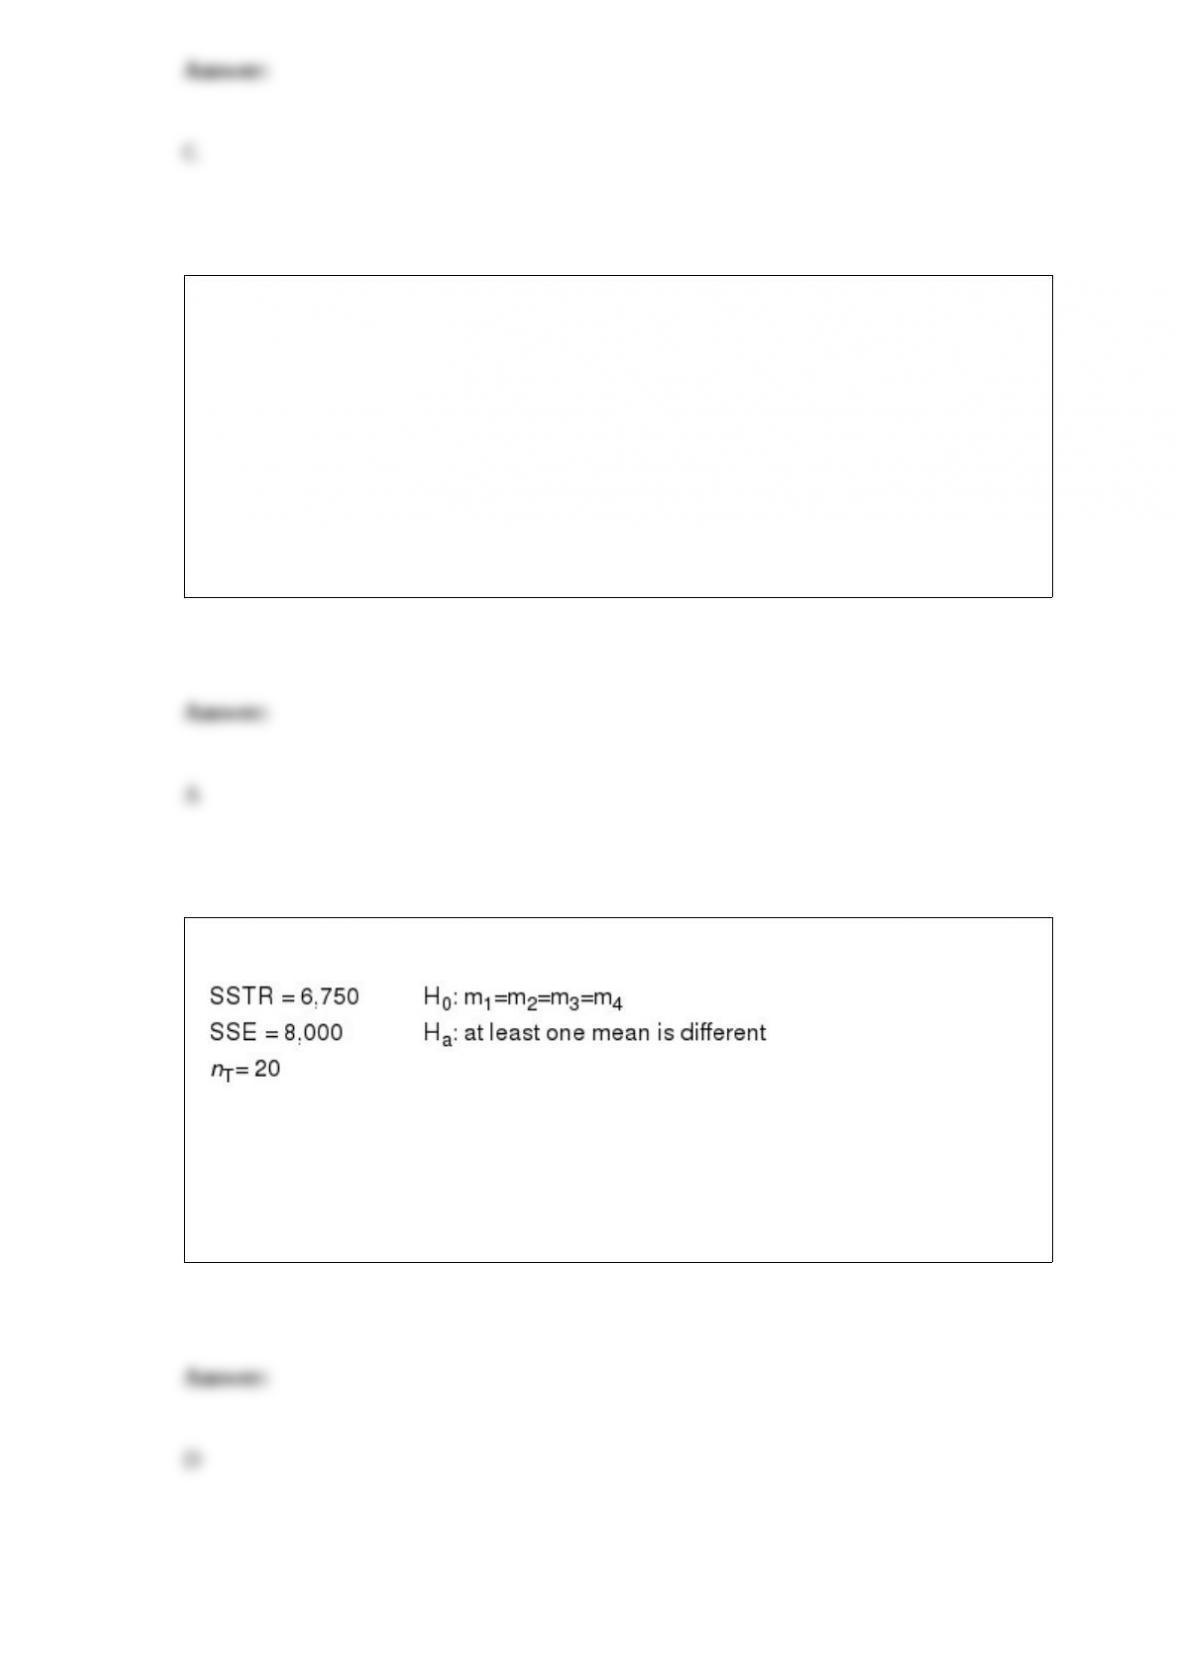
Exhibit 13-1
Refer to Exhibit 13-1. The mean square between treatments (MSTR) equals
a. 400
b. 500
c. 1,687.5
d. 2,250
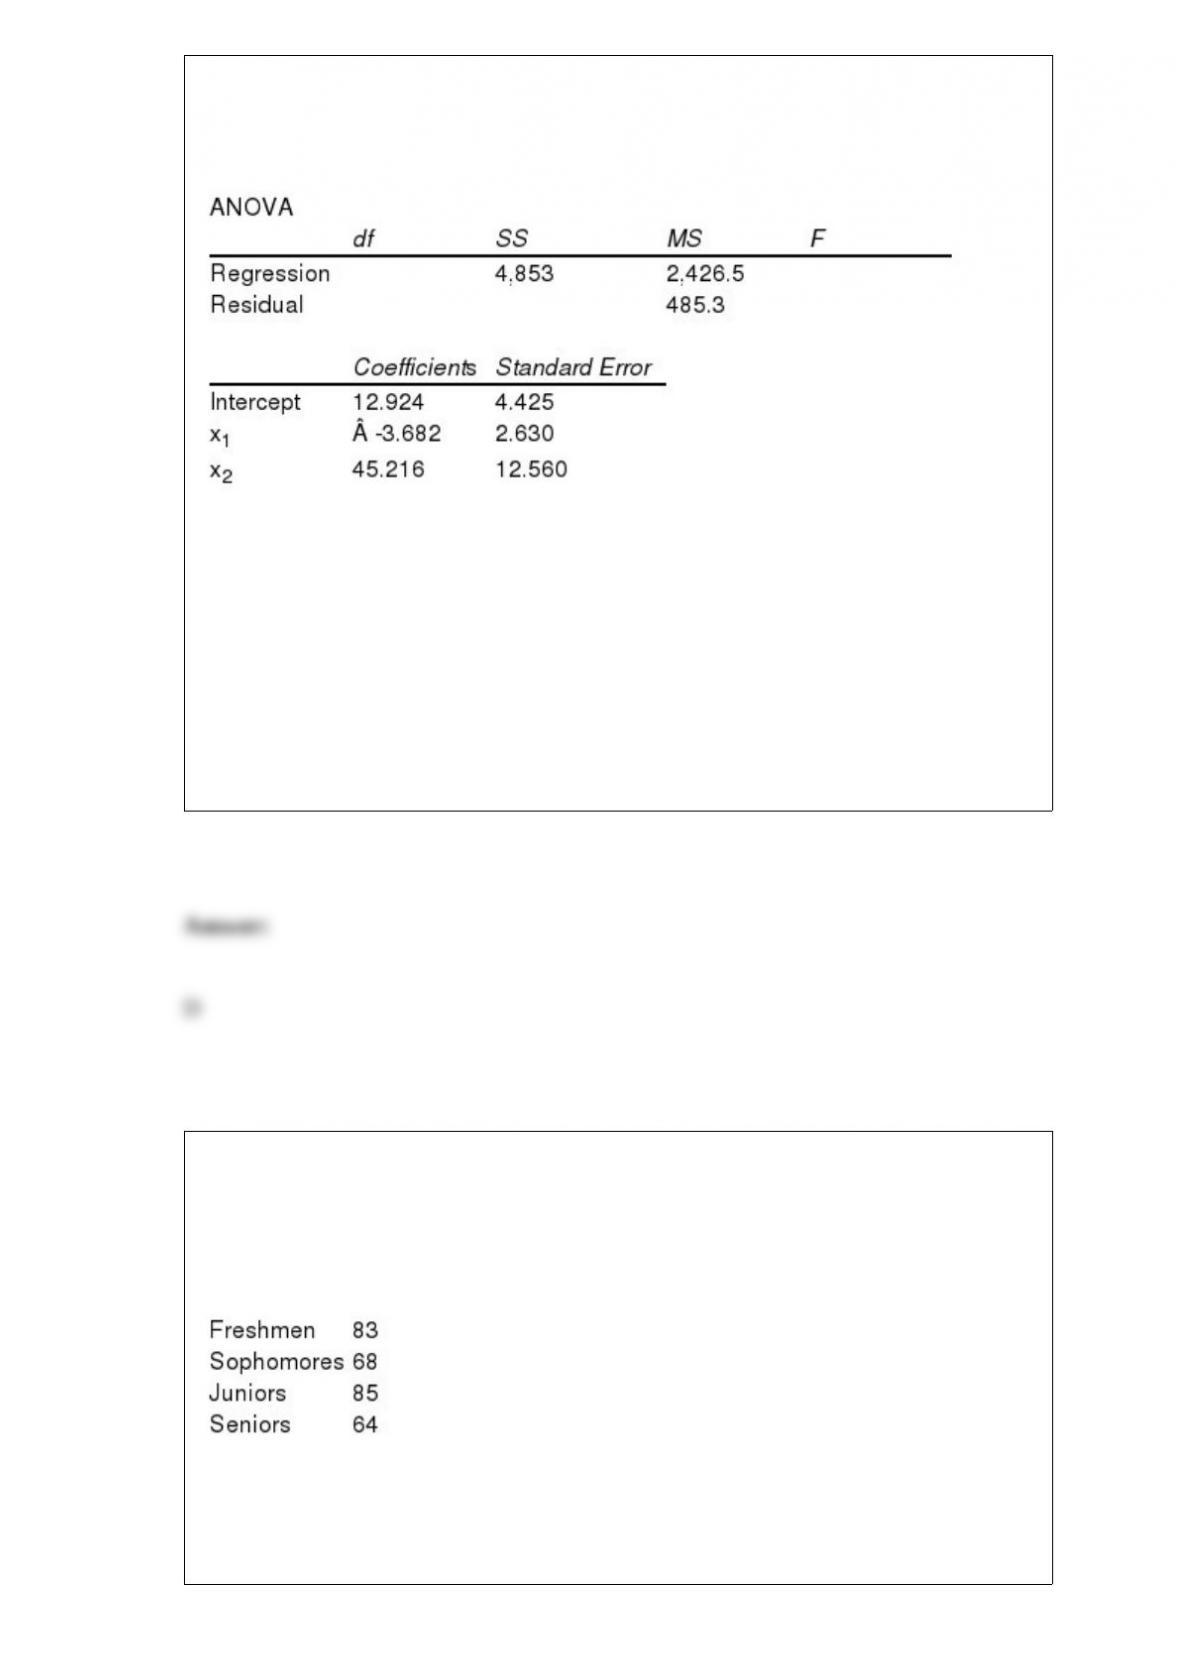
Exhibit 15-6
Below you are given a partial Excel output based on a sample of 16 observations.
Refer to Exhibit 15-6. The sum of squares due to error (SSE) equals
a. 37.33
b. 485.3
c. 4,853
d. 6,308.9
Exhibit 12-2
Last school year, the student body of a local university consisted of 30% freshmen, 24%
sophomores, 26% juniors, and 20% seniors. A sample of 300 students taken from this
year's student body showed the following number of students in each classification.
We are interested in determining whether or not there has been a significant change in
the classifications between the last school year and this school year.
Refer to Exhibit 12-2. The calculated value for the test statistic equals
a. 0.5444
b. 300
c. 1.6615
d. 6.6615
The ability of an interval estimate to contain the value of the population parameter is
described by the
a. confidence level
b. degrees of freedom
c. precise value of the population mean
d. None of the other answers are correct.
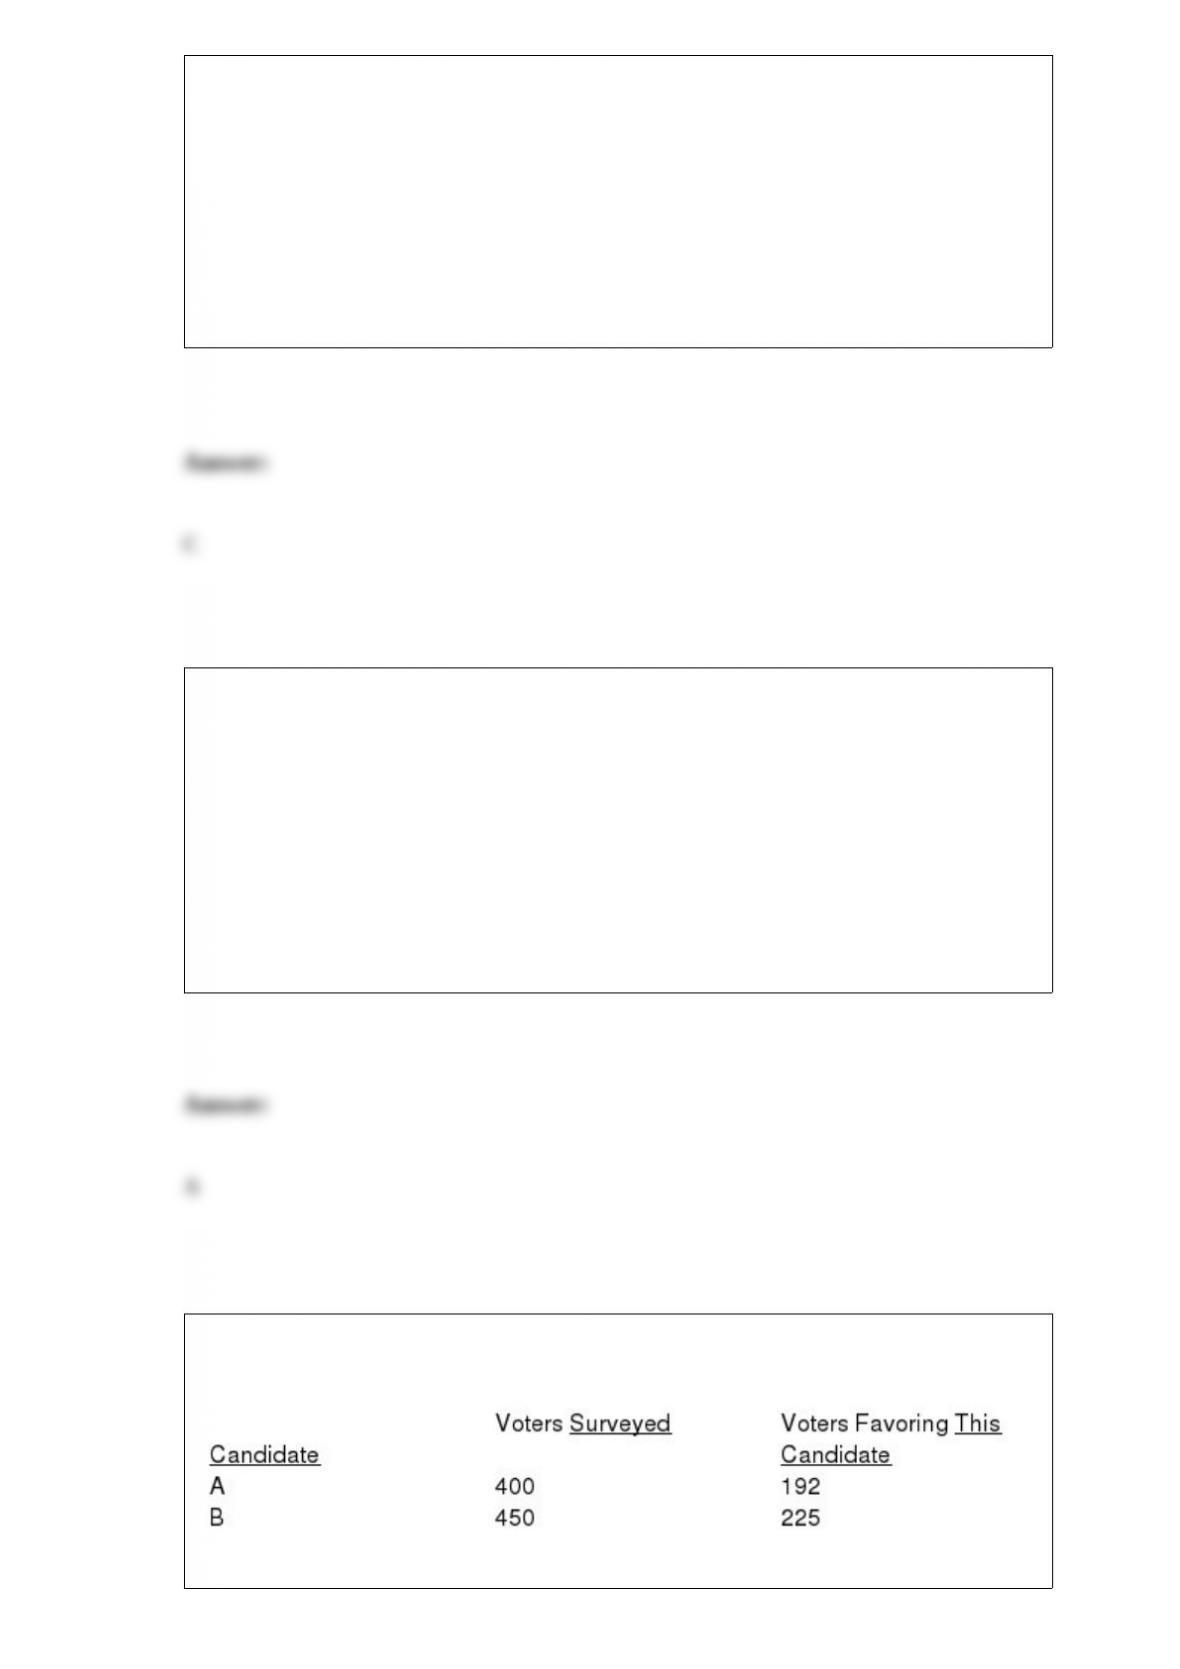
The results of a recent poll on the preference of voters regarding presidential candidates
are shown below.
At 95% confidence, test to determine whether or not there is a significant difference
between the preferences for the two candidates.
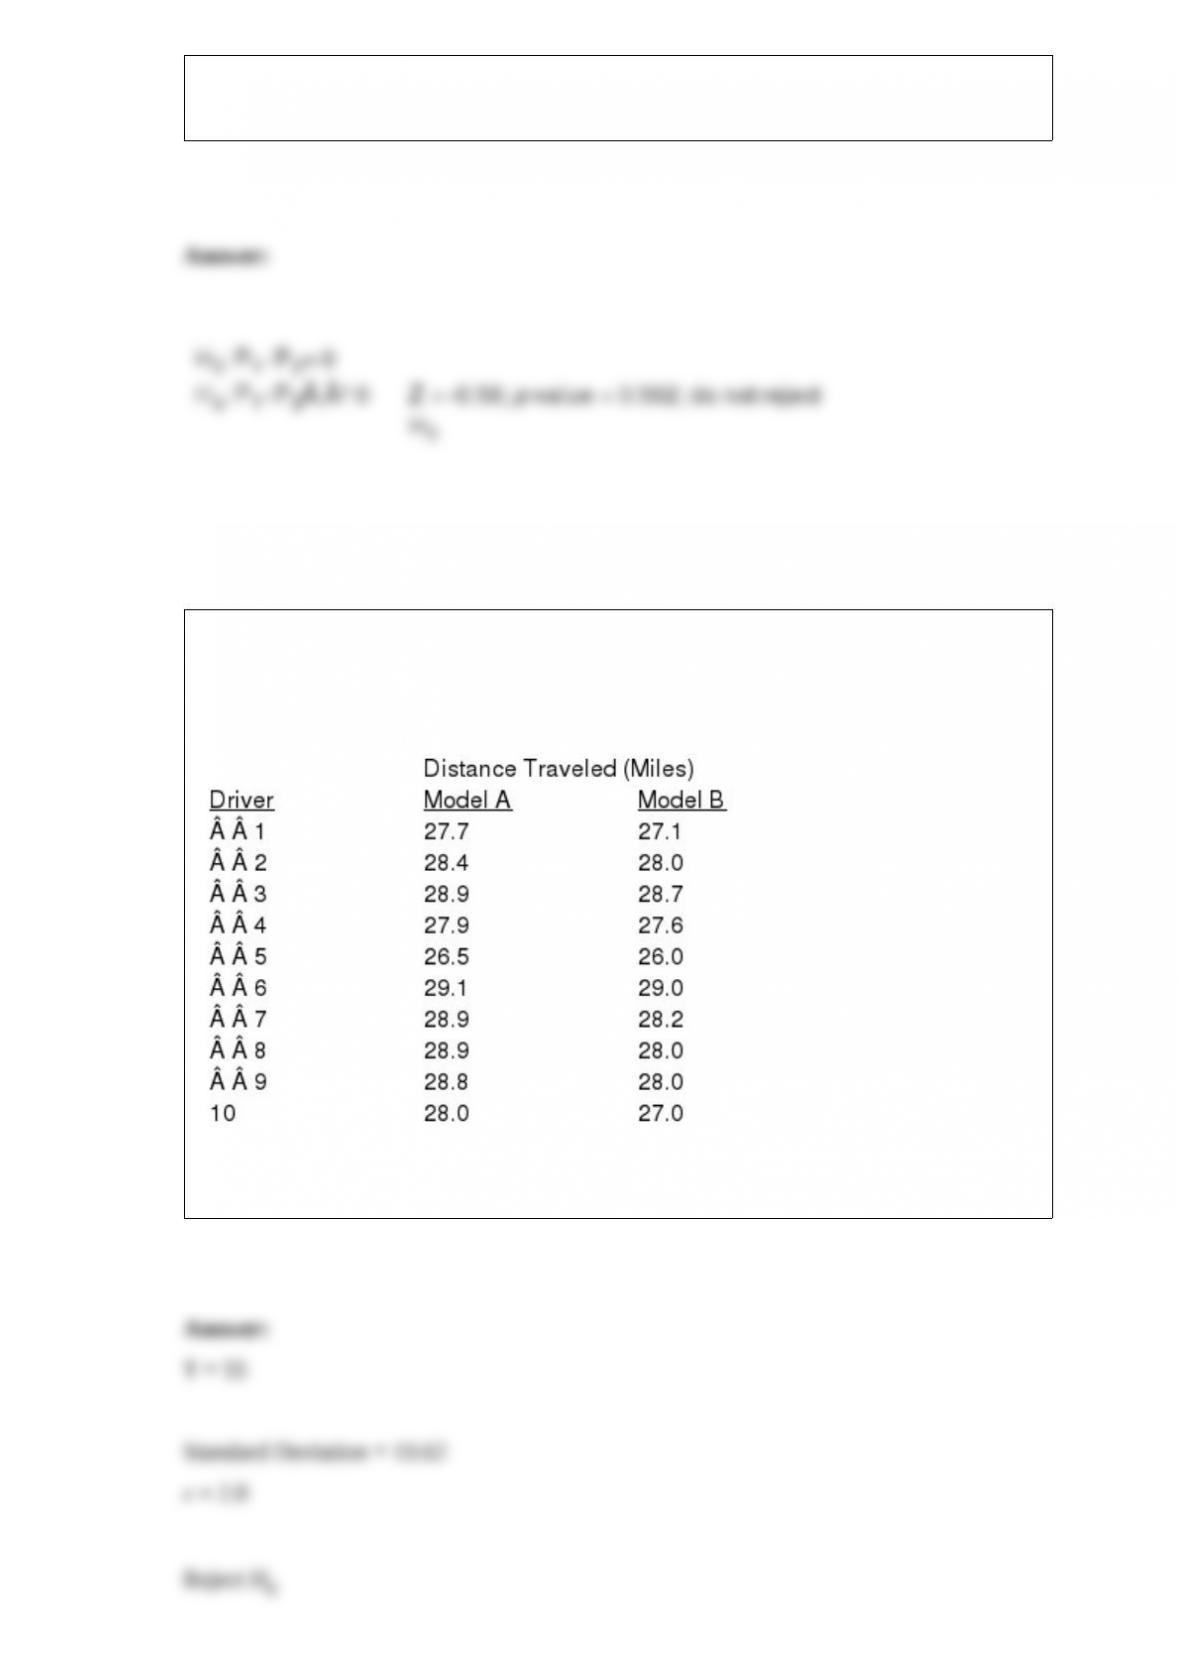
Ten drivers were asked to drive two models of a car. Each car was given one gallon of
gasoline. The distance that each automobile traveled on a gallon of gasoline is shown
below.
At = 0.05, what can be concluded about the performance of the two models?
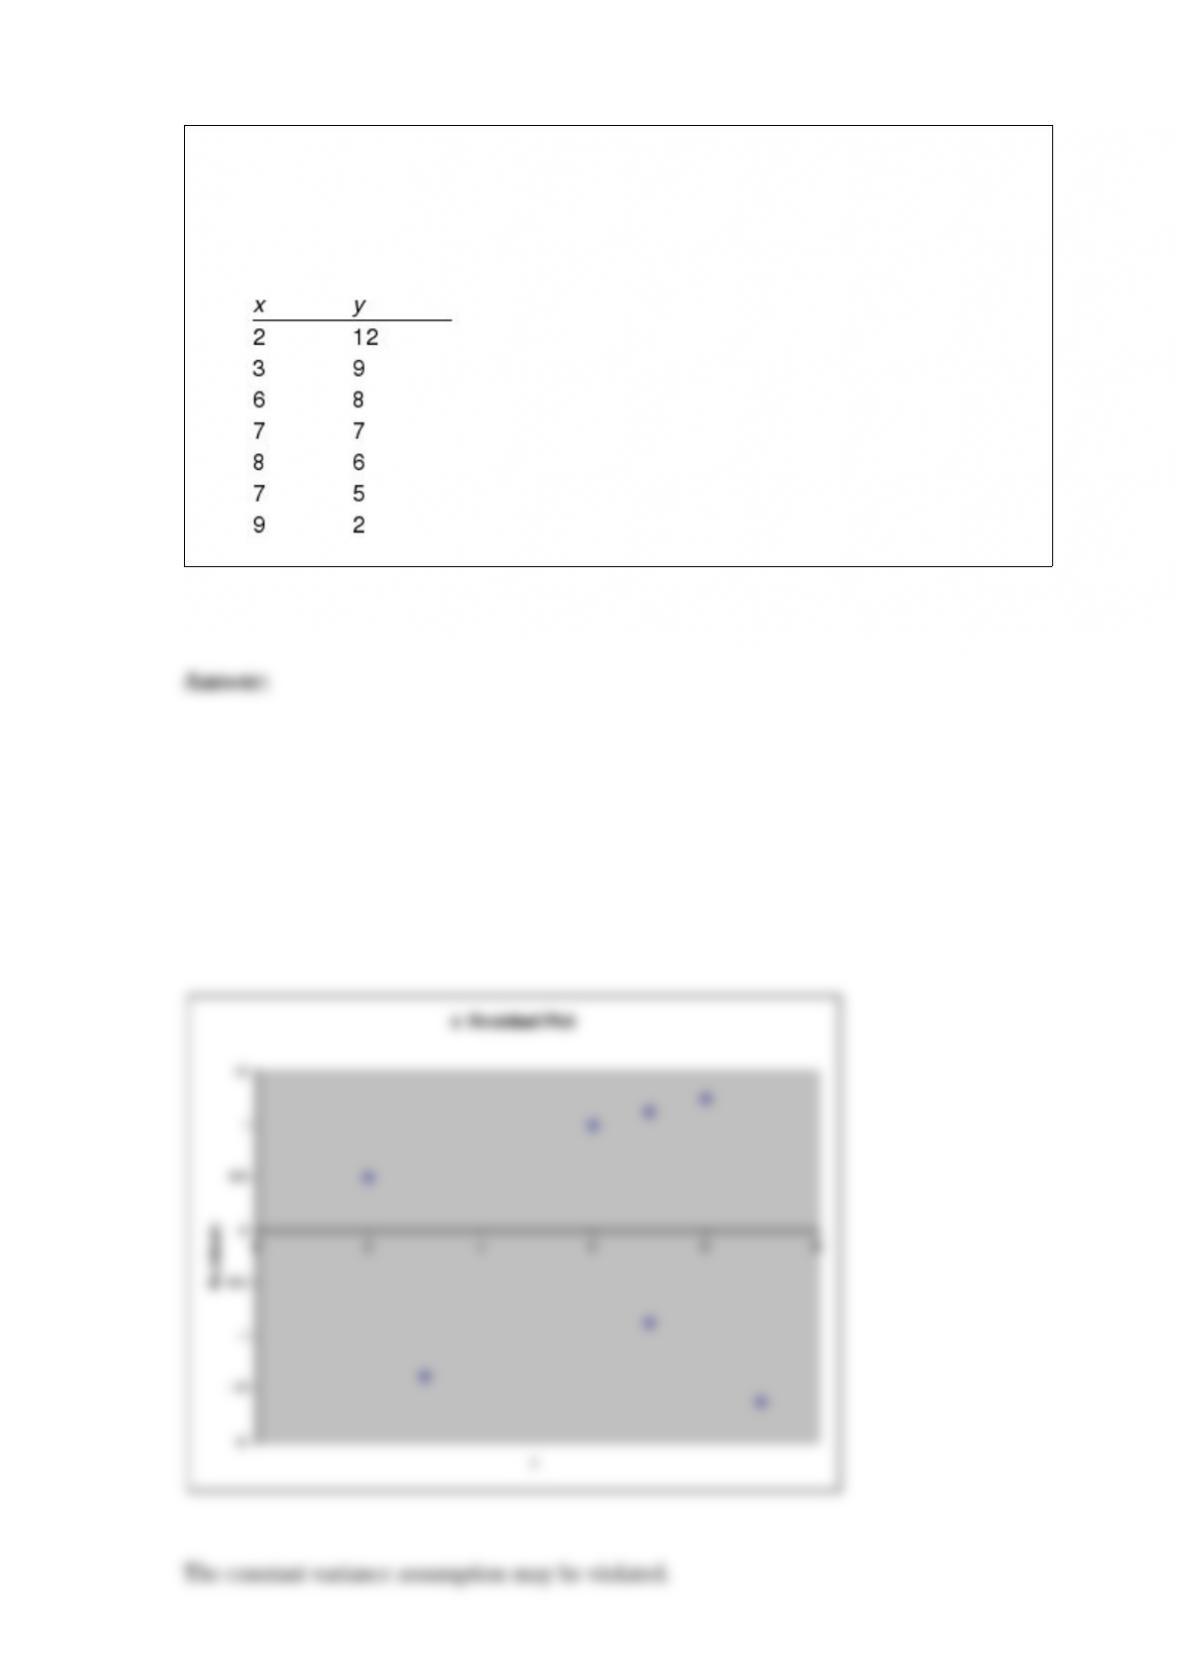
Given below are seven observations collected in a regression study on two variables, x
(independent variable) and y (dependent variable). Use Excel's Regression Tool to
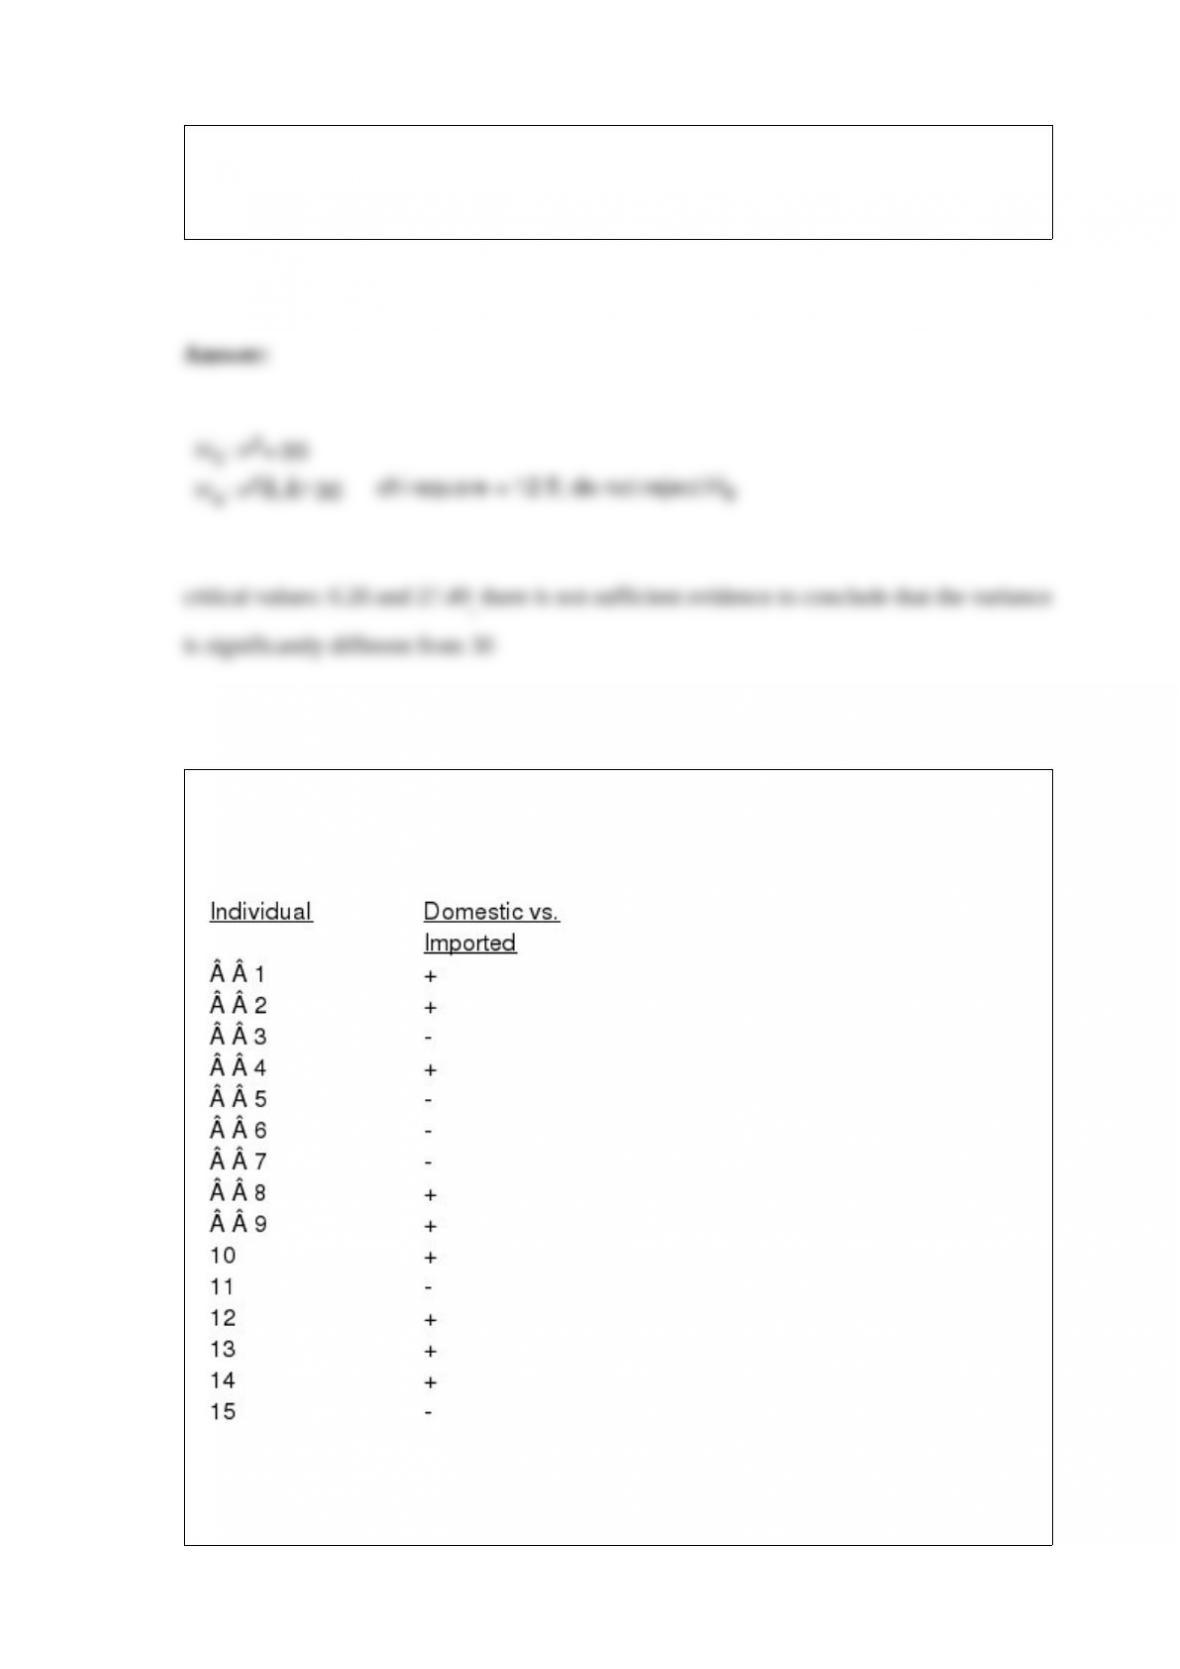
construct a residual plot and use it to determine if any model assumption have been
violated.
A sample of 16 students showed that the variance in the number of hours they spend
studying is At a 5% level of significance, test to see if the variance of the population is
significantly different from 30.
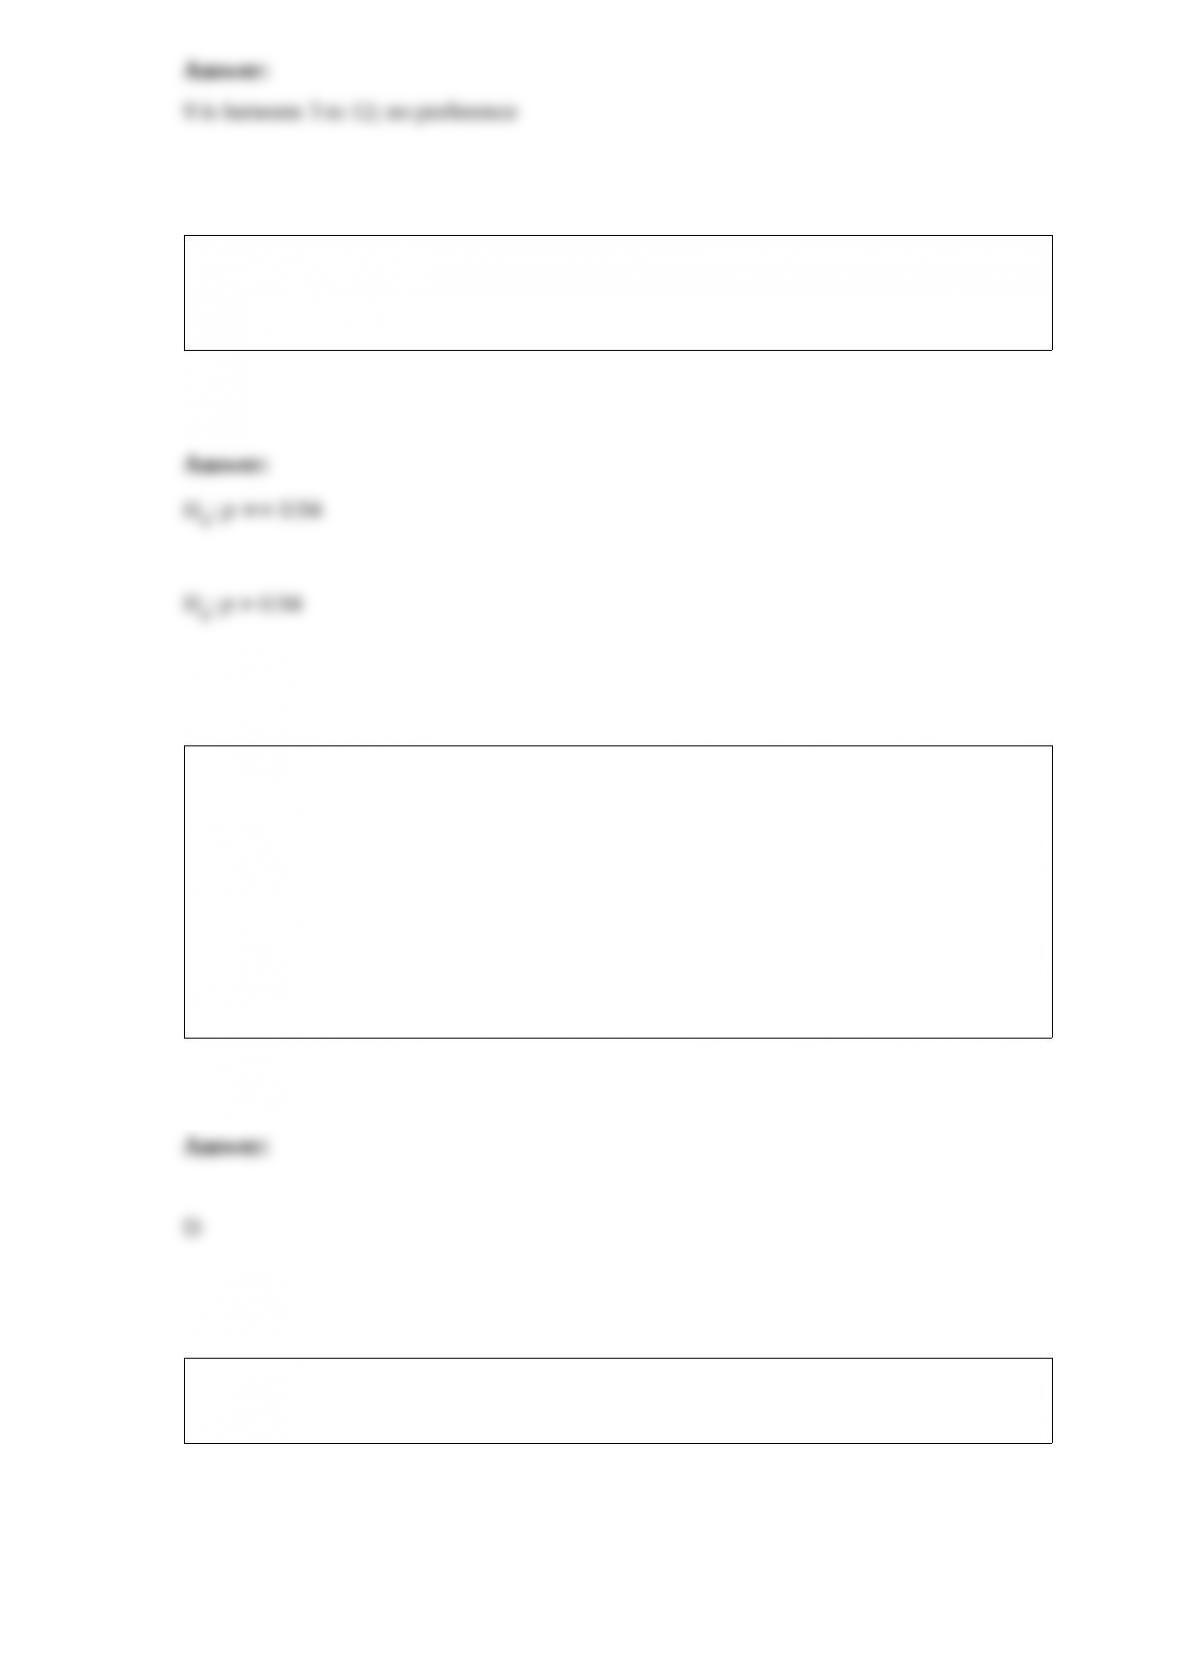
Fifteen people were asked to indicate their preference for domestic versus imported
cars. The following data showed their preferences.
With = 0.06, test for a significant difference in the preferences for cars. A "+"
indicates a preference for imported cars.
A manufacturer is considering a new production method. The current method produces
94% non-defective (good) parts. The new method will be implemented if it produces
more non-defectives than the current method. Identify the hypotheses.
Application of Bayes' theorem enables us to compute
a. the prior probability of each state of nature
b. the posterior probability of each sample outcome
c. the conditional probability of the sample outcomes given each state of nature
d. the conditional probability of the states of nature given each sample outcome
In order to estimate the difference between the average yearly salaries of top managers
in private and governmental organizations, the following information was gathered.
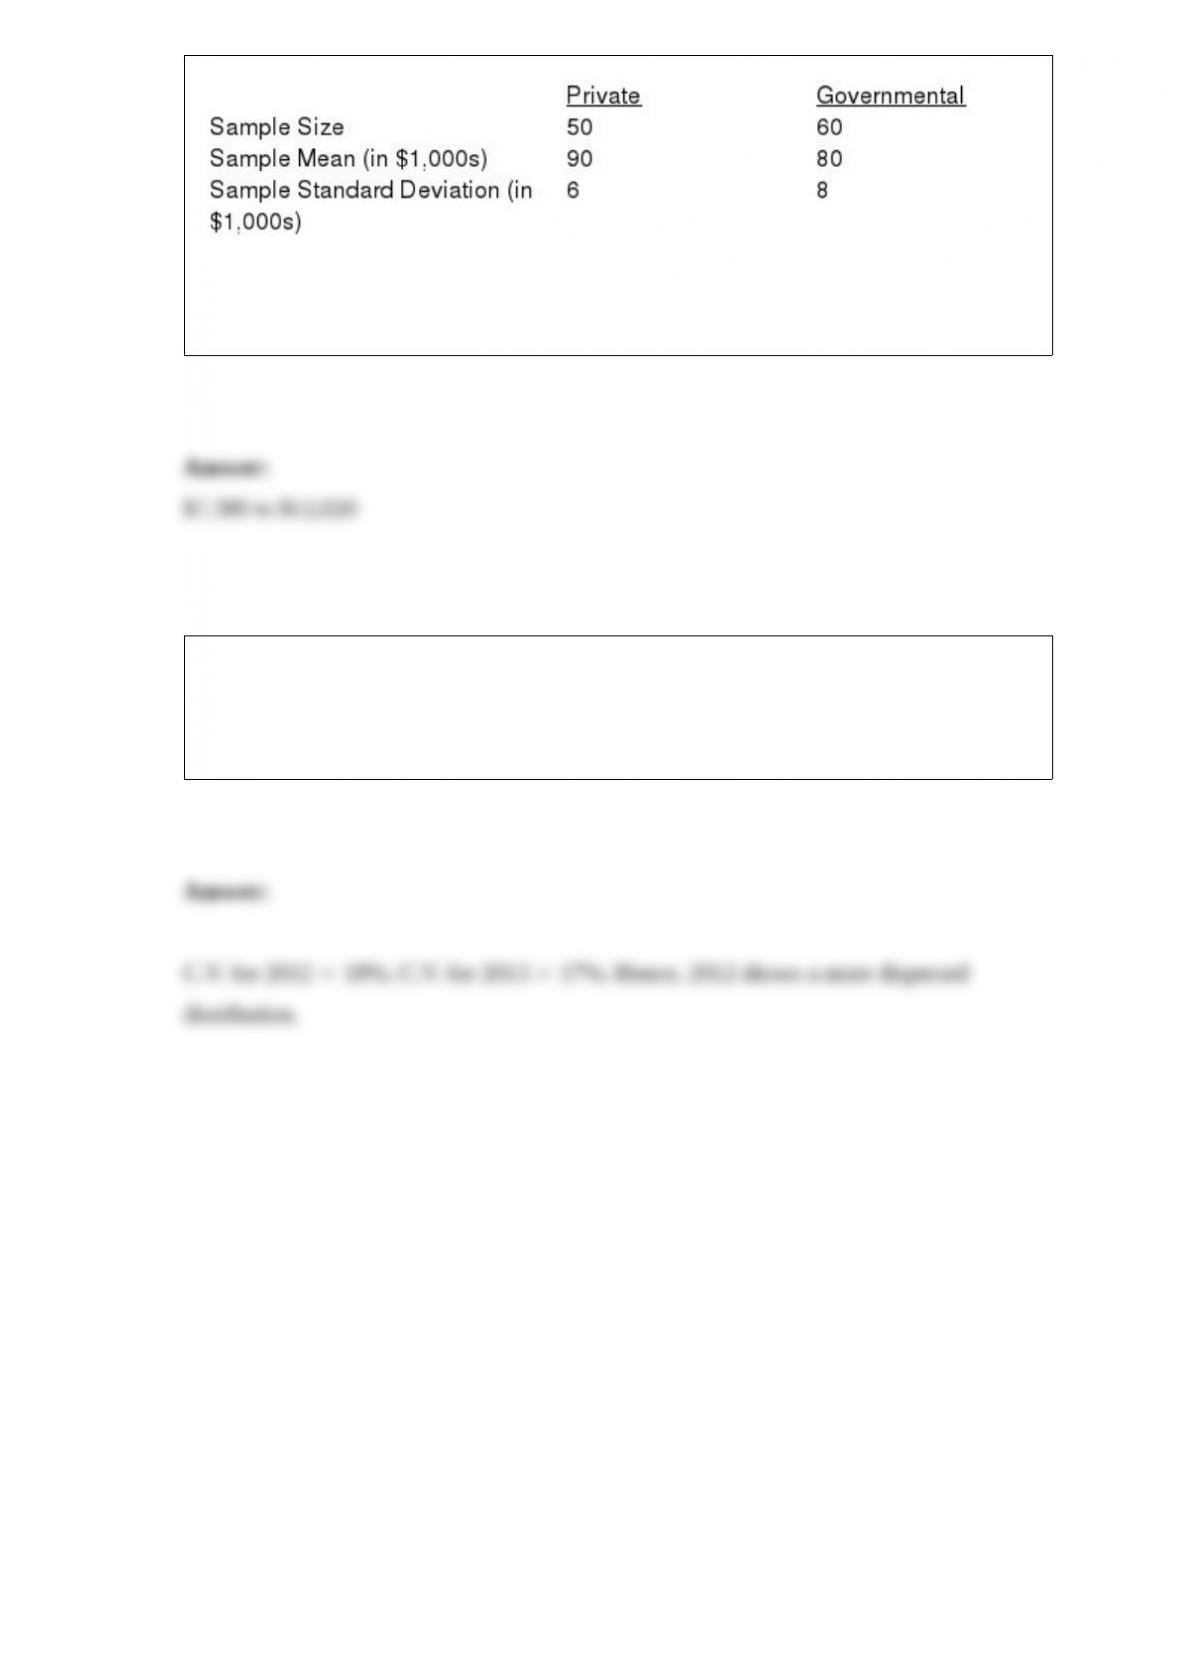
Develop an interval estimate for the difference between the average salaries of the two
sectors. Let = .05.
In 2012, the average age of students at UTC was 22 with a standard deviation of 3.96.
In 2013, the average age was 24 with a standard deviation of 4.08. In which year do the
ages show a more dispersed distribution? Show your complete work and support your
answer.


