
Exhibit 18-2
Students in statistics classes were asked whether they preferred a 10-minute break or to
get out of class 10 minutes early. In a sample of 150 students, 40 preferred a 10-minute
break, 80 preferred to get out 10 minutes early, and 30 had no preference. We want to
determine if there is a difference in students’ preferences.
Refer to Exhibit 18-2. The hypothesis is to be tested at the 5% level of significance. The
decision rule is not to reject the null hypothesis if
a. -1.96 < z < 1.96
b. -1.645 < z < 1.645
c. z > 1.96 or z < -1.96
d. the number of “+” signs is greater than or equal to 20 and less than or equal to 130
It has been suggested that night shift-workers show more variability in their output
levels than day workers. Below, you are given the results of two independent random
samples.
a. State the null and alternative hypotheses to be tested.
b. Compute the test statistic.
c. The null hypothesis is to be tested at the 5% level of significance. State the decision
rule for the test.
d. What do you conclude?
Exhibit 9-4
A random sample of 16 students selected from the student body of a large university
had an average age of 25 years. We want to determine if the average age of all the
students at the university is significantly different from 24. Assume the distribution of
the population of ages is normal with a standard deviation of 2 years.
Refer to Exhibit 9-4. The test statistic is
a. 1.96
b. 2.00
c. 1.645
d. 0.05
Exhibit 16-4
In a laboratory experiment, data were gathered on the life span (y in months) of 33 rats,

units of daily protein intake (x1), and whether or not agent x2 (a proposed life extending
agent) was added to the rats diet (x2 = 0 if agent x2 was not added, and x2 = 1 if agent
was added.) From the results of the experiment, the following regression model was
developed.
= 36 + 0.8x1 – 1.7x2
Also provided are SSR = 60 and SST = 180.
Refer to Exhibit 16-4. The degrees of freedom associated with SSE are
a. 3
b. 33
c. 32
d. 30
The following linear trend expression was estimated using a time series with 17 time
periods.
Tt = 129.2 + 3.8t
The trend projection for time period 18 is
a. 68.4
b. 193.8
c. 197.6
d. 6.84
40. Exhibit 12-6
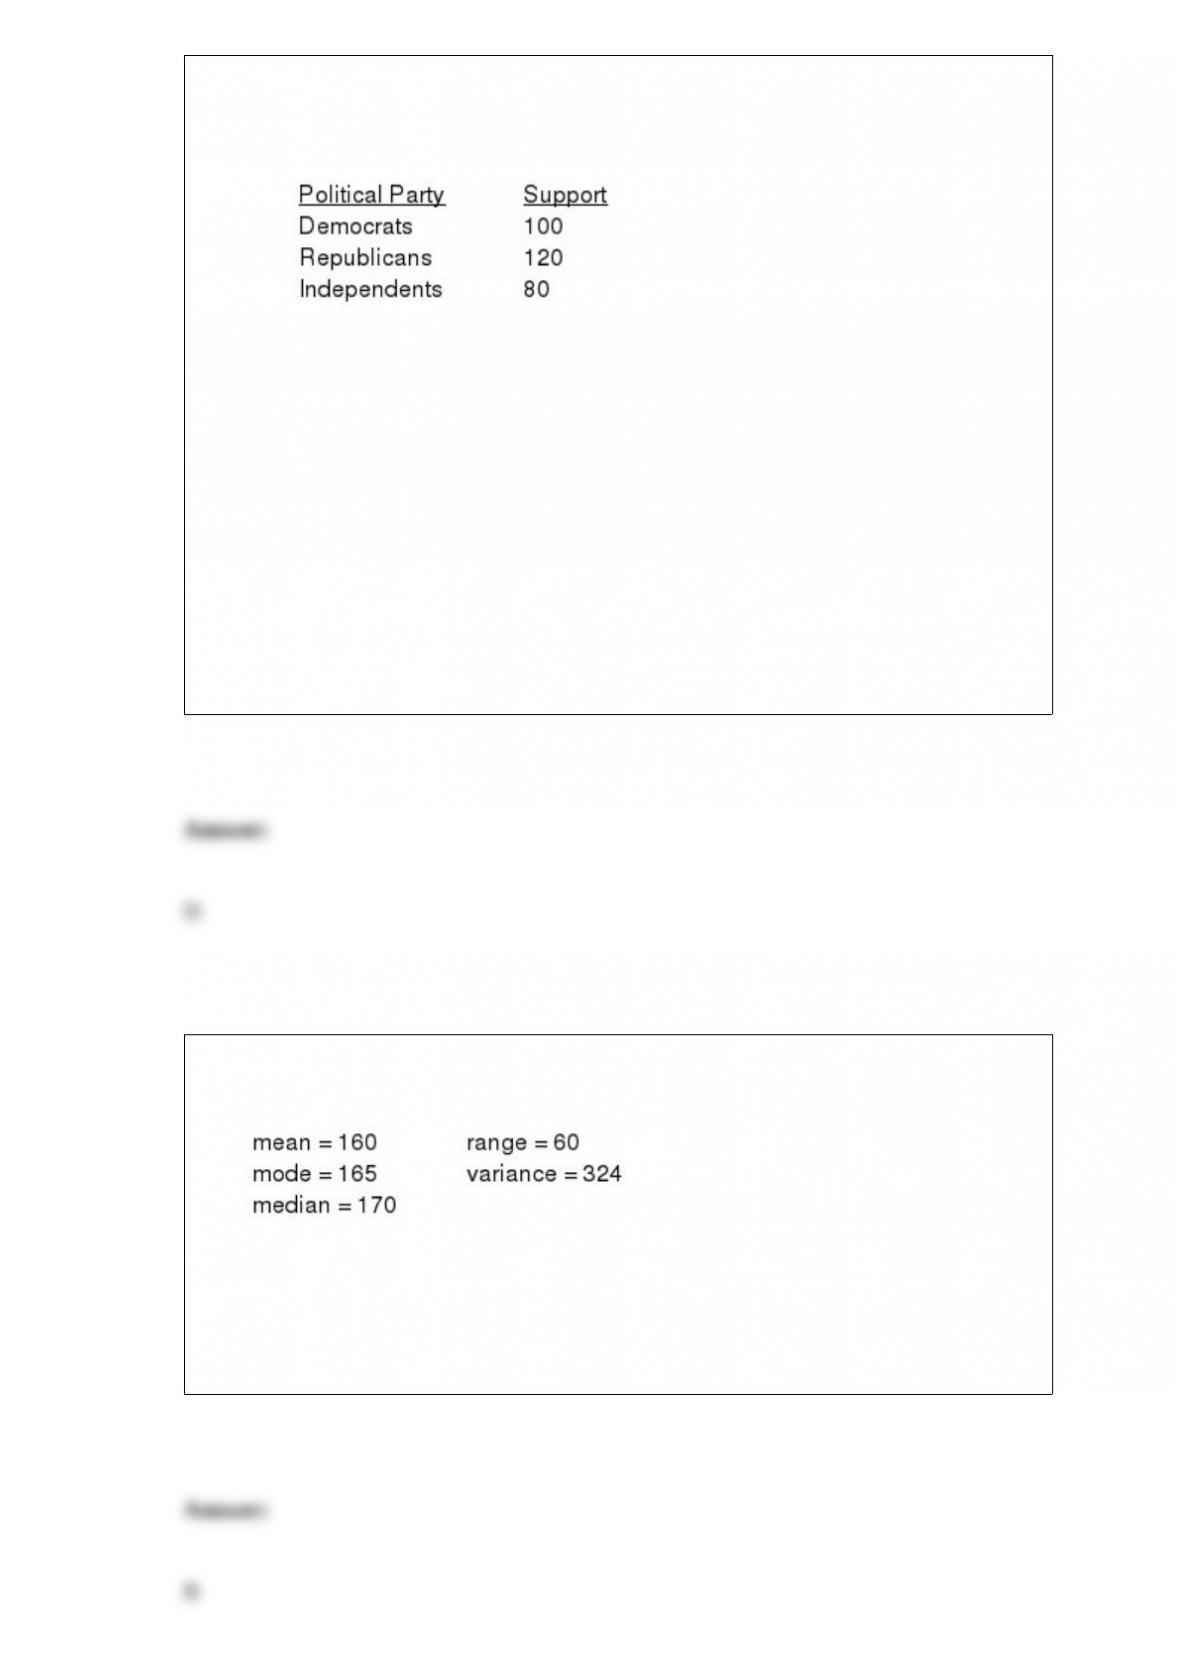
The following shows the number of individuals in a sample of 300 who indicated they
support the new tax proposal.
We are interested in determining whether or not the opinions of the individuals of the
three groups are uniformly distributed.
Refer to Exhibit 12-6. The calculated value for the test statistic equals
a. 300
b. 4
c. 0
d. 8
The weights (in pounds) of a sample of 36 individuals were recorded and the following
statistics were calculated
The coefficient of variation equals
a. 0.1125%
b. 11.25%
c. 203.12%
d. 0.20312%
If a null hypothesis that states that two populations are identical is rejected using a
nonparametric test, then it is safe to assume that
a. neither the means nor the variances are equal
b. the means of the populations are not the same
c. the variances of the populations are not the same
d. We cannot be sure of the way in which the populations differ from each other.
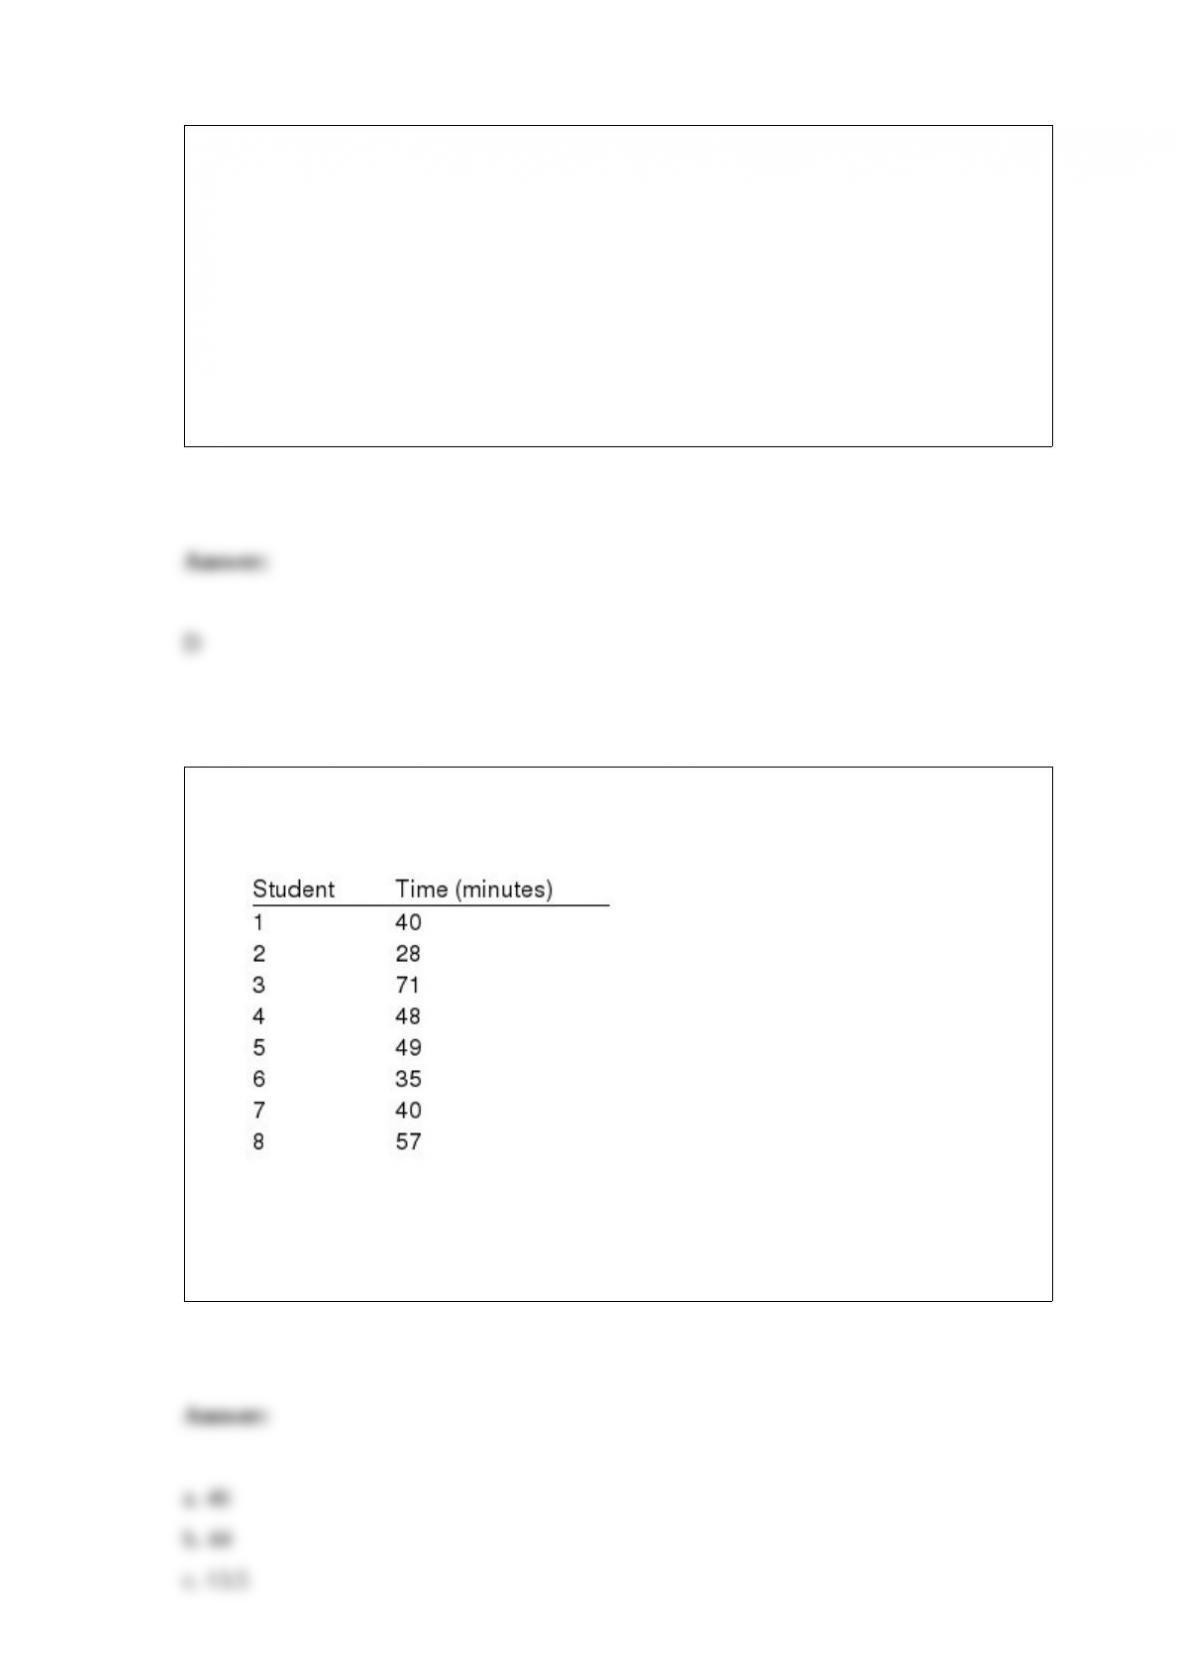
The amount of time that a sample of students spends watching television per day is
given below.
a. Compute the mean.
b. Compute the median.
c. Compute the standard deviation.
d. Compute the 75th percentile.

The mean square is the sum of squares divided by
a. the total number of observations
b. its corresponding degrees of freedom
c. its corresponding degrees of freedom minus one
d. None of these alternatives is correct.
If arrivals follow a Poisson probability distribution, the time between successive
arrivals must follow
a. a Poisson probability distribution
b. a normal probability distribution
c. a uniform probability distribution
d. an exponential probability distribution
With nonprobabilistic sampling
a. it is possible to make estimates about the precision of the population parameters
b. it is not possible to make statements about the precision of estimates made

concerning the population parameters
c. the precision can be estimated if the sample is larger than 30
d. None of these alternatives is correct.
The measure of location that is the most likely to be influenced by extreme values in the
data set is the
a. range
b. median
c. mode
d. mean
If the estimate of the trend component is 158.2, the estimate of the seasonal component
is 94%, the estimate of the cyclical component is 105%, and the estimate of the
irregular component is 98%, then the multiplicative model will produce a forecast of
a. 1.53
b. 1.53%
c. 153.02
d. 153,020,532
In a sample of 800 students in a university, 160, or 20%, are Business majors. Based on
the above information, the school’s paper reported that “20% of all the students at the
university are Business majors.” This report is an example of
a. a sample
b. a population
c. statistical inference
d. descriptive statistics
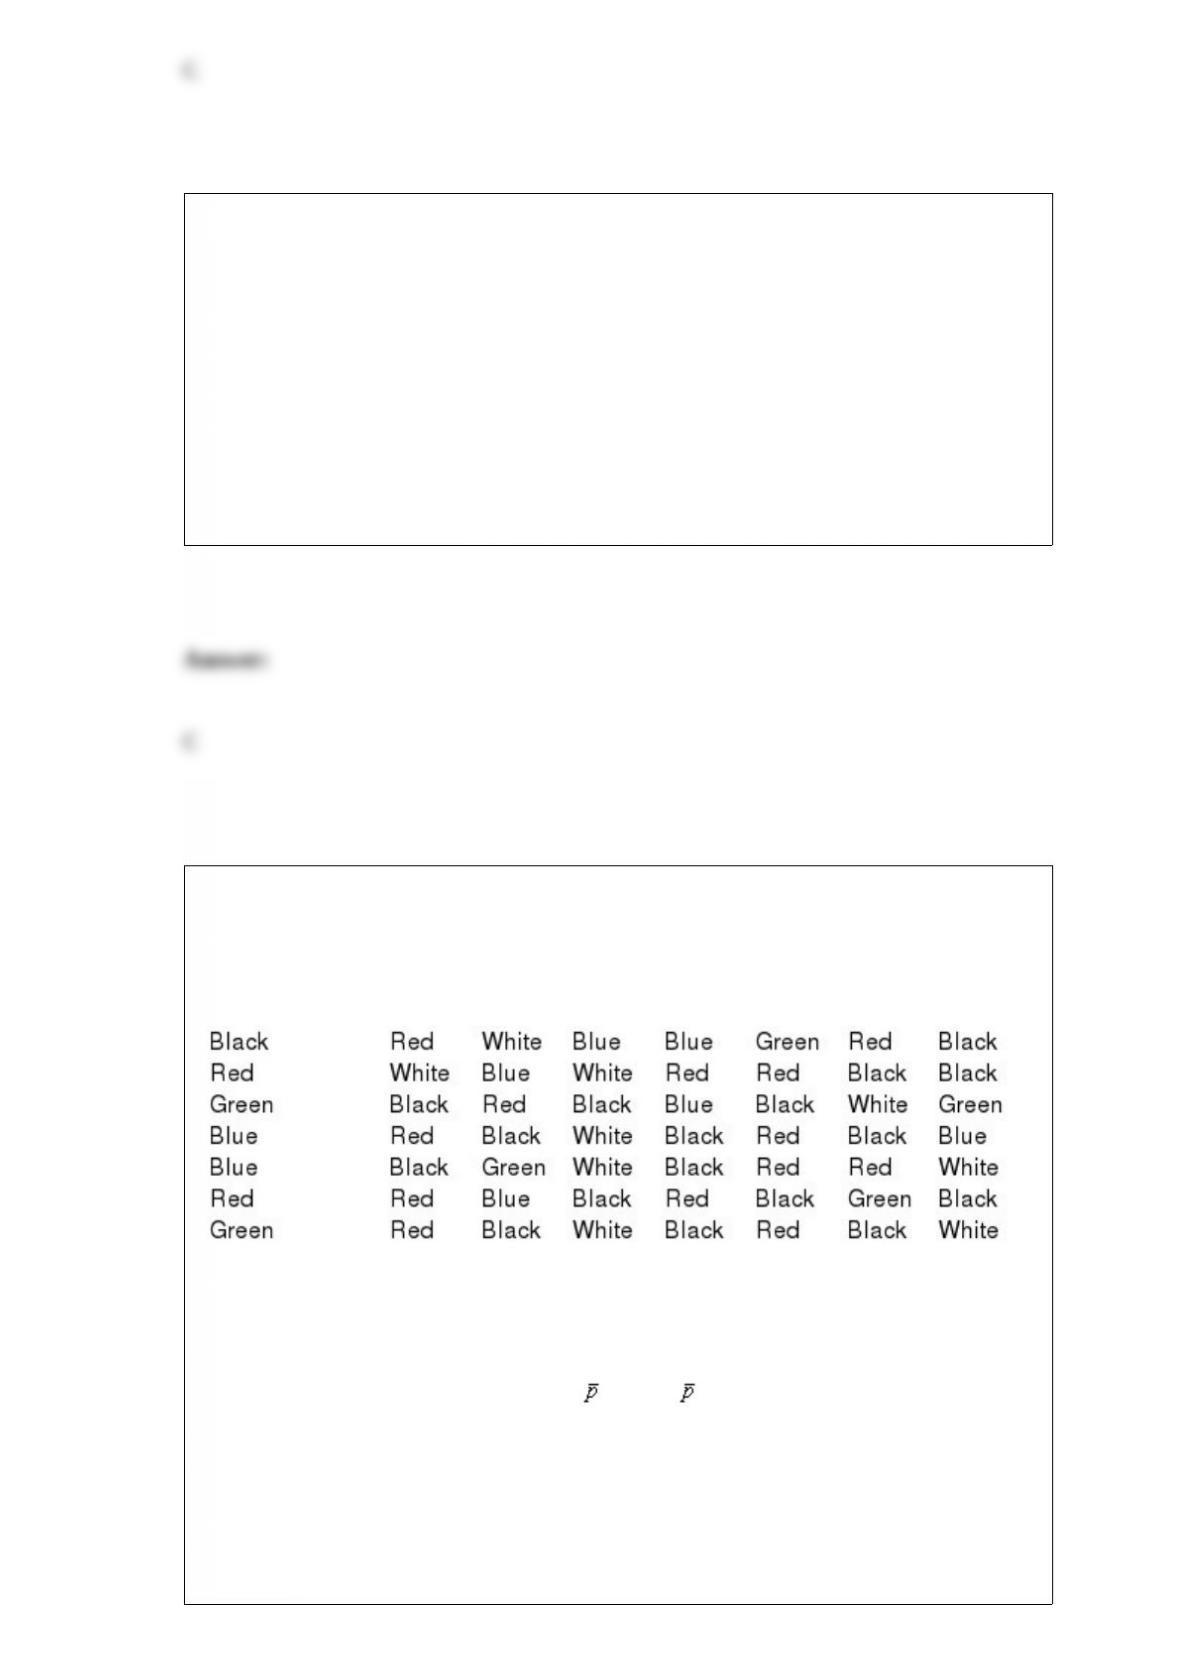
Roger Hall, who oversees six Ford dealerships, believes that the colors chosen by
customers who special-order their cars best reflect most customers’ true color
preferences. For that reason, he has tabulated the color requests specified in a sample of
56 Mustang coupe special orders placed this year. The sample data are listed below.
a. What is the point estimate of the proportion of all Mustang coupe special orders that
specify a color preference of black?
b. Describe the sampling distribution of , where is the proportion of Mustang
coupe special orders that specify a color preference of black. Assume that the
proportion of all Mustang coupe special orders having a color preference of black is .
36.
c. What is the probability that a simple random sample of 56 special orders will provide
an estimate of the population proportion of special orders specifying the color black that
is within plus or minus .05 of the actual population proportion, assuming p = .36? In
other words, what is the probability that will be between .31 and .41?
Excel’s EXPON.DIST function has how many inputs?
a. 2
b. 3
c. 4
d. 5
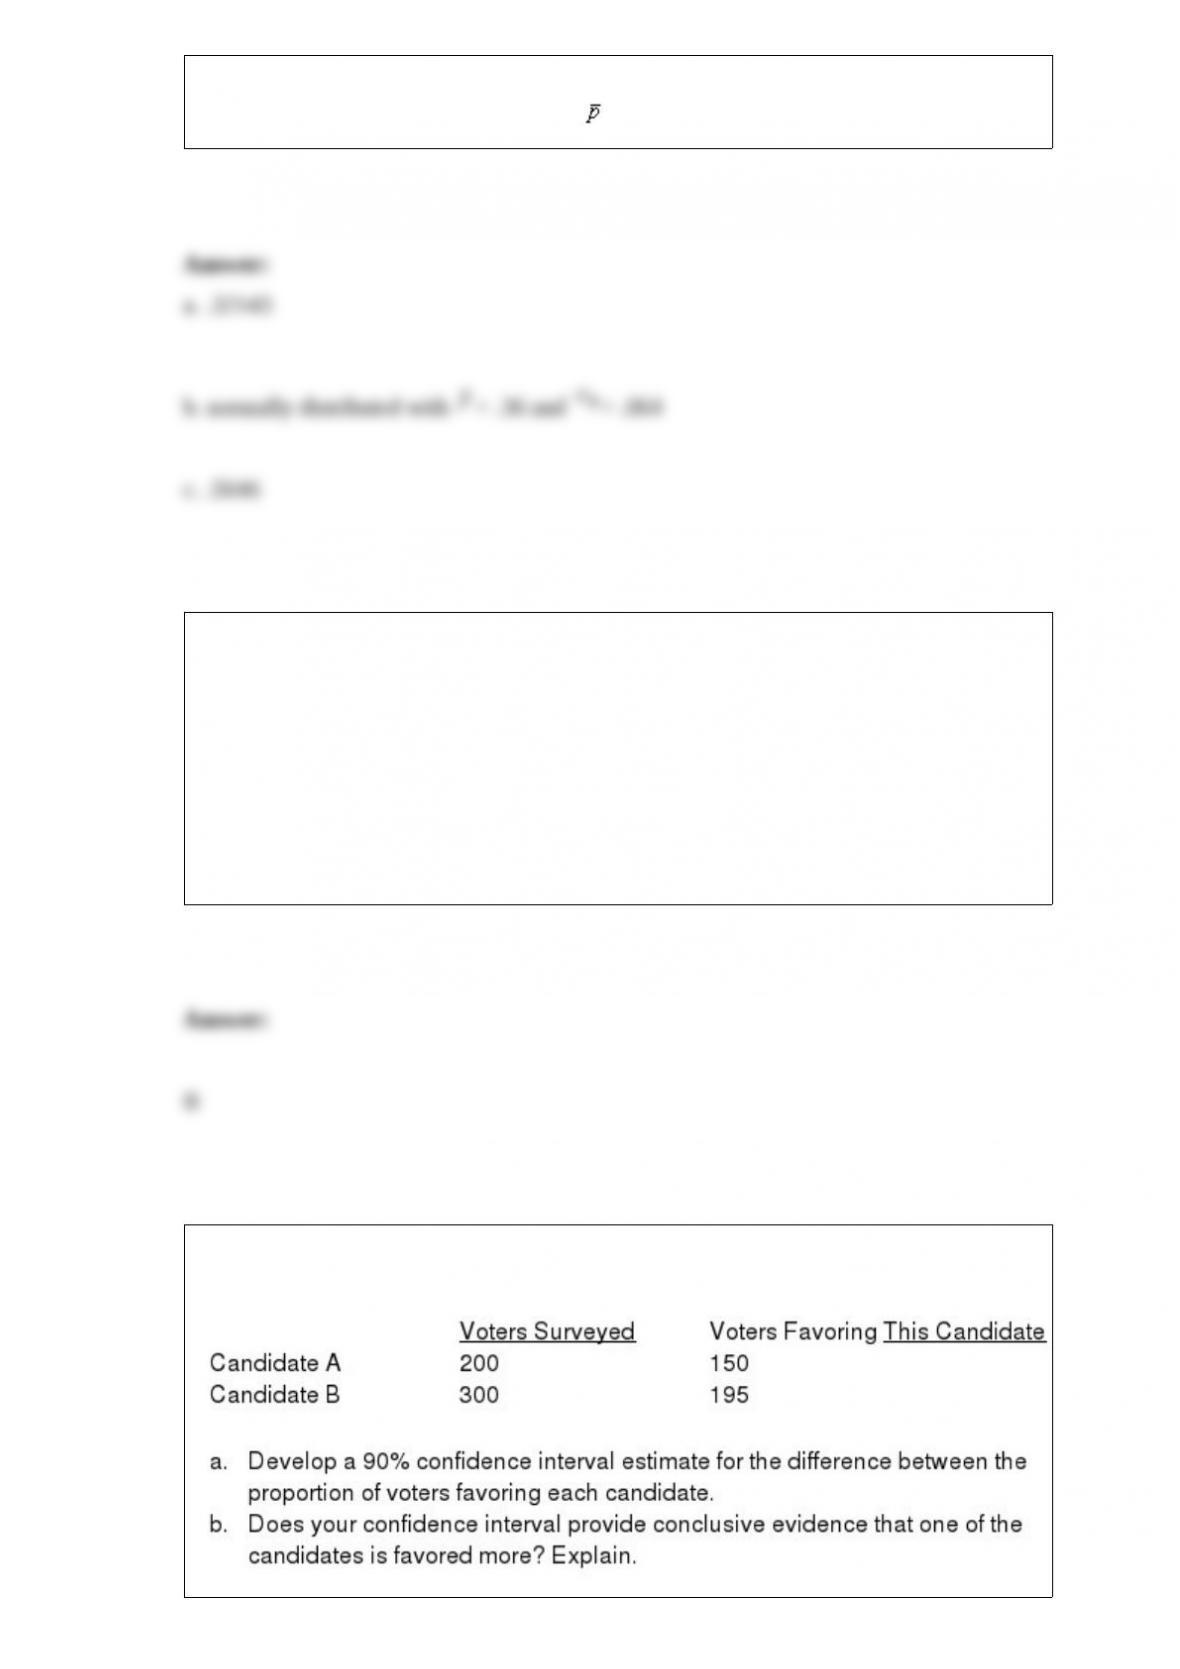
The results of a recent poll on the preference of voters regarding the presidential
candidates are shown below.
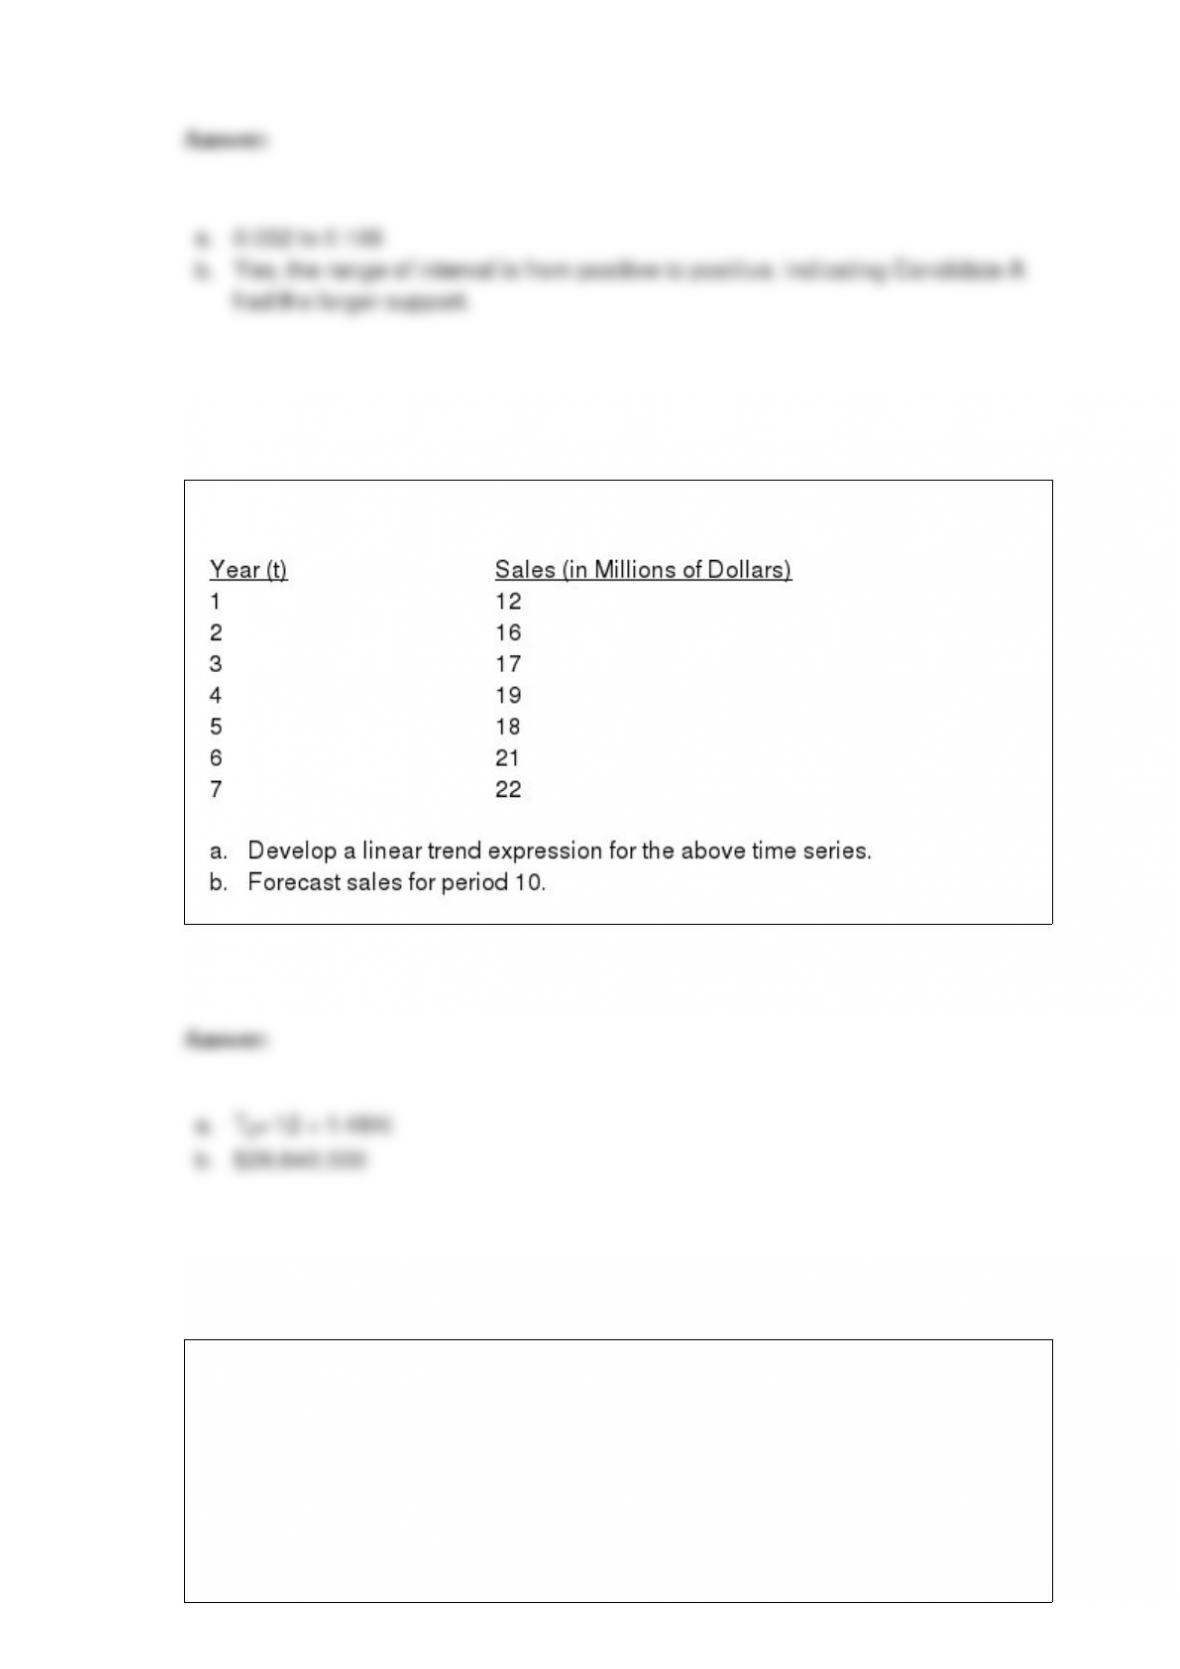
The sales records of a company over a period of seven years are shown below.
The advertised weight on a can of soup is 10 ounces. The actual weight in the cans
follows a uniform distribution and varies between 9.3 and 10.3 ounces.
a. Give the mathematical expression for the probability density function.
b. What is the probability that a can of soup will have between 9.4 and 10.3 ounces?
c. What is the mean weight of a can of soup?

d. What is the standard deviation of the weight?
In Excel, which of the following functions is used to construct a confidence interval for
a population variance?
a. CHISQ.DIST
b. F-Test
c. CHI.INV
d. None of these answers are correct.