The standard deviation of is referred to as the
a. standard x
b. standard error of the mean
c. sample standard mean
d. sample mean deviation
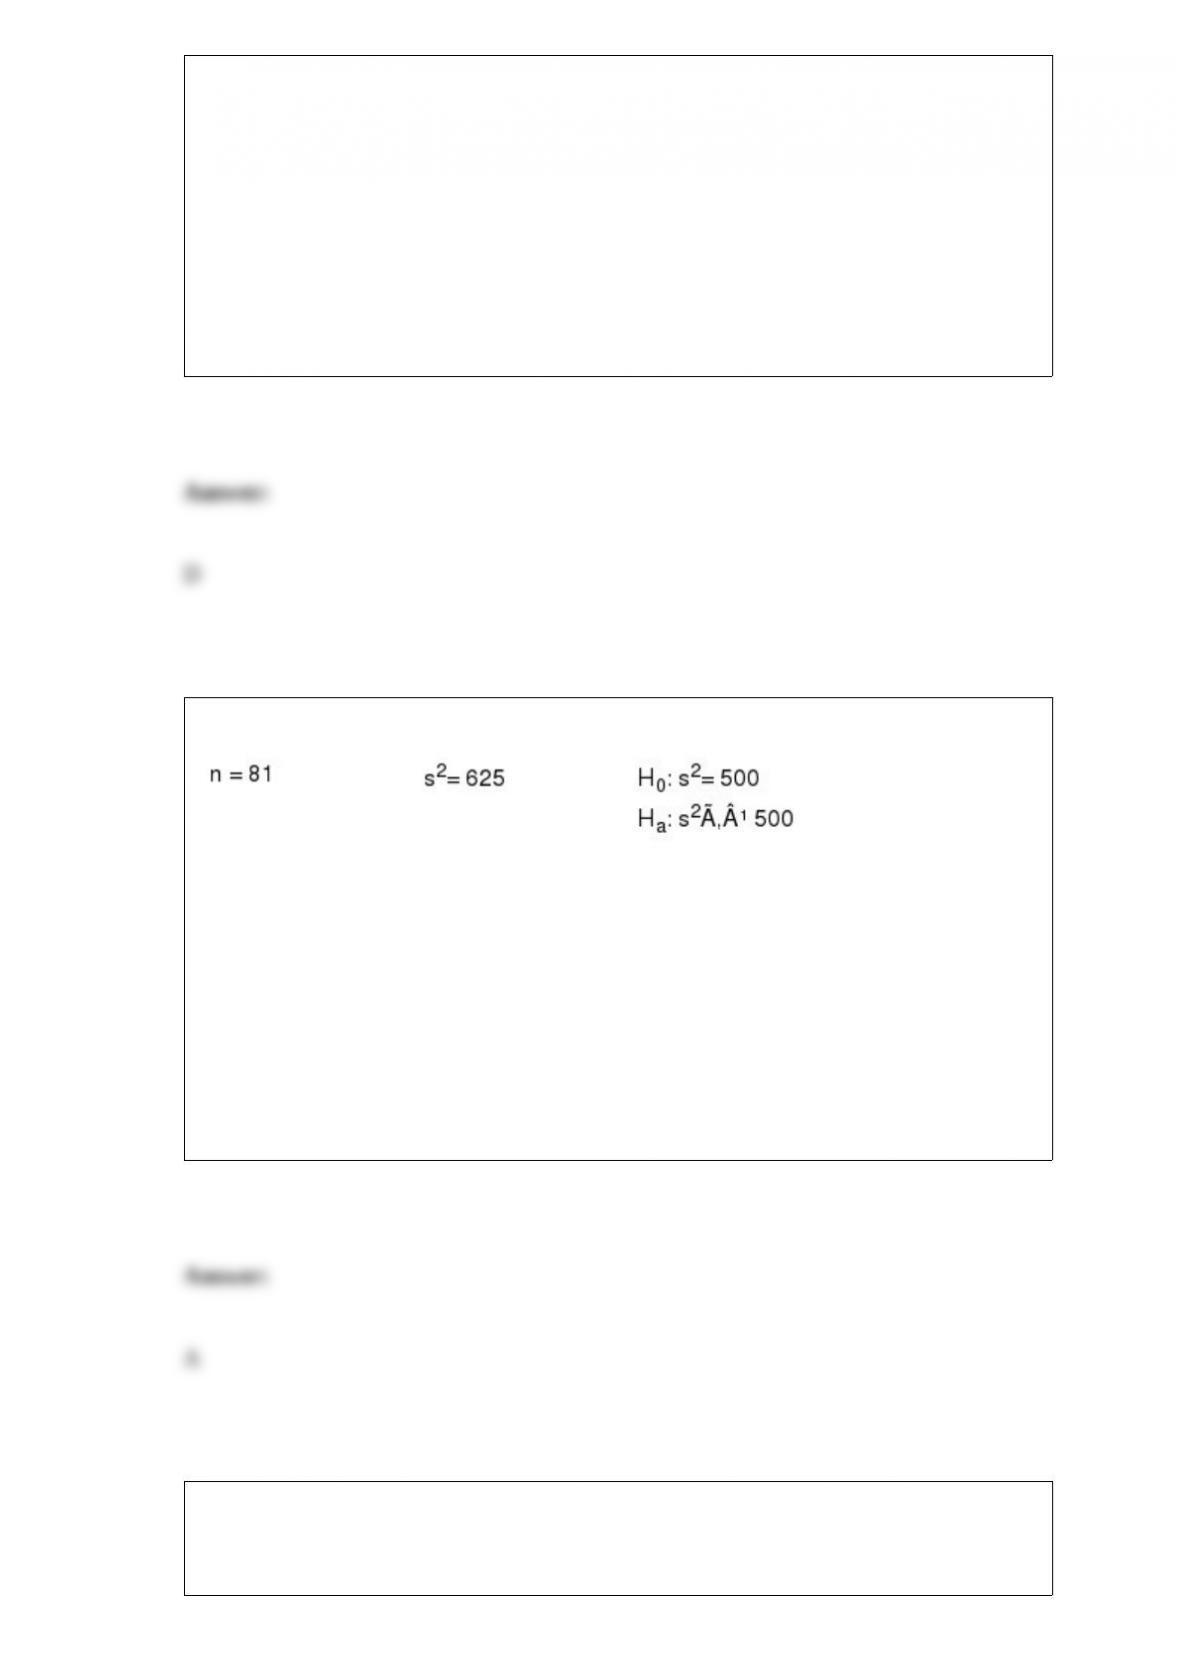
Exhibit 10-1
Salary information regarding male and female employees of a large company is shown
below.
Refer to Exhibit 10-1. The point estimate of the difference between the means of the
two populations is
a. -28
b. 3
c. 4
d. -4

There is a lower limit but no upper limit for a random variable that follows the
a. uniform probability distribution
b. normal probability distribution
c. exponential probability distribution
d. binomial probability distribution
Excel’s BINOM.DIST function has how many inputs?
a. 2
b. 3
c. 4
d. 5
A common graphical display of quantitative data is a
a. histogram
b. bar chart
c. relative frequency
d. pie chart

Exhibit 21-3
From a population of size 600, a simple random sample of size 58 is selected. The
sample mean is 400, and the sample standard deviation is 40.
Refer to Exhibit 21-3. An estimate of the standard error of the mean is
a. 4.0
b. 5.0
c. 6.0
d. 7.0
The control limits for an x-bar chart are how many standard deviations above and below
the process mean?
a. one
b. two
c. three
d. four
In a multiple regression analysis SSR = 1,000 and SSE = 200. The F statistic for this
model is
a. 5.0
b. 1,200
c. 800
d. Not enough information is provided to answer this question.
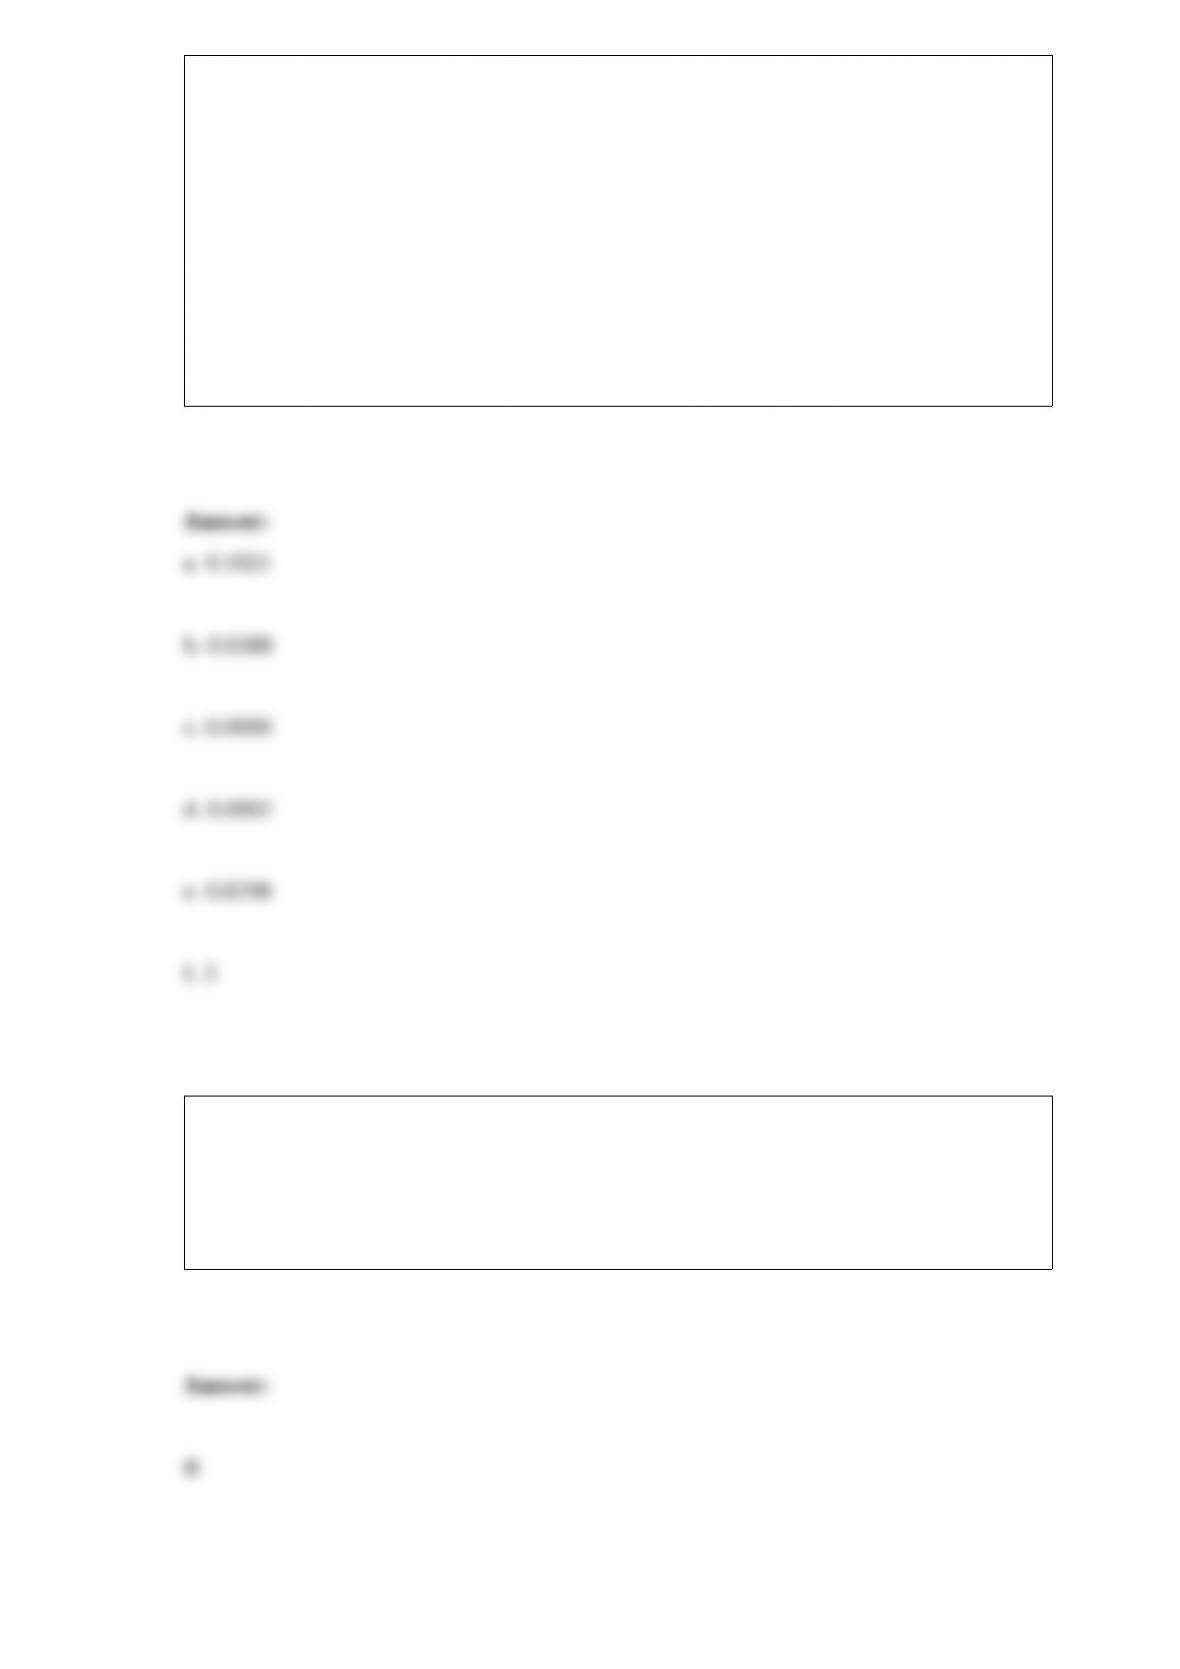
Exhibit 11-10
Refer to Exhibit 11-10. The test statistic for this problem equals
a. 100
b. 101.88
c. 101.25
d. 64
In a large university, 15% of the students are female. If a random sample of twenty
students is selected,
a. what is the probability that the sample contains exactly four female students?
b. what is the probability that the sample will contain no female students?
c. what is the probability that the sample will contain exactly twenty female students?
d. what is the probability that the sample will contain more than nine female students?
e. what is the probability that the sample will contain fewer than five female students?
f. what is the expected number of female students?
Excel’s __________ function can be used to compute the population covariance.
a. MAX
b. COVAR
c. VAR
d. CORREL
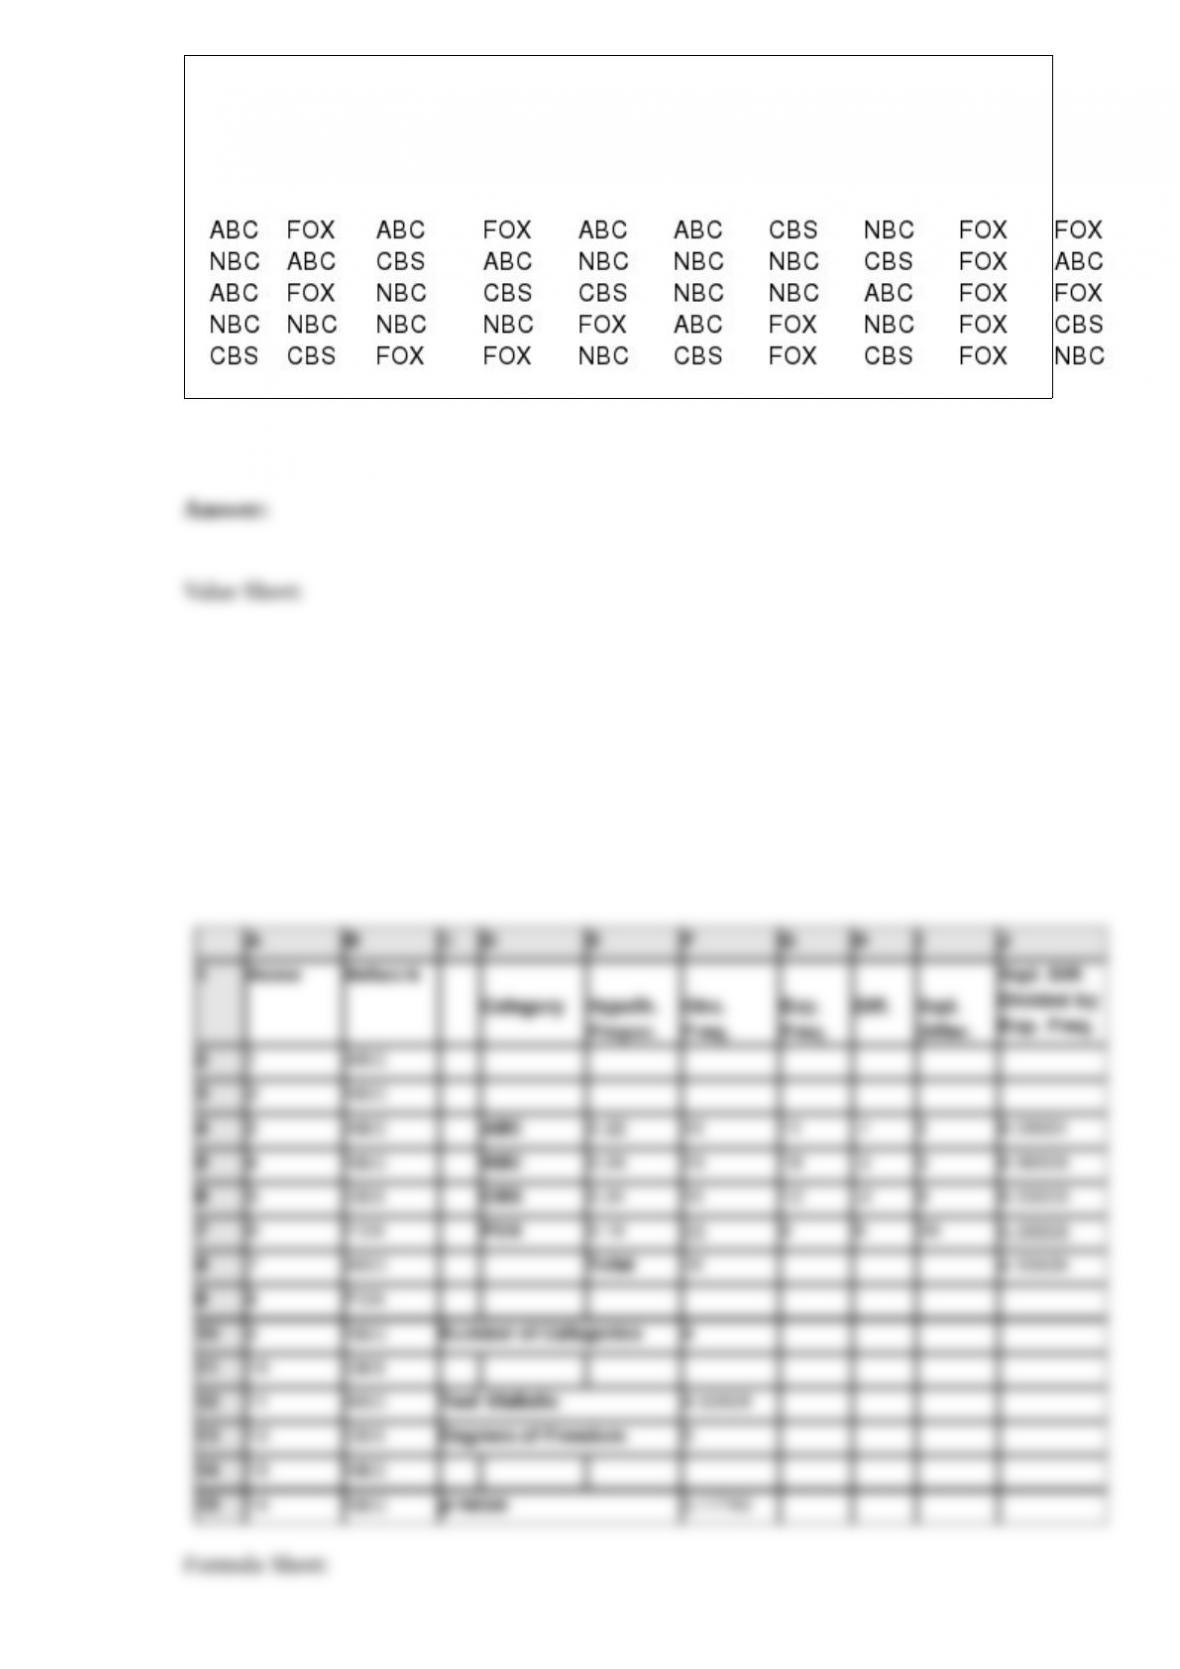
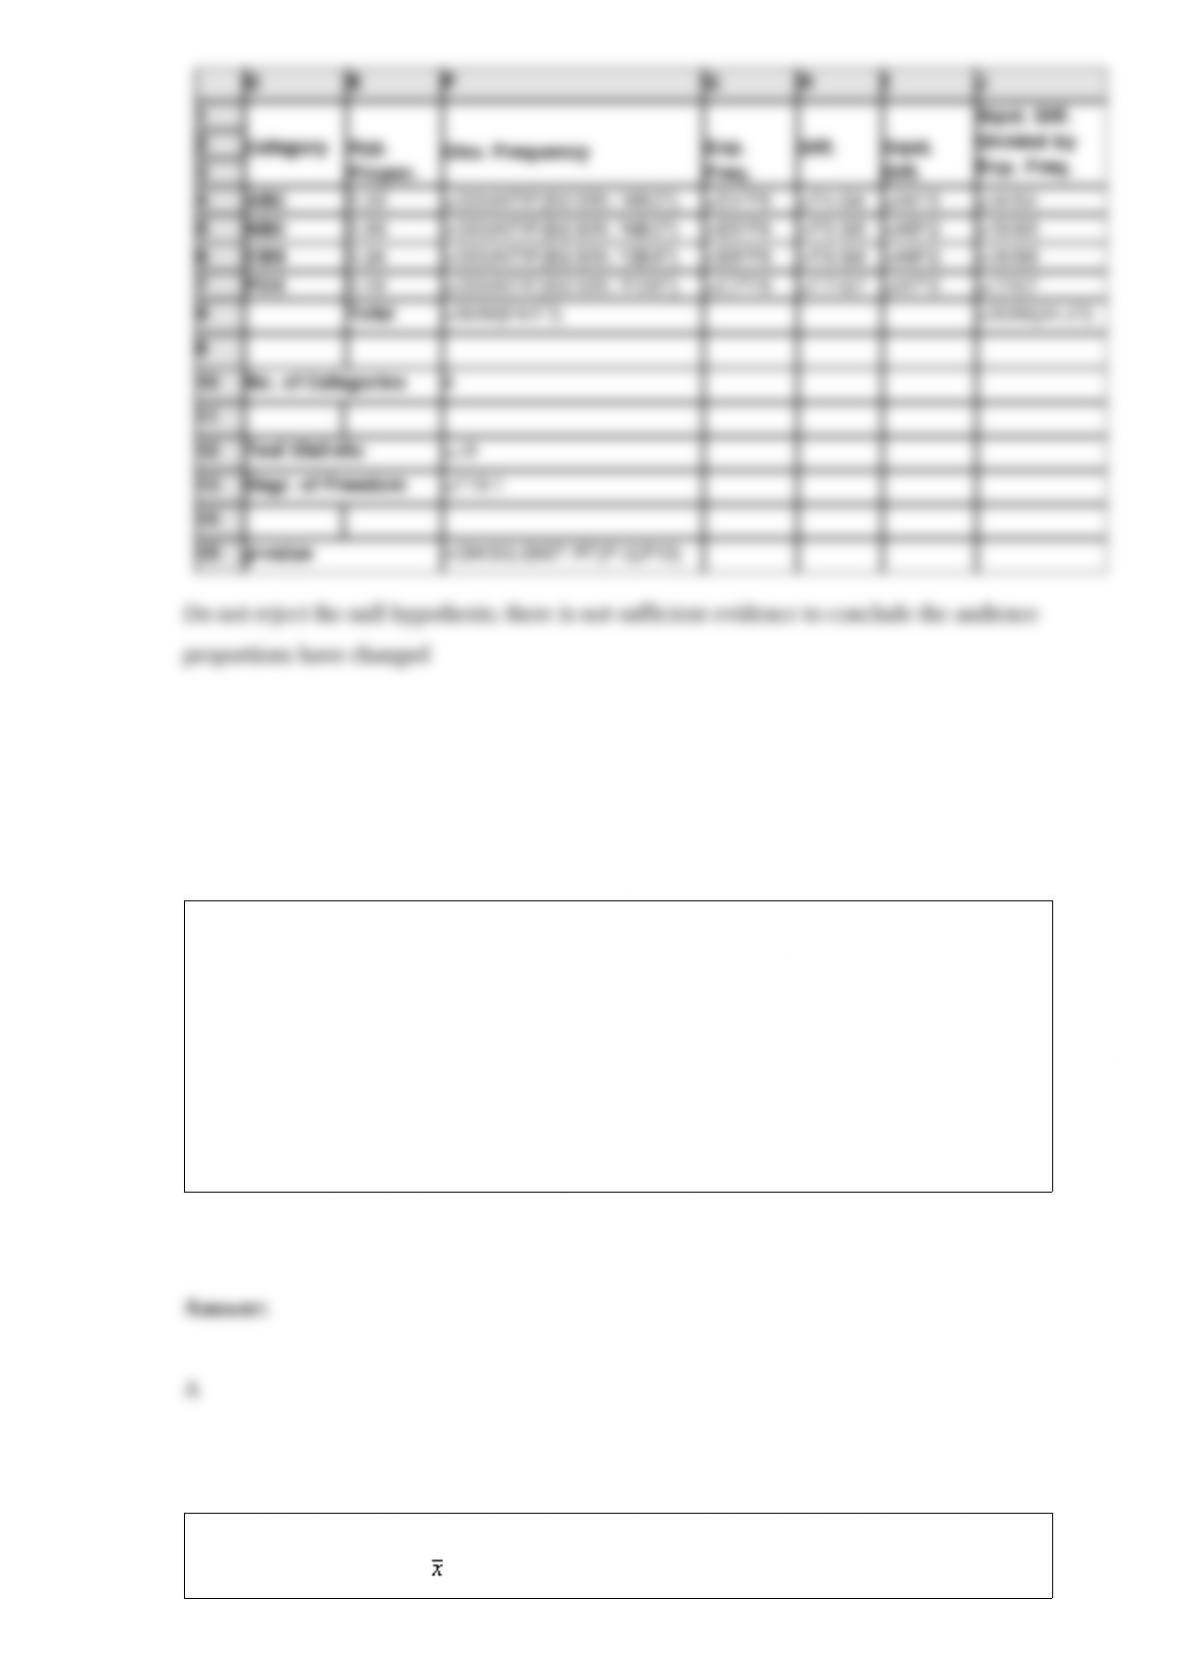
During ‘sweeps week” last year, the viewing audience was distributed as follows: 36%
NBC, 22% ABC, and 24% CBS, and 18% FOX. This year during ‘sweeps week” a
sample of 50 homes yielded the following data. Use Excel to test at = .05 to
determine if the audience proportions have changed.
Categorical data use either the ______ or ______ scale of measurement.
a. nominal, ordinal
b. nominal, interval
c. ordinal, interval
d. interval, ratio
A sample of 92 observations is taken from a process (an infinite population). The
sampling distribution of is approximately normal because
a. is always approximately normally distributed
b. the sample size is small in comparison to the population size
c. of the central limit theorem
d. None of the alternative answers is correct.
A(n) __________ is a collection of sample points.
a. probability
b. permutation
c. experiment
d. event
When the hypotheses H0: 100 and Ha: 100 are being tested at a level of
significance of , the null hypothesis will be rejected if the test statistic z is
a. > z
b. > –z
c. < –z
d. < 100
If P(A) 0.50, P(B) 0.60, and P(A ‡ B) 0.30; then events A and B are
a. mutually exclusive events
b. not independent events
c. independent events
d. Not enough information is given to answer this question.
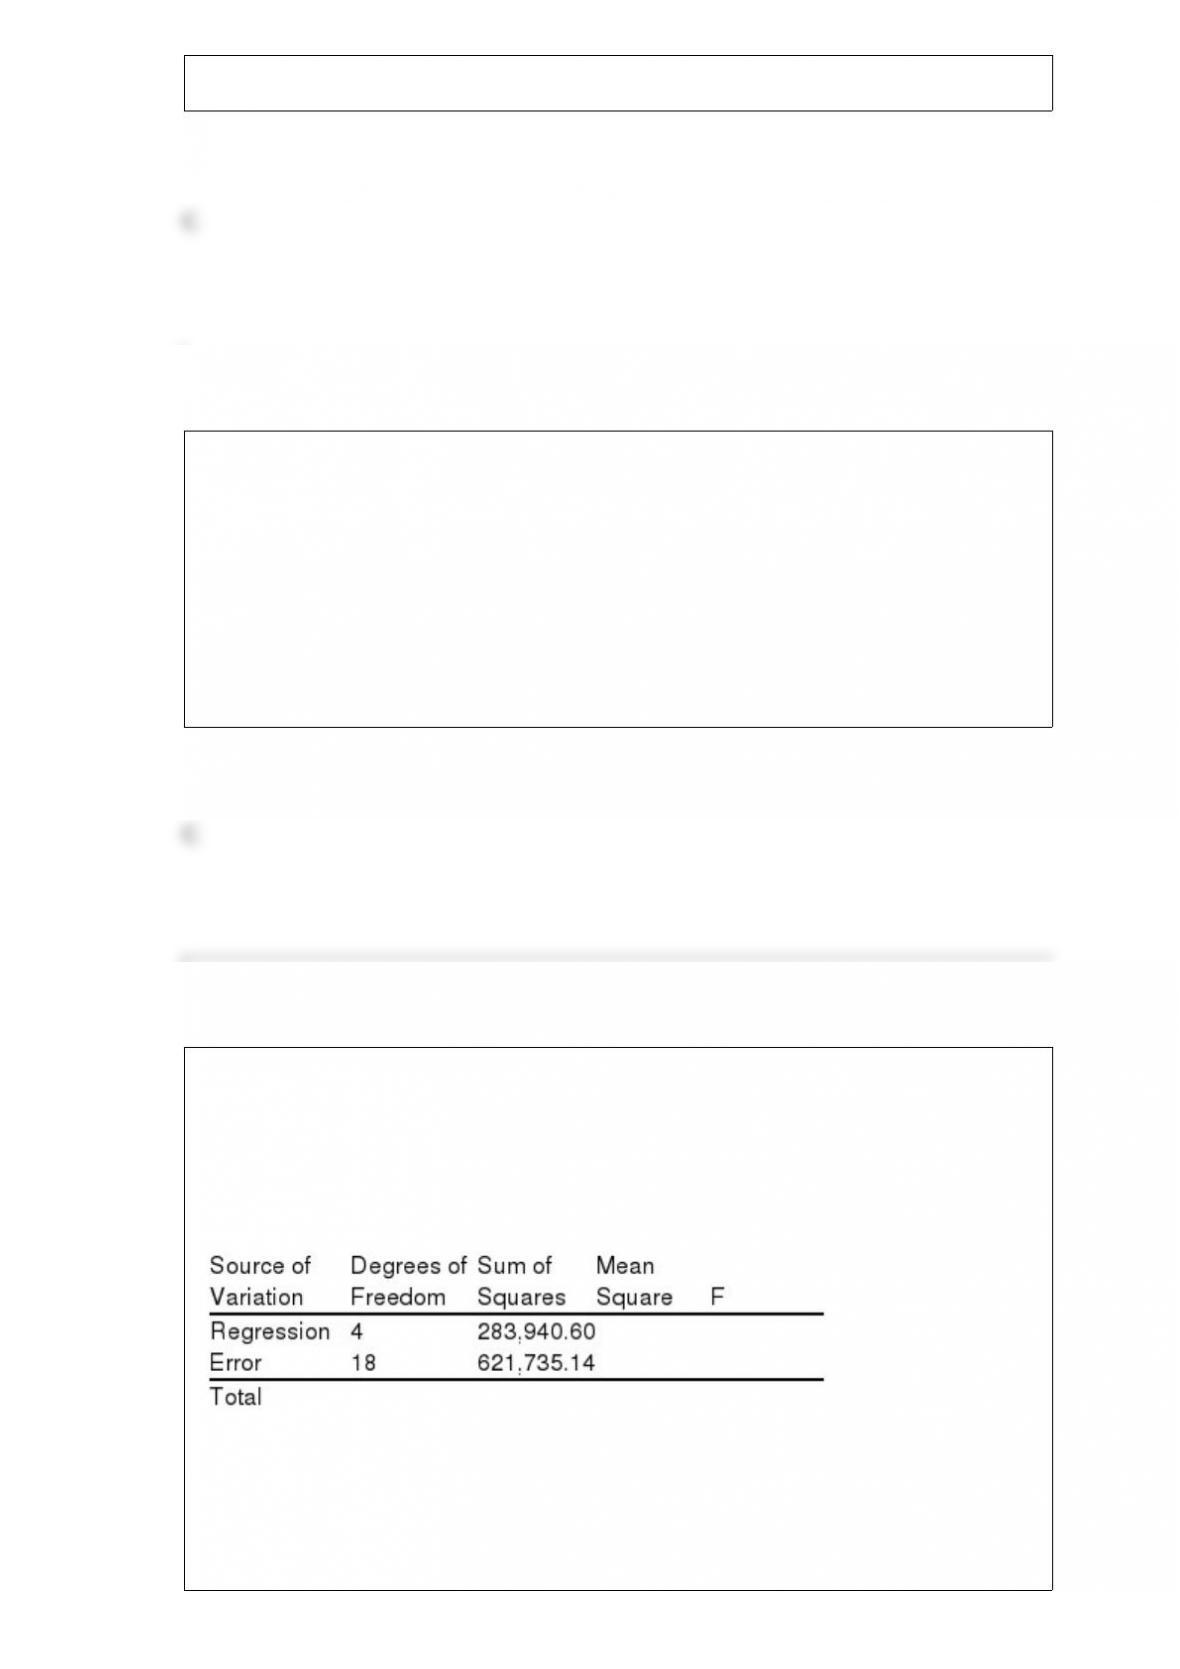
The Very Fresh Juice Company has developed a regression model relating sales (y in
$10,000s) with four independent variables. The four independent variables are price per
unit (x1, in dollars), competitor’s price (x2, in dollars), advertising (x3, in $1,000s) and
type of container used (x4) (1 = Cans and 0 = Bottles). Part of the regression results are
shown below:
a. Compute the coefficient of determination and fully interpret its meaning.
b. Is the regression model significant? Explain what your answer implies. Let = 0.05.
c. What has been the sample size for this analysis?
A graphical method of representing the sample points of a multiple-step experiment is
a. a frequency polygon
b. a histogram
c. an ogive
d. a tree diagram
Exhibit 5-9
Forty percent of all registered voters in a national election are female. A random sample
of 5 voters is selected.
Refer to Exhibit 5-9. What is the random variable in this experiment?
a. the 40% of female registered voters
b. the random sample of 5 voters
c. the number of female voters out of 5

d. the number of registered voters in the nation