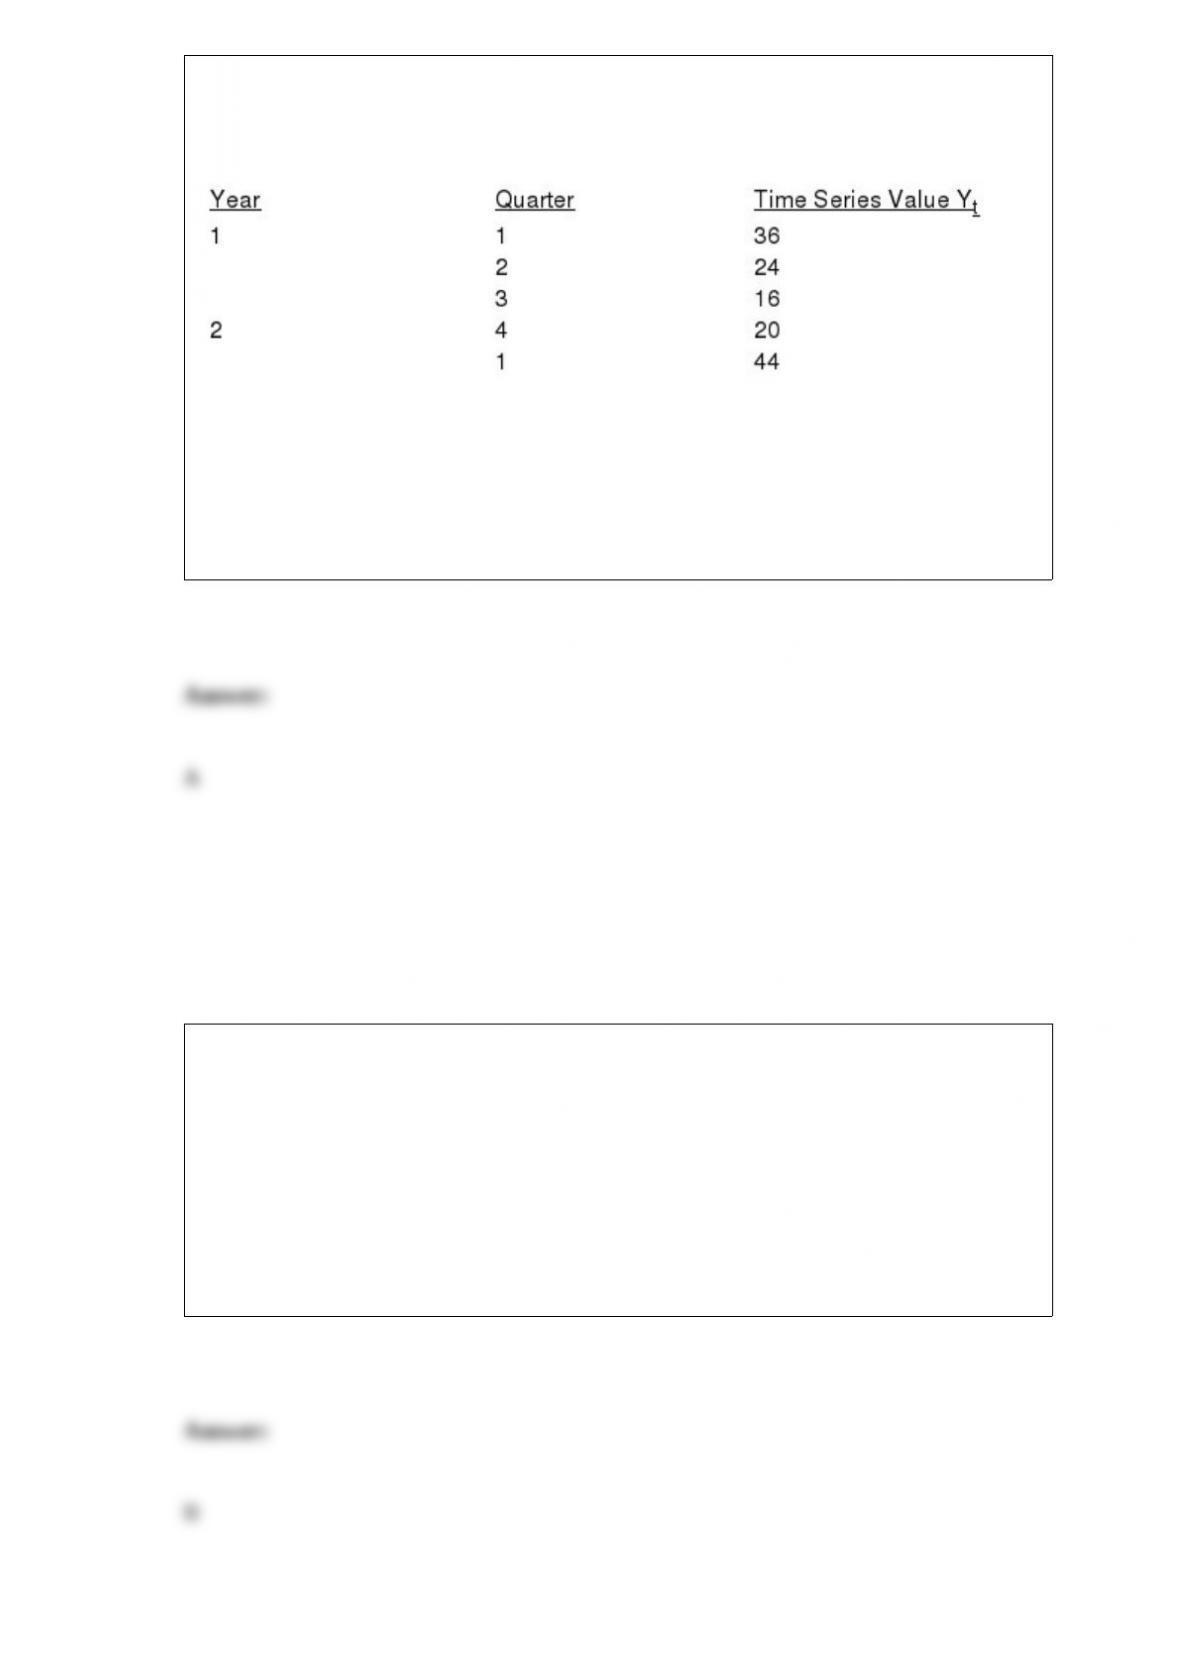
Exhibit 17-1
Below you are given the first five values of a quarterly time series. The multiplicative
model is appropriate and a four-quarter moving average will be used.
Refer to Exhibit 17-1. An estimate of the seasonal-irregular component for Quarter 3 of
Year 1 is
a. .64
b. 1.5625
c. 5.333
d. 30
For a uniform probability density function, the height of the function
a. cannot be larger than one
b. is the same for each value of x
c. is different for various values of x
d. decreases as x increases
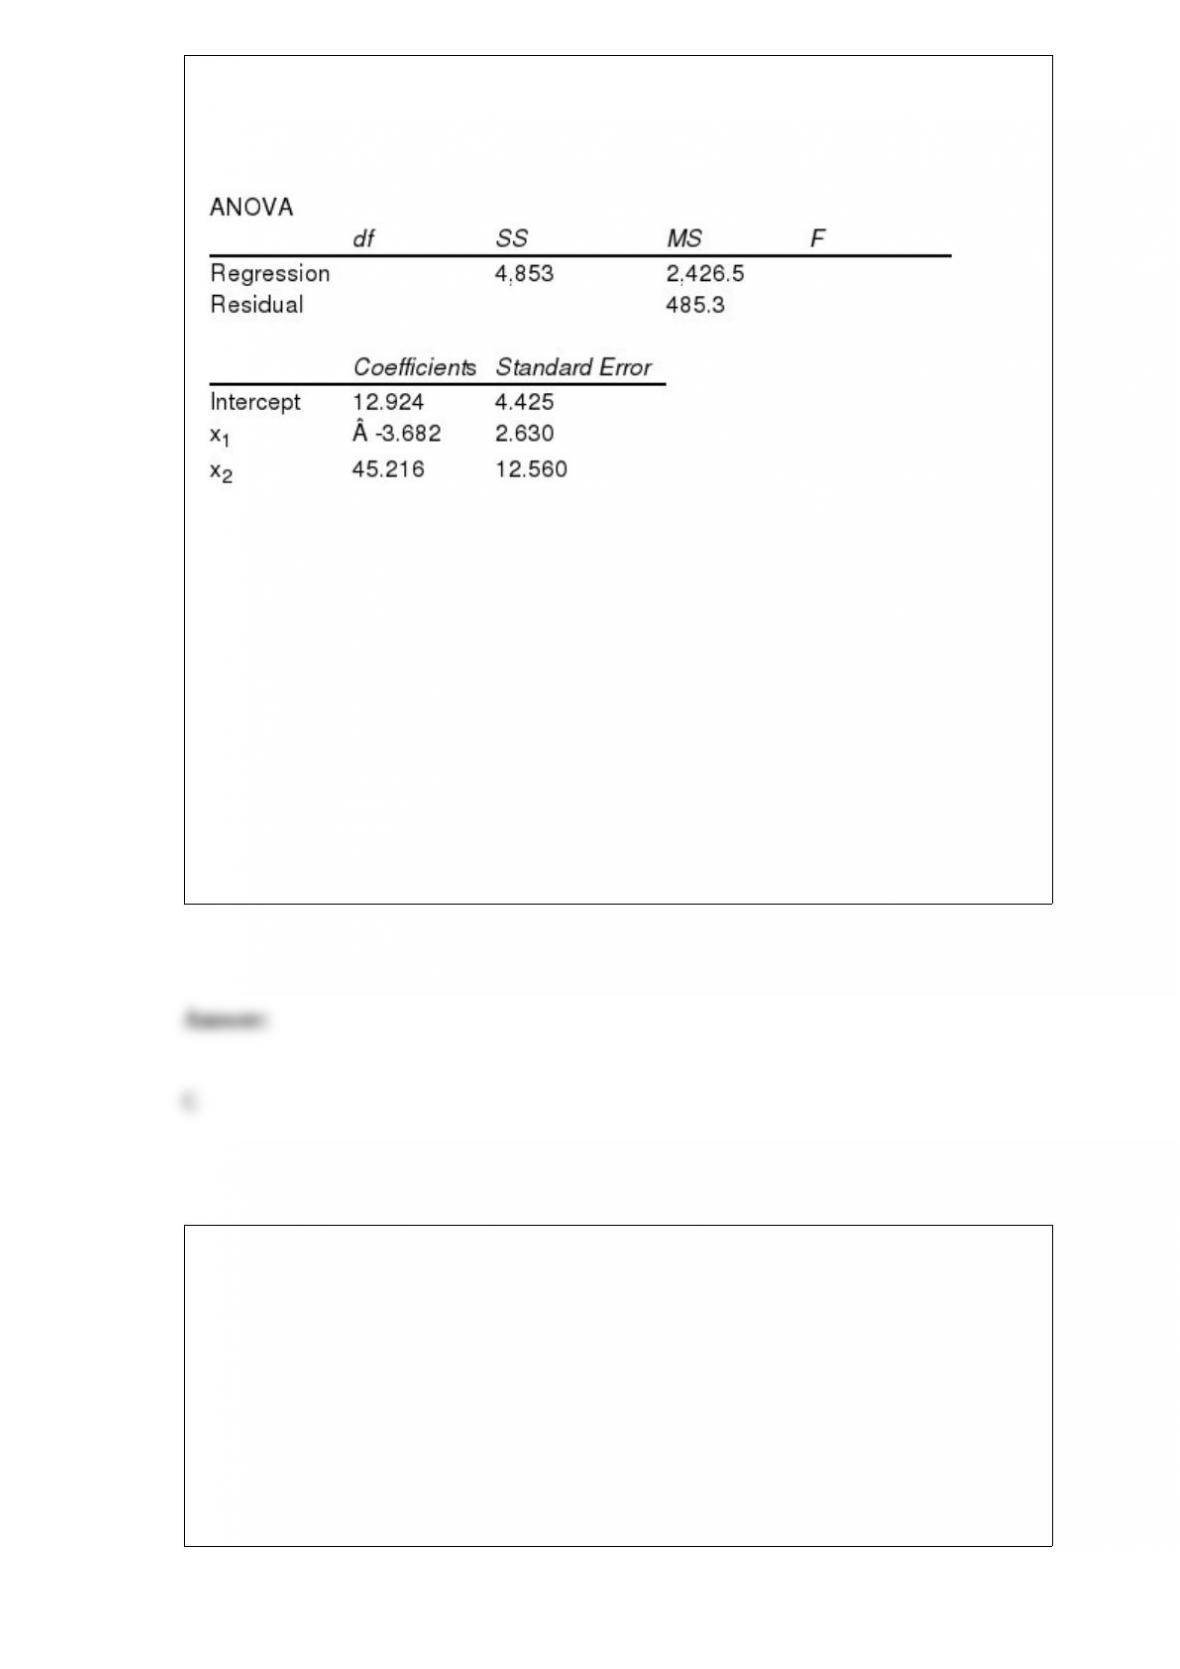
Exhibit 15-6
Below you are given a partial Excel output based on a sample of 16 observations.
Refer to Exhibit 15-6. The interpretation of the coefficient of x1 is that
a. a one unit change in x1 will lead to a 3.682 unit decrease in y
b. a one unit increase in x1 will lead to a 3.682 unit decrease in y when all other
variables are held constant
c. a one unit increase in x1 will lead to a 3.682 unit decrease in x2 when all other
variables are held constant
d. It is impossible to interpret the coefficient.
The model that assumes that the actual time series value is the product of its
components is the
a. linear trend regression model
b. multiplicative decomposition model
c. additive time series model
d. weighted moving average model
In multiple regression analysis, the general linear model
a. cannot be used to accommodate curvilinear relationships between dependent
variables and independent variables
b. can be used to accommodate curvilinear relationships between the independent
variables and dependent variable
c. must contain more than 2 independent variables
d. None of these alternatives is correct.
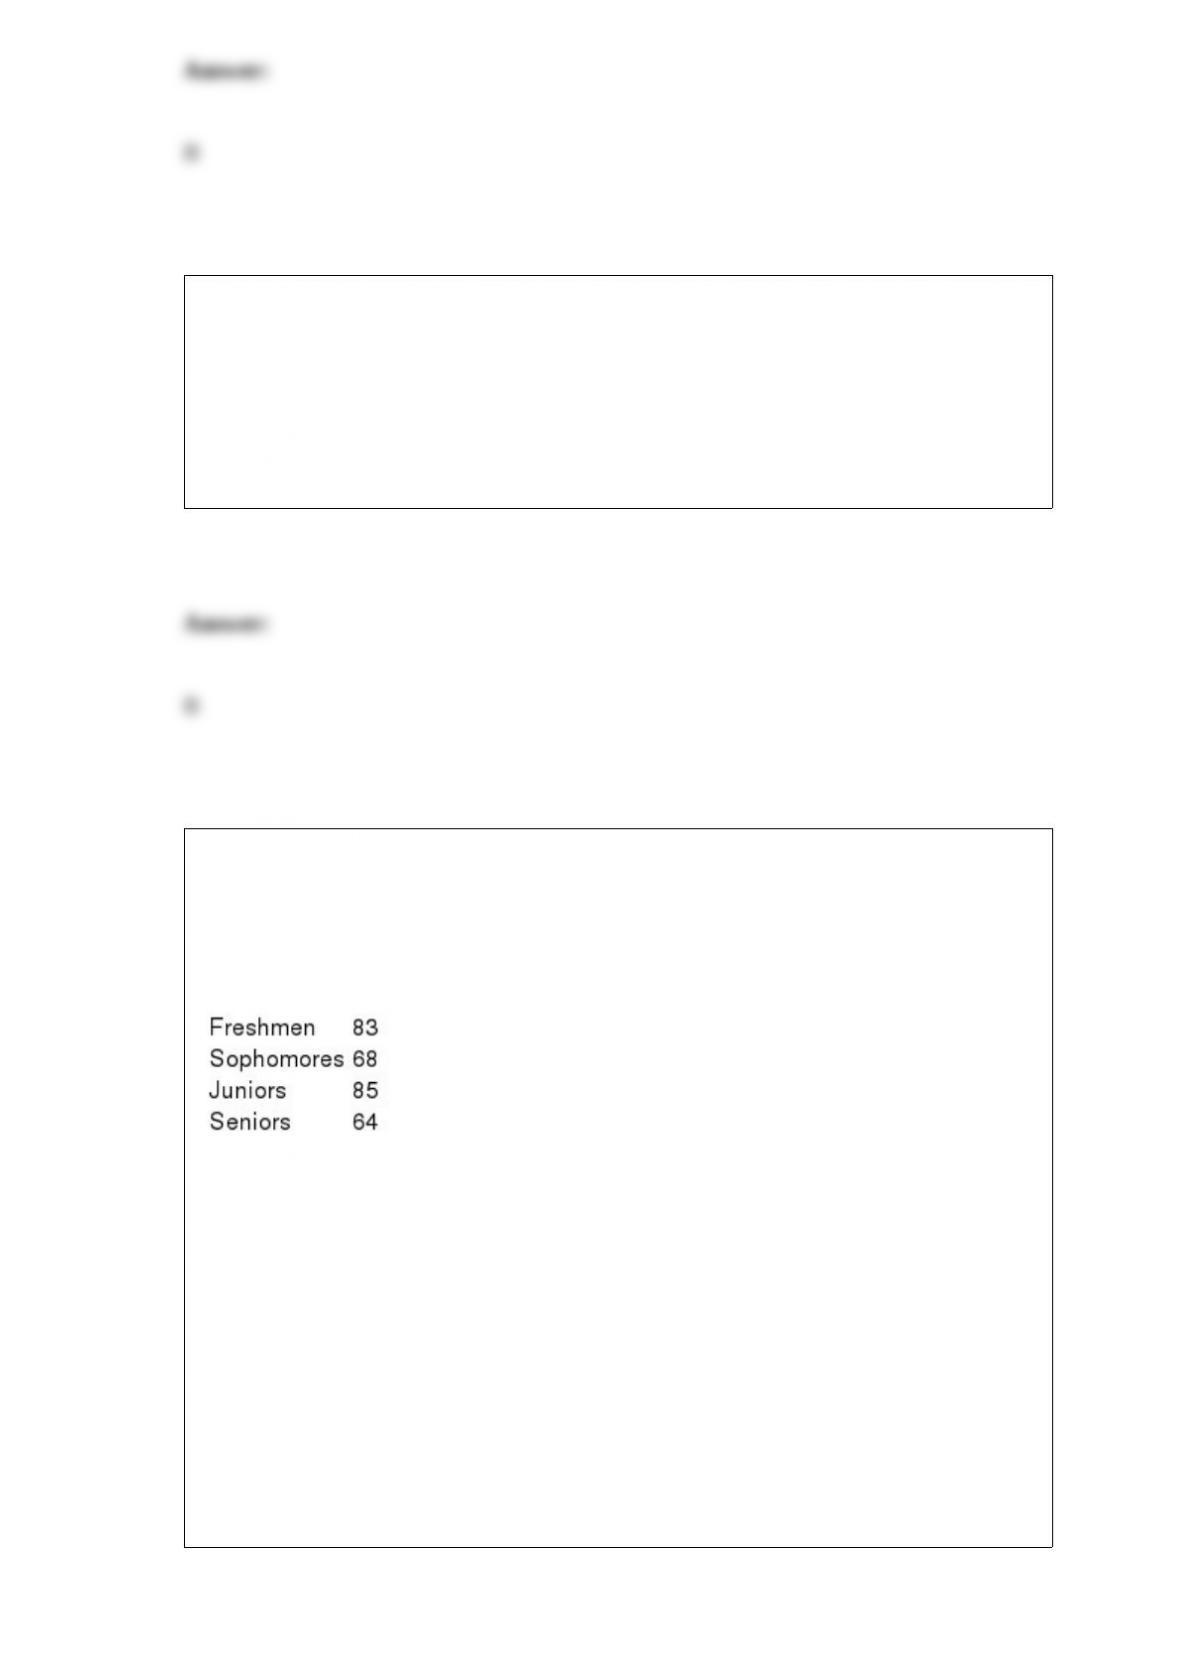
Exhibit 12-2
Last school year, the student body of a local university consisted of 30% freshmen, 24%
sophomores, 26% juniors, and 20% seniors. A sample of 300 students taken from this
year’s student body showed the following number of students in each classification.
We are interested in determining whether or not there has been a significant change in
the classifications between the last school year and this school year.
Refer to Exhibit 12-2. The null hypothesis
a. should not be rejected
b. should be rejected
c. was designed wrong
d. None of these alternatives is correct.

Which of the following descriptive statistics is not measured in the same units as the
data?
a. 35th percentile
b. standard deviation
c. variance
d. interquartile range
Larger values of r2 imply that the observations are more closely grouped about the
a. average value of the independent variables
b. average value of the dependent variable
c. least squares line
d. origin
The sampling distribution of the ratio of two independent sample variances taken from
normal populations with equal variances is
a. an F distribution
b. a chi-square distribution
c. a t distribution
d. a normal distribution
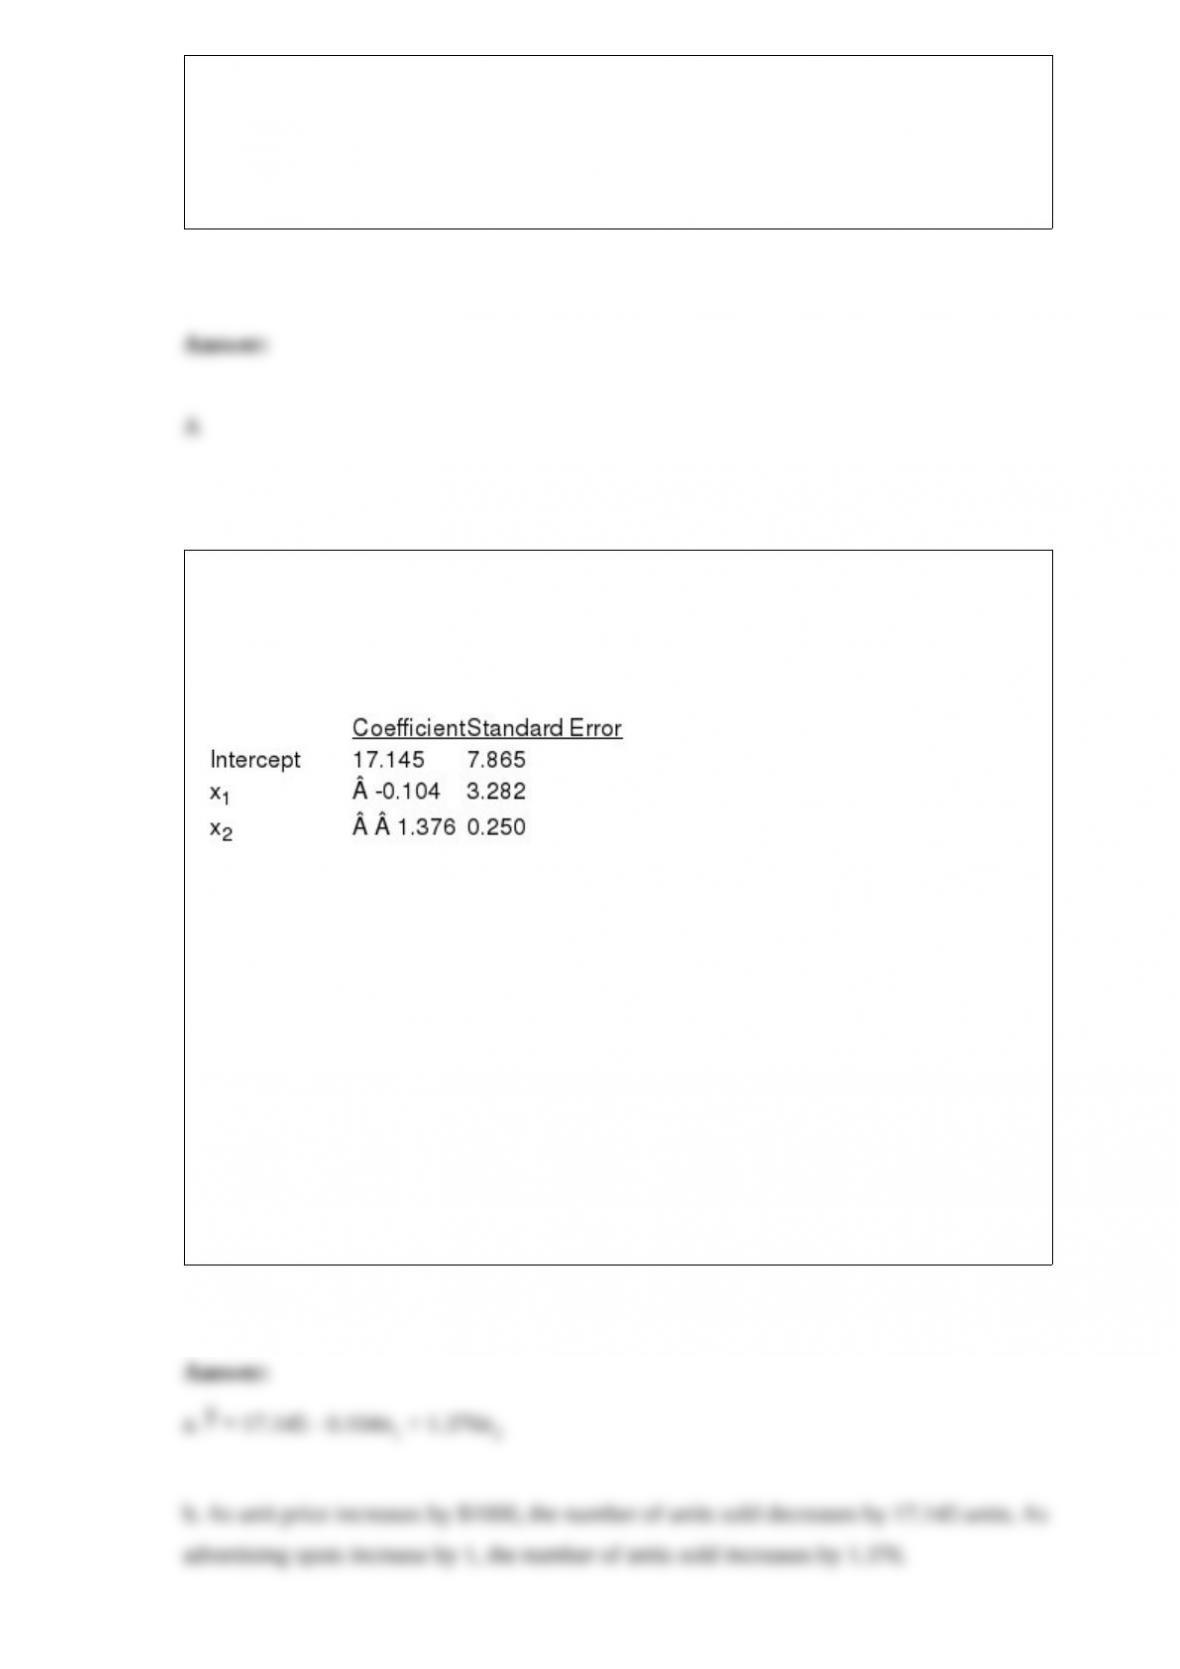
Below you are given a partial Excel output based on a sample of 12 observations
relating the number of personal computers sold by a computer shop per month (y), unit
price (x1 in $1,000) and the number of advertising spots (x2) used on a local television
station.
a. Use the output shown above and write an equation that can be used to predict the
monthly sales of computers.
b. Interpret the coefficients of the estimated regression equation found in Part a.
c. If the company charges $2,000 for each computer and uses 10 advertising spots, how
many computers would you expect them to sell?
d. At = 0.05, test to determine if the price is a significant variable.
e. At = 0.05, test to determine if the number of advertising spots is a significant
variable.

To construct a pie chart using Excel’s Chart Tools, choose __________ as the chart
type.
a. column
b. pie
c. scatter
d. line
The t distribution should be used whenever
a. the sample size is less than 30
b. the sample standard deviation is used to estimate the population standard deviation
c. the population is not normally distributed
d. None of the other answers are correct.
A continuous random variable is uniformly distributed between a and b. The probability

density function between a and b is
a. zero
b. (a b)
c. (b a)
d. 1/(b a)
The 99% confidence interval estimate for a population variance when a sample standard
deviation of 12 is obtained from a sample of 10 items is
a. 4.58 to 62.25
b. 46.53 to 422.17
c. 54.94 to 747.01
d. 62.04 to 562.89
Statistical inference
a. refers to the process of drawing inferences about the sample based on the
characteristics of the population
b. is the same as descriptive statistics
c. is the process of drawing inferences about the population based on the information
taken from the sample
d. is the same as a census
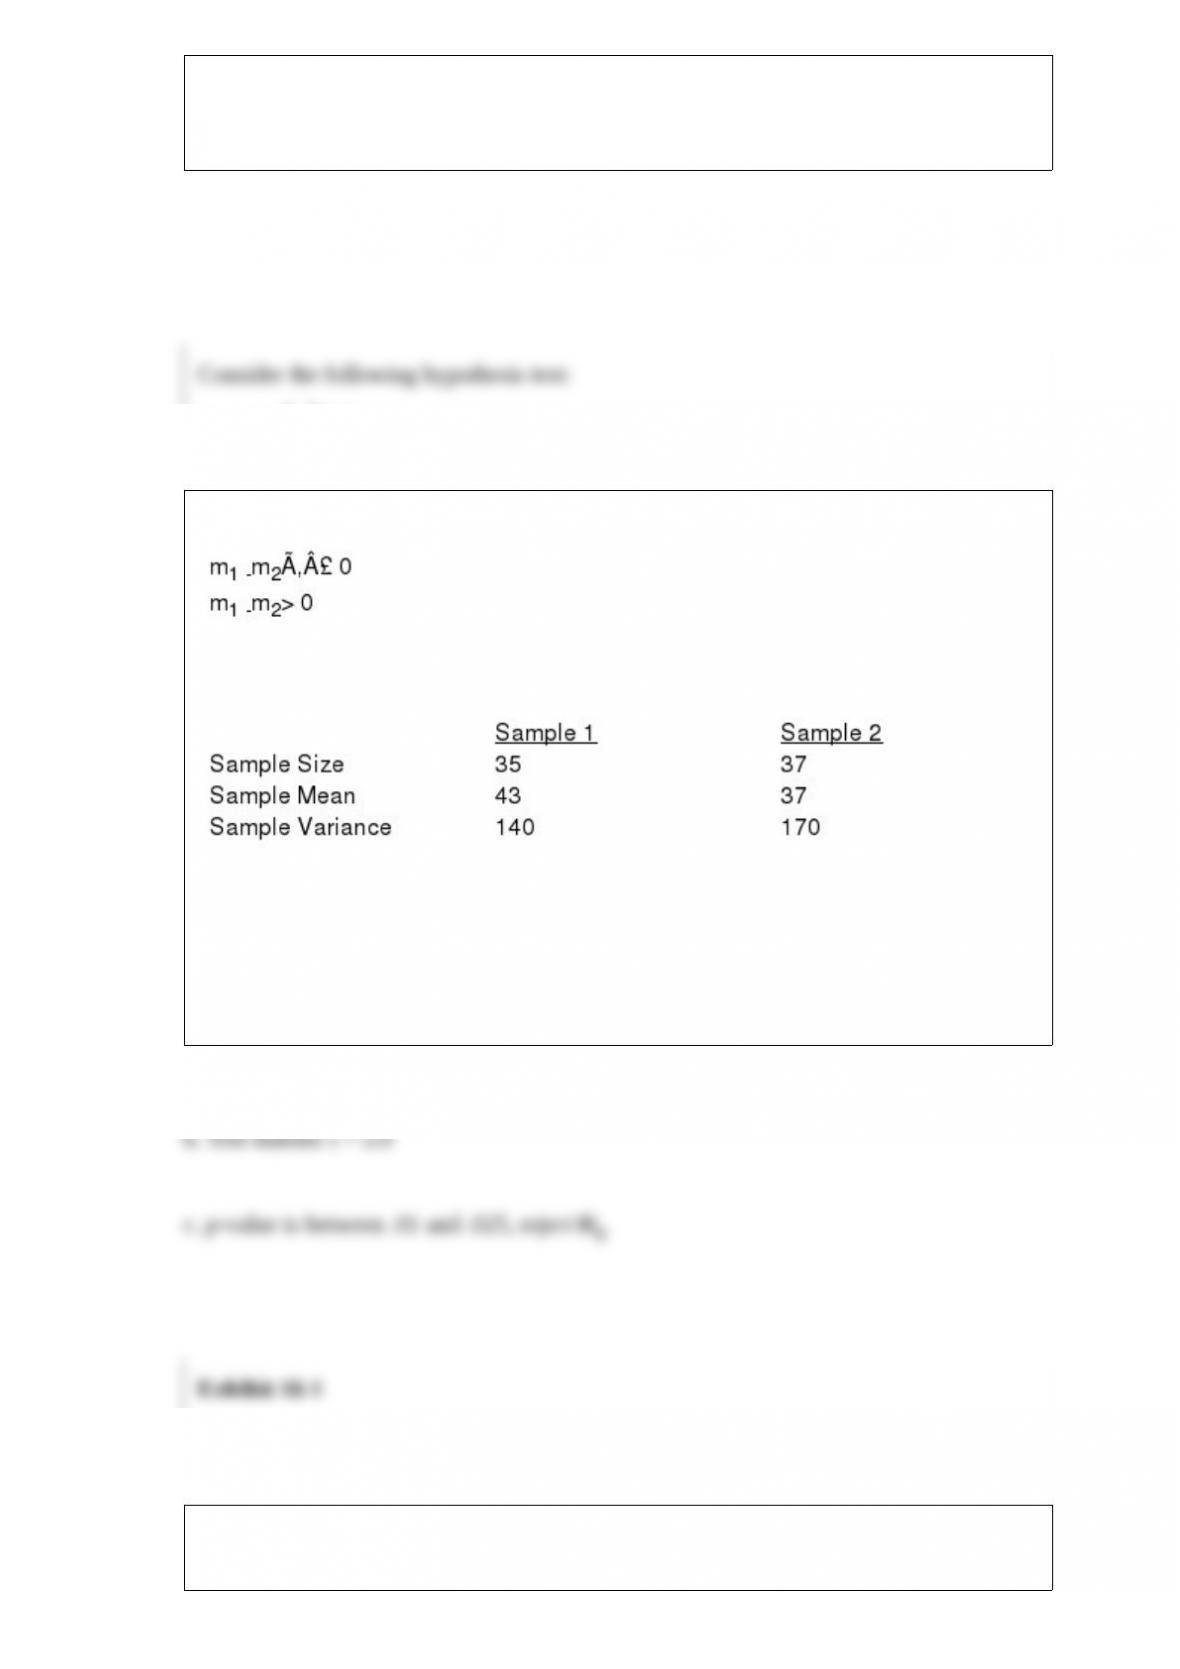
Consider the following hypothesis test:
The following results are for two independent samples taken from two populations.
a. Determine the degrees of freedom for the t distribution.
b. Compute the test statistic.
c. Determine the p-value and test the above hypotheses.
Exhibit 16-1

In a regression analysis involving 25 observations, the following estimated regression
equation was developed.
= 10 – 18x1 + 3x2 + 14x3
Also, the following standard errors and the sum of squares were obtained.
Sb1 = 3 Sb2 = 6 Sb3 = 7
SST = 4,800 SSE = 1,296
Refer to Exhibit 16-1. If you want to determine whether or not the coefficients of the
independent variables are significant, the critical value of t statistic at = 0.05 is
a. 2.080
b. 2.060
c. 2.064
d. 1.96
Which of the following is not a characteristic of the normal probability distribution?
a. The graph of the curve is the shape of a rectangle
b. The total area under the curve is always equal to 1.
c. 99.72% of the time the random variable assumes a value within plus or minus three
standard deviations of its mean
d. The mean is equal to the median, which is also equal to the mode.
Exhibit 18-2
Students in statistics classes were asked whether they preferred a 10-minute break or to
get out of class 10 minutes early. In a sample of 150 students, 40 preferred a 10-minute
break, 80 preferred to get out 10 minutes early, and 30 had no preference. We want to
determine if there is a difference in students’ preferences.
Refer to Exhibit 18-2. To test the null hypothesis, the appropriate probability
distribution to use is the
a. normal
b. chi-square
c. t distribution
d. binomial
Forty-eight observations of a dependent variable (y) and five independent variables
resulted in an SSE of 438. When two additional independent variables were added to
the model, the SSE was reduced to 375. At a 5% level of significance, determine if the
two additional independent variables contribute significantly to the model.
In 2012, forty percent of the students at a major university were Business majors, 35%
were Engineering majors and the rest of the students were majoring in other fields. In a
sample of 600 students from the same university taken in 2013, two hundred were
Business majors, 220 were Engineering majors and the remaining students in the
sample were majoring in other fields. At a 5% significance level, test to see if there has
been a significant change in the proportions between 2012 and 2013.
A potential investor conducted a 144 day survey in each theater in order to determine
the difference between the average daily attendance at the North Mall and South Mall
theaters. The North Mall Theater averaged 630 patrons per day; while the South Mall
Theater averaged 598 patrons per day. From past information, it is known that the
variance for North Mall is 1,000; while the variance for the South Mall is 1,304.
Develop a 95% confidence interval for the difference between the average daily
attendance at the two theaters.
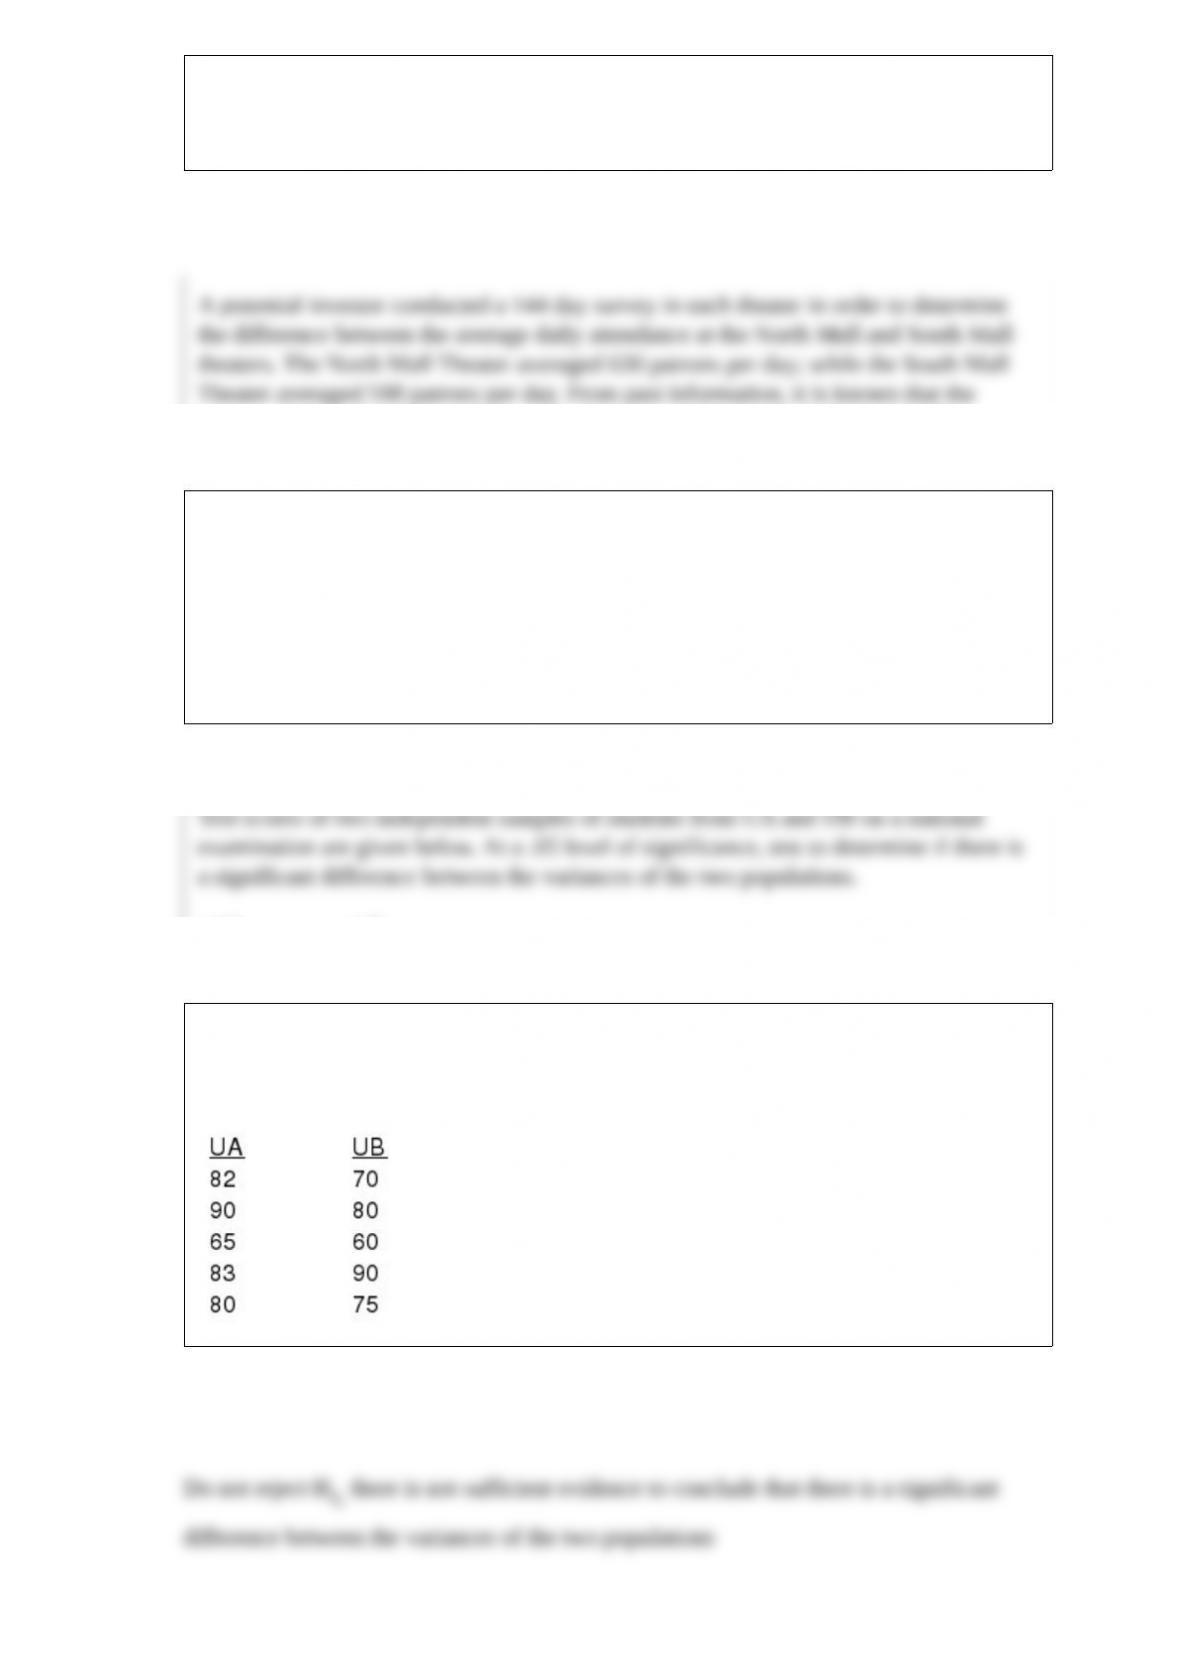
Test scores of two independent samples of students from UA and UB on a national
examination are given below. At a .05 level of significance, test to determine if there is
a significant difference between the variances of the two populations.
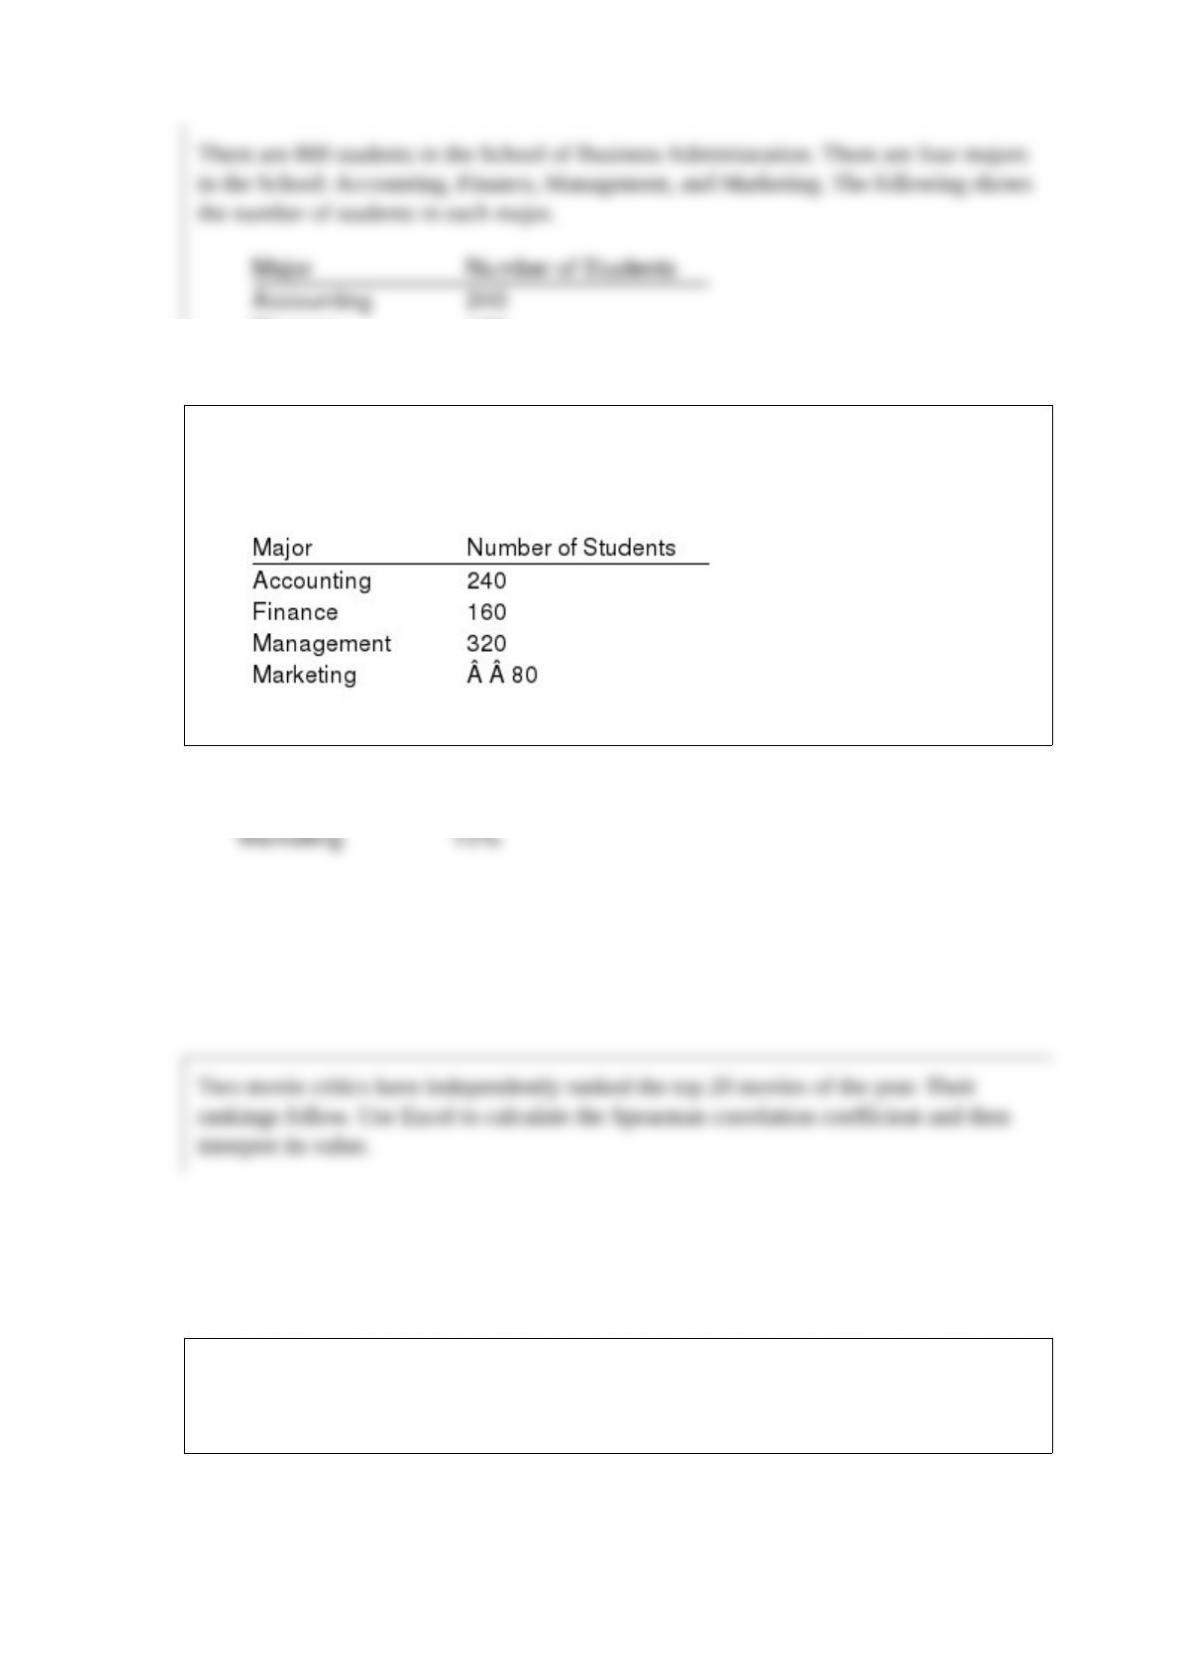
There are 800 students in the School of Business Administration. There are four majors
in the School: Accounting, Finance, Management, and Marketing. The following shows
the number of students in each major.
Develop a percent frequency distribution and construct a bar chart and a pie chart.
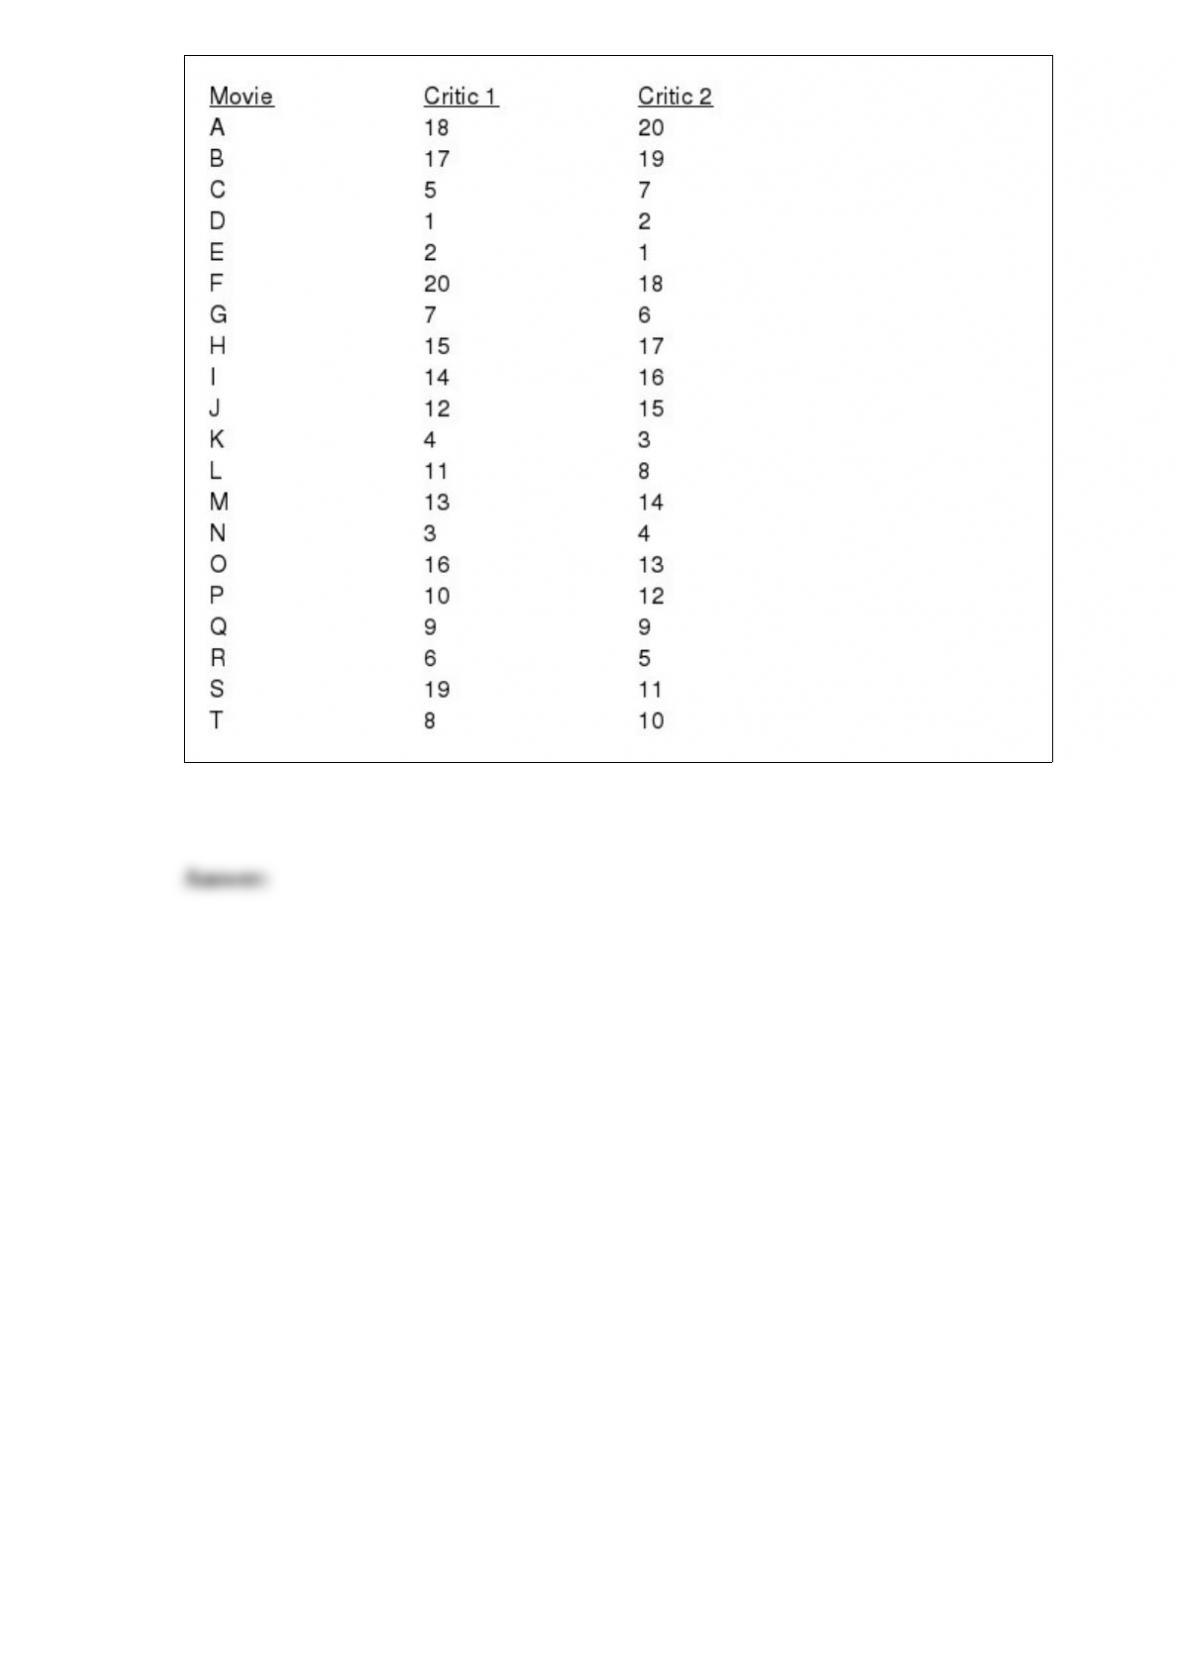
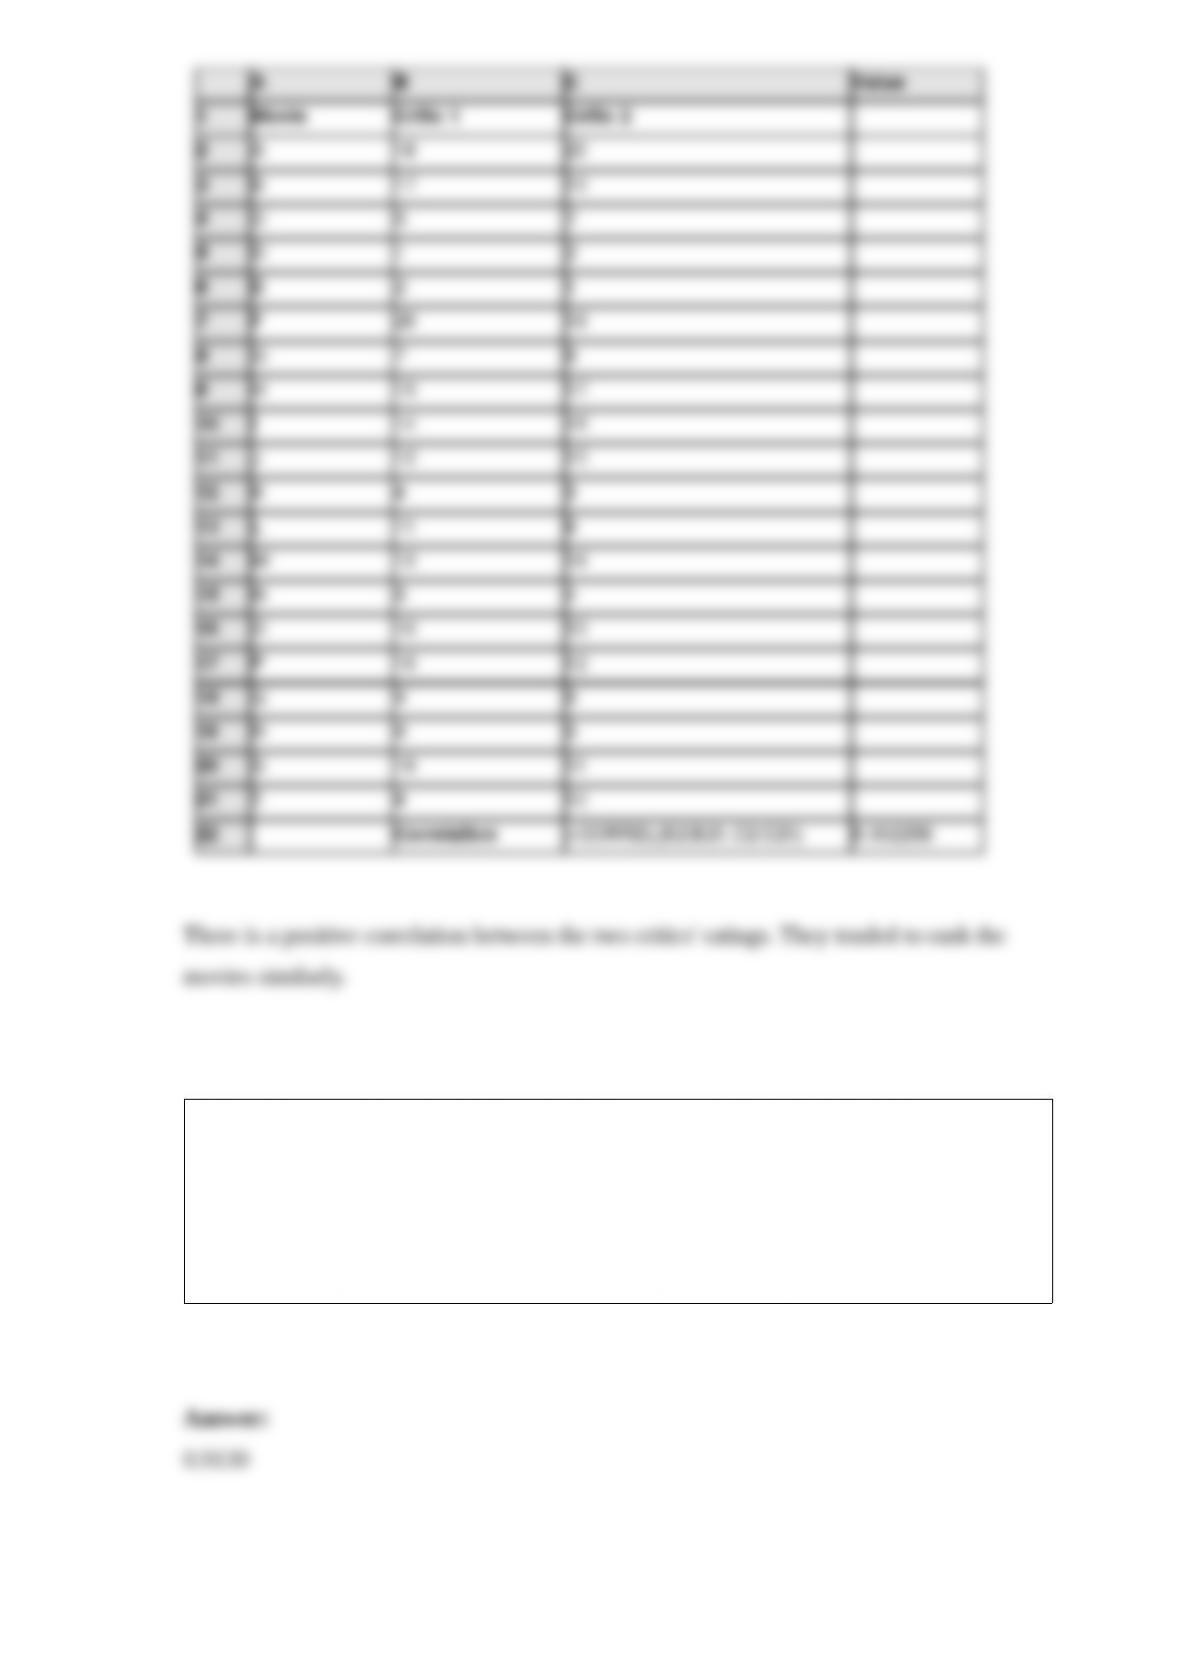
Two movie critics have independently ranked the top 20 movies of the year. Their
rankings follow. Use Excel to calculate the Spearman correlation coefficient and then
interpret its value.
A statistics professor has noted from past experience that a student who follows a
program of studying two hours for each hour in class has a probability of 0.9 of getting
a grade of C or better, while a student who does not follow a regular study program has
a probability of 0.2 of getting a C or better. It is known that 70% of the students follow
the study program. Find the probability that if a student who has earned a C or better
grade, he/she followed the program.