When dealing with the problem of non-constant variance, the reciprocal transformation
means using
a. 1/x as the independent variable instead of x
b. x2 as the independent variable instead of x
c. y2 as the dependent variable instead of y
d. 1/y as the dependent variable instead of y
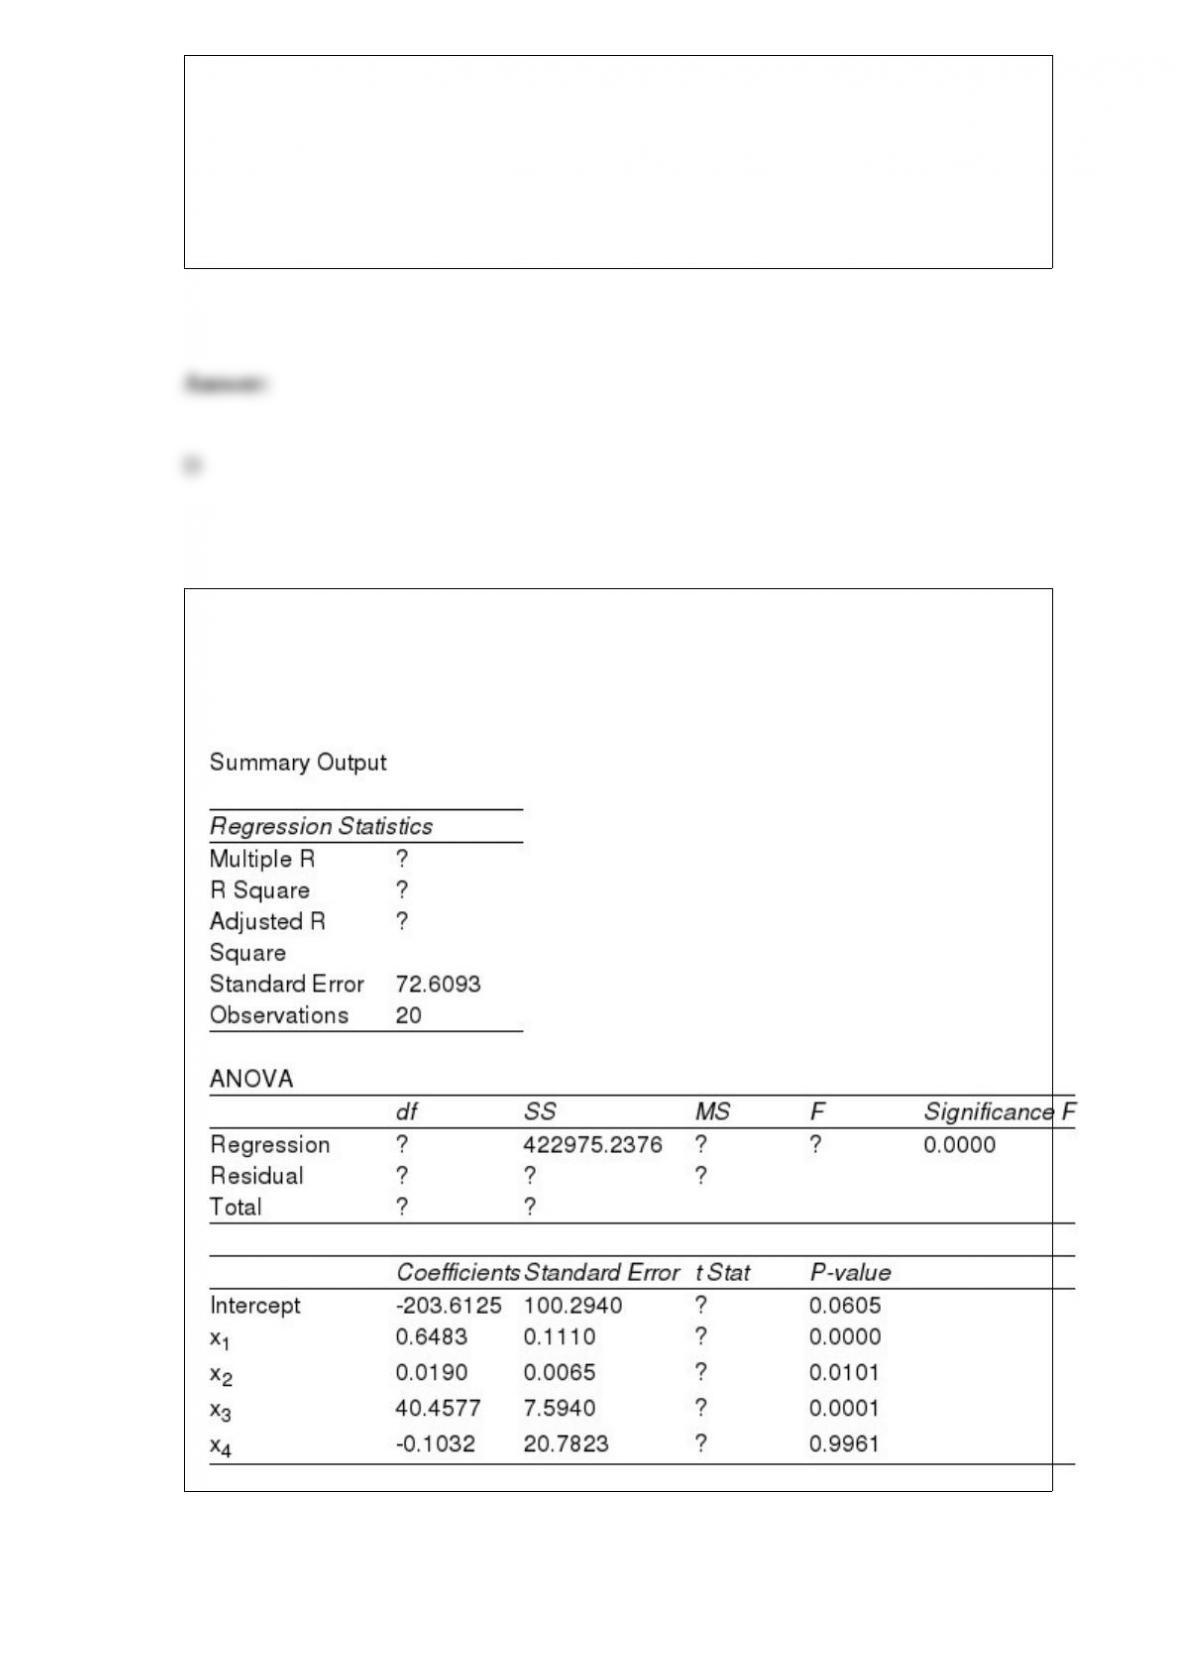
Part of an Excel output relating y (dependent variable) and 4 independent variables, x1
through x4, is shown below.

MNM Corporation gives each of its employees an aptitude test. The scores on the test
are normally distributed with a mean of 75 and a standard deviation of 15. A simple
random sample of 25 is taken from a population of 500.
a. What are the expected value, the standard deviation, and the shape of the sampling
distribution of ?
b. What is the random variable in this problem? Define it in words.
c. What is the probability that the average aptitude test score in the sample will be
between 70.14 and 82.14?
d. What is the probability that the average aptitude test score in the sample will be
greater than 82.68?
e. What is the probability that the average aptitude test score in the sample will be less
than 78.69?
f. Find a value, C, such that P( ) .015.
Two of the cylinders in an eight-cylinder car are defective and need to be replaced. If
two cylinders are selected at random, what is the probability that
a. both defective cylinders are selected?
b. no defective cylinder is selected?
c. at least one defective cylinder is selected?
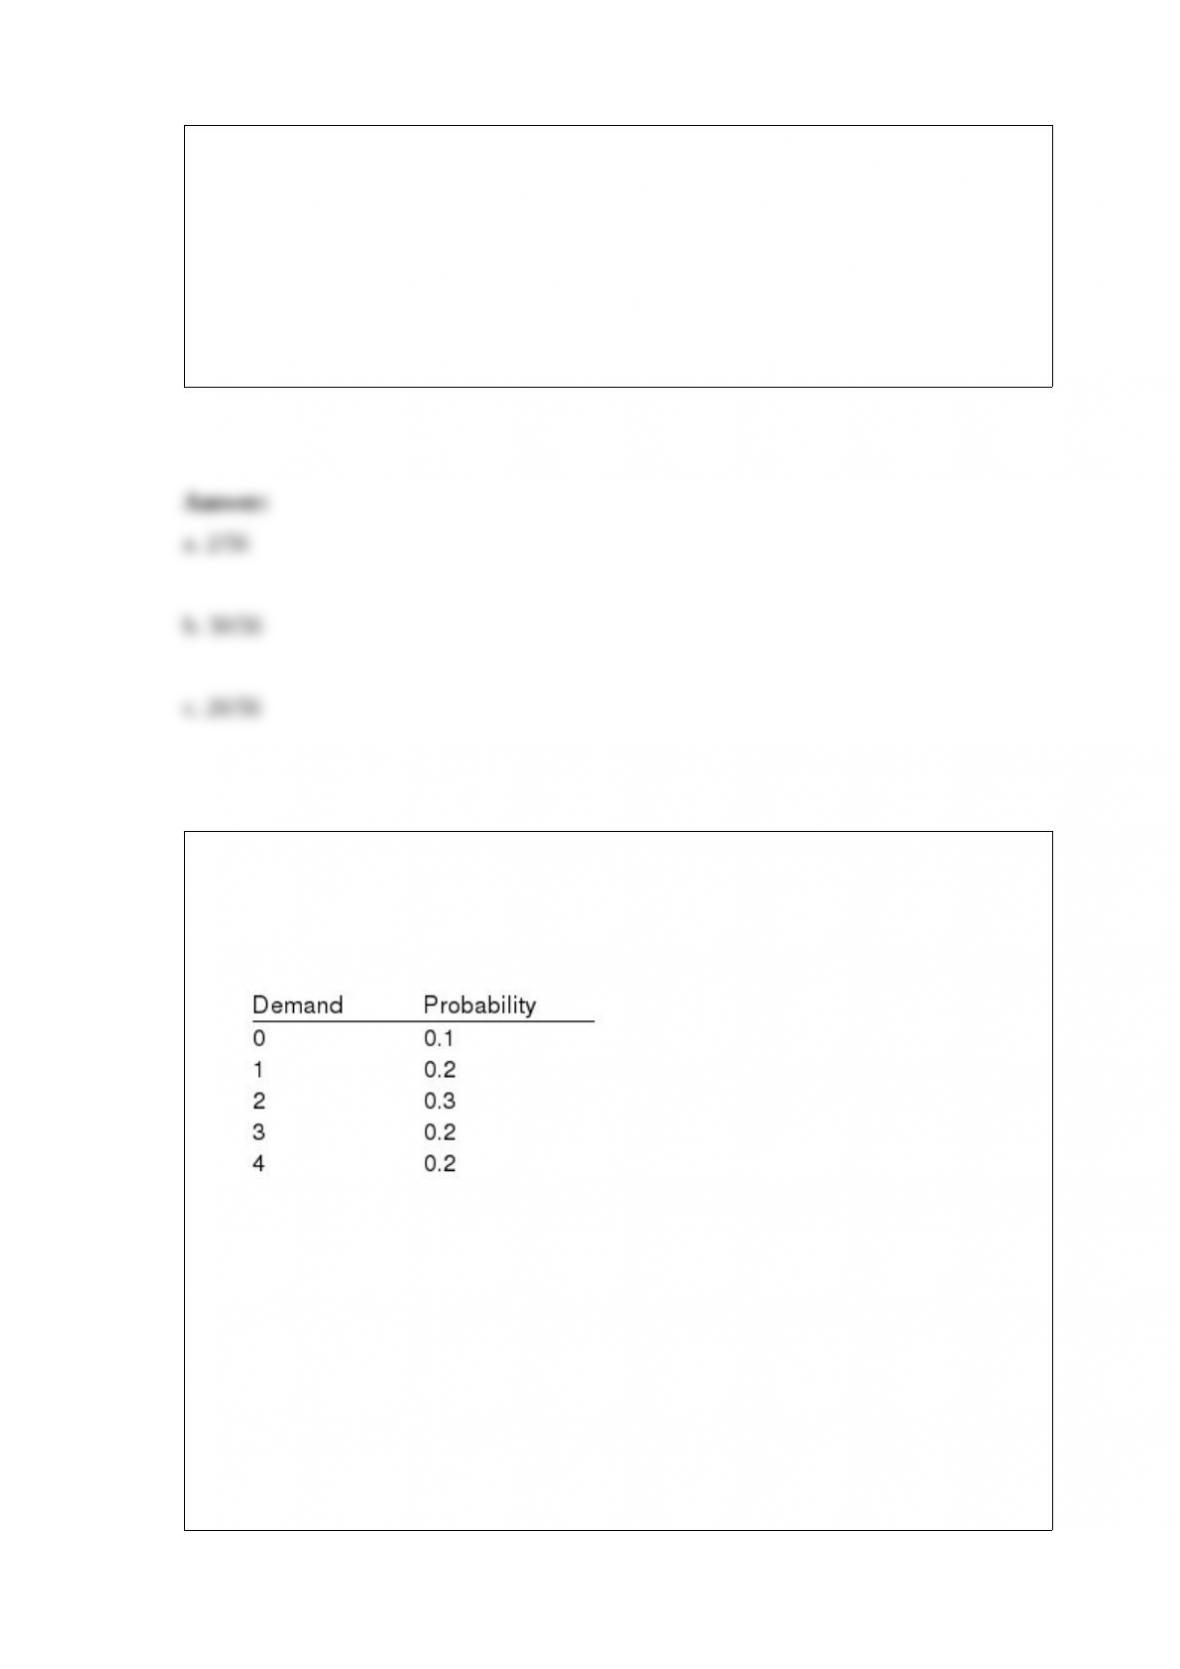
Exhibit 5-1
The following represents the probability distribution for the daily demand of
microcomputers at a local store.
Refer to Exhibit 5-1. The probability of having a demand for at least two
microcomputers is
a. 0.7
b. 0.3
c. 0.4
d. 1.0

50. When only common cause variation is present in a process,
a. no changes or adjustments are necessary
b. we conclude the process is out of control
c. human error is the sole source of variation
d. The source of the variation is easily identified
Variation in the quality of production output that is due to factors such as machine tools
wearing out is called
a. common-cause variation
b. assignable-cause variation
c. acceptable-cause variation
d. natural-cause variation
A multiple regression analysis between yearly income (y in $1,000s), college grade
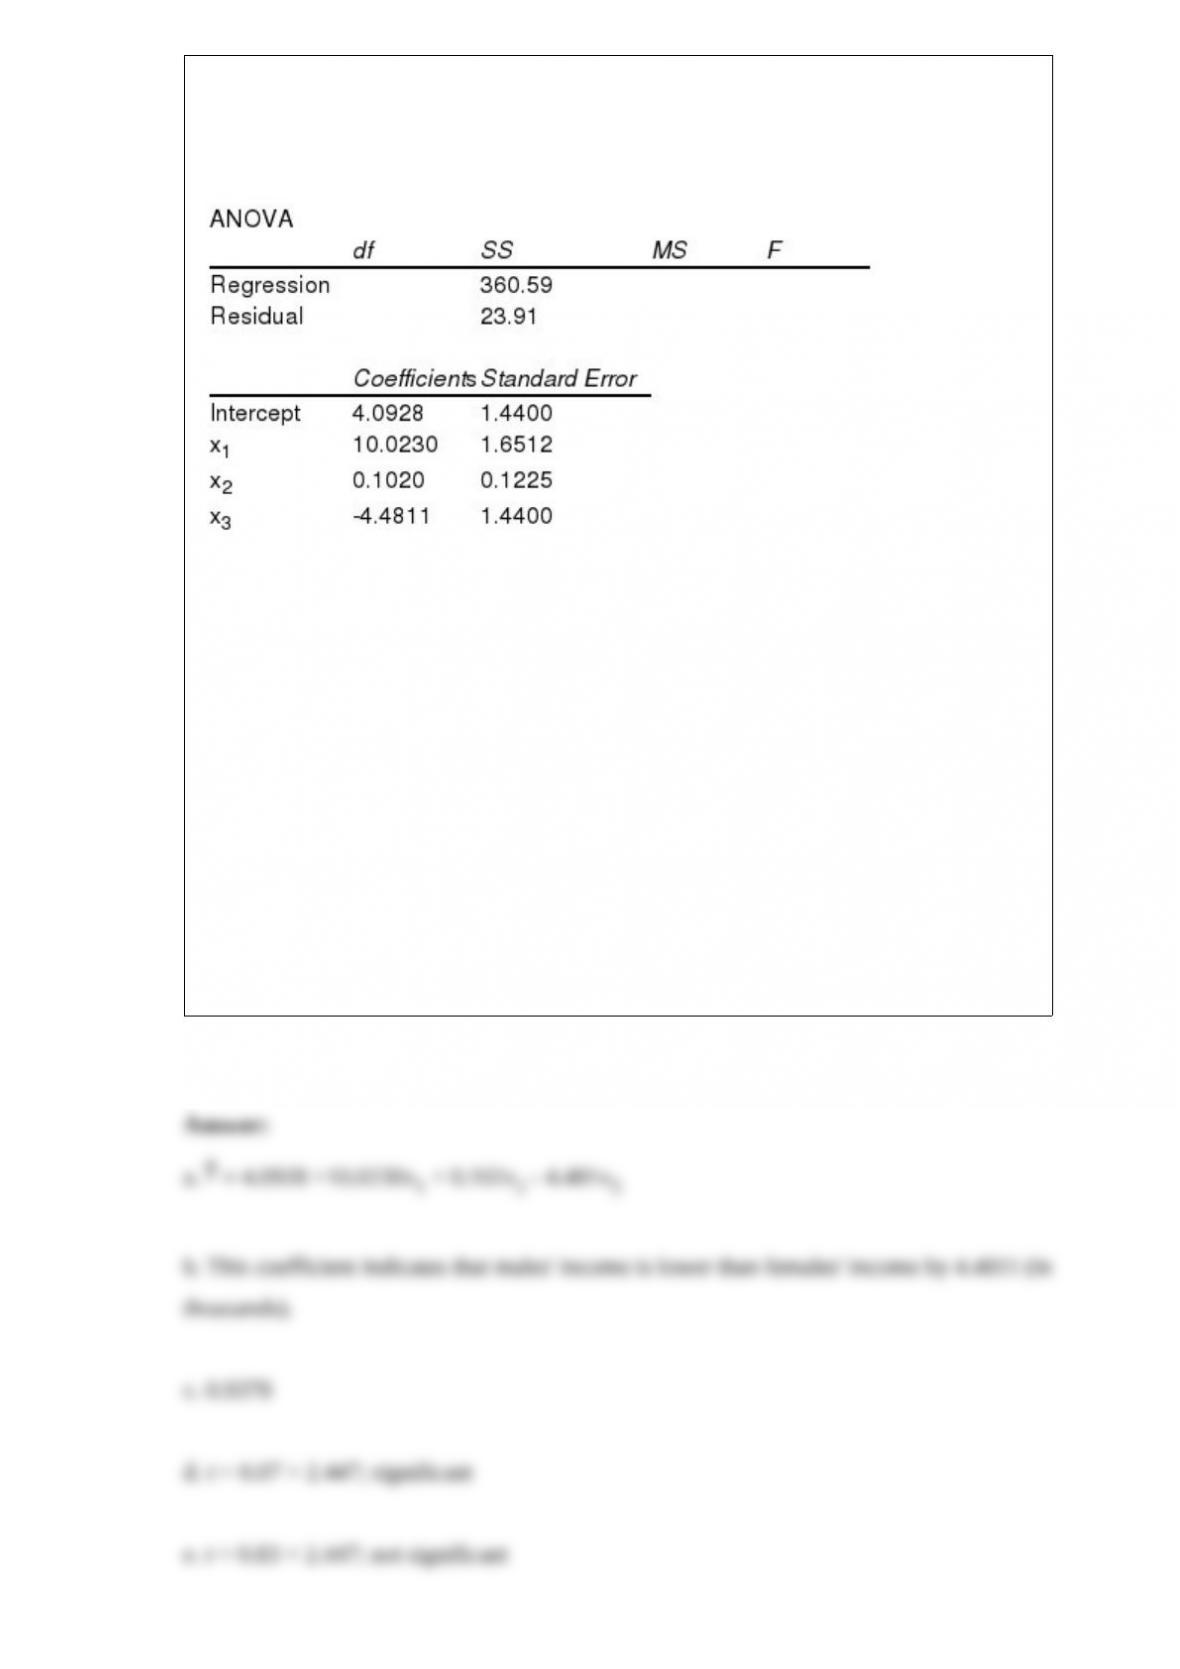
point average (x1), age of the individuals (x2), and the gender of the individual (x3; zero
representing female and one representing male) was performed on a sample of 10
people, and the following results were obtained using Excel.
a. Write the regression equation for the above.
b. Interpret the meaning of the coefficient of x3.
c. Compute the coefficient of determination.
d. Is the coefficient of x1 significant? Use = 0.05.
e. Is the coefficient of x2 significant? Use = 0.05.
f. Is the coefficient of x3 significant? Use = 0.05.
g. Perform an F test and determine whether or not the model is significant.

Excel’s NORM.INV function can be used to compute
a. cumulative probabilities for a standard normal z value
b. the standard normal z value given a cumulative probability
c. cumulative probabilities for a normally distributed x value
d. the normally distributed x value given a cumulative probability
If A and B are independent events with P(A) 0.05 and P(B) 0.65, then P(AB)
a. 0.05
b. 0.0325
c. 0.65
d. 0.8
The length of time it takes students to complete a statistics examination is uniformly

distributed and varies between 40 and 60 minutes.
a. Find the mathematical expression for the probability density function.
b. Compute the probability that a student will take between 45 and 50 minutes to
complete the examination.
c. Compute the probability that a student will take no more than 40 minutes to complete
the examination.
d. What is the expected amount of time it takes a student to complete the examination?
e. What is the variance for the amount of time it takes a student to complete the
examination?
In a multiple regression analysis involving 5 independent variables and 30 observations,
SSR = 360 and SSE = 40. The coefficient of determination is
a. 0.80
b. 0.90
c. 0.25
d. 0.15
The daily dinner bills in a local restaurant are normally distributed with a mean of $28
and a standard deviation of $6.
a. Define the random variable in words.
b. What is the probability that a randomly selected bill will be at least $39.10?
c. What percentage of the bills will be less than $16.90?
d. What are the minimum and maximum of the middle 95% of the bills?
e. If twelve of one day’s bills had a value of at least $43.06, how many bills did the
restaurant collect on that day?
Exhibit 11-5
Refer to Exhibit 11-5. The null hypothesis
a. should be rejected
b. should not be rejected

c. should be revised
d. None of these alternatives is correct.
The ratio of MSE/MSR yields
a. SST
b. the F statistic
c. SSR
d. None of these alternatives is correct.
The three quality processes on which Juran’s approach to quality focused include all of
the following except
a. quality planning
b. quality execution
c. quality control
d. quality improvement

The key difference between the binomial and hypergeometric distribution is that with
the hypergeometric distribution the
a. probability of success must be less than 0.5
b. probability of success changes from trial to trial
c. trials are independent of each other
d. random variable is continuous
When developing an interval estimate for the difference between two sample means,
with sample sizes of n1 and n2,
a. n1 must be equal to n2
b. n1 must be smaller than n2
c. n1 must be larger than n2
d. n1 and n2 can be of different sizes,
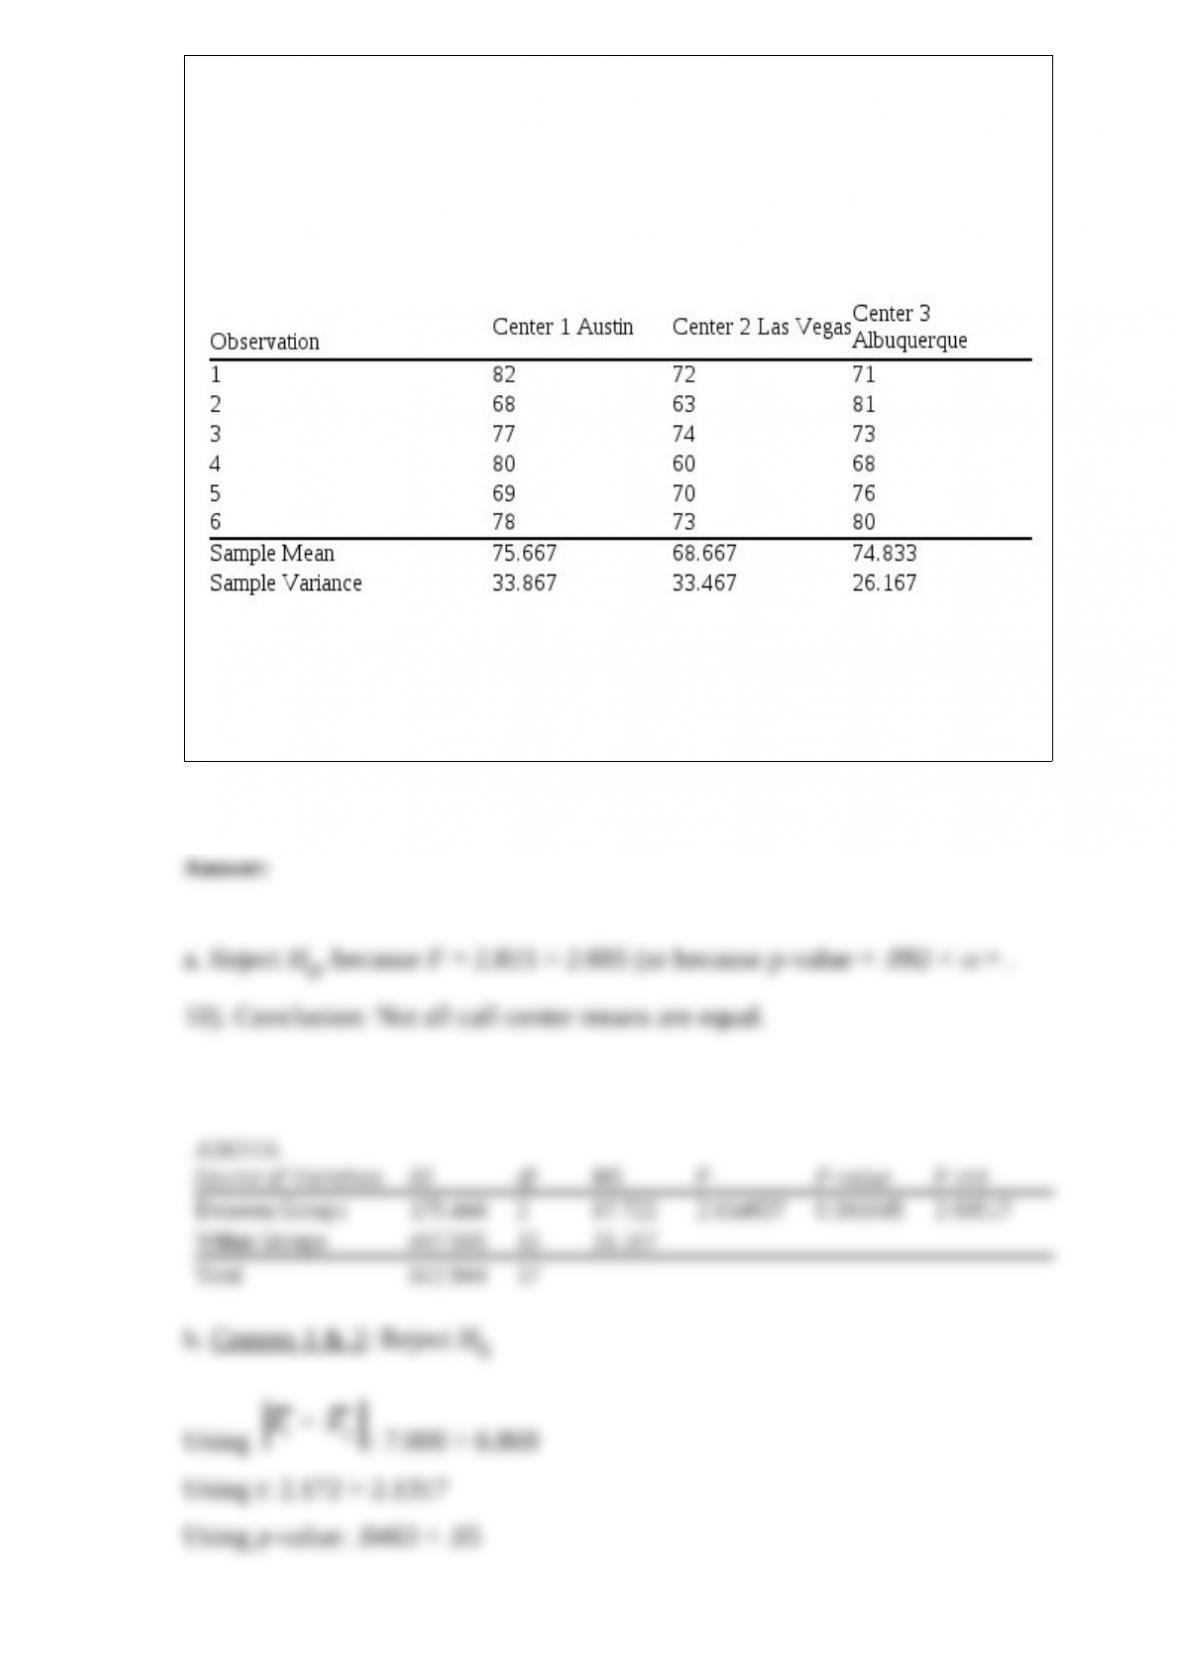
Regional Manager Sue Collins would like to know if the mean number of
telephone calls made per 8-hour shift is the same for the telemarketers at
her three call centers (Austin, Las Vegas, and Albuquerque).
A simple random sample of 6 telemarketers from each of the three call centers
was taken and the number of telephone calls made in eight hours by each
observed employee is shown below.
a. Using
= .10, test for any significant difference in number of telephone
calls made at the three call centers.
b. Apply Fisher’s least significant difference (LSD) procedure to determine
where the differences occur. Use
= .05.
Conclusions drawn from a sample survey
a. apply only to the sample
b. apply to any population
c. apply only to the sampled population
d. None of these alternatives is correct.
When the level of confidence increases, the confidence interval
a. stays the same

b. becomes wider
c. becomes narrower
d. cannot tell from the information given
The sum of deviations of the individual data elements from their mean is
a. always greater than zero
b. always less than zero
c. sometimes greater than and sometimes less than zero, depending on the data elements
d. always equal to zero