
The probability distribution of all possible values of the sample proportion is the
a. probability density function of
b. sampling distribution of
c. same as , since it considers all possible values of the sample proportion
d. sampling distribution of
Probabilistic sampling is any method of sampling in which
a. the probability of the occurrence of various events in the study are known
b. there are only two possible outcomes, such as P(A) and P(Ac)
c. the probability of each possible sample can be computed
d. the probability of each possible sample is one
Statistical studies in which researchers do not control variables of interest are
a. experimental studies
b. uncontrolled experimental studies
c. not of any value
d. observational studies
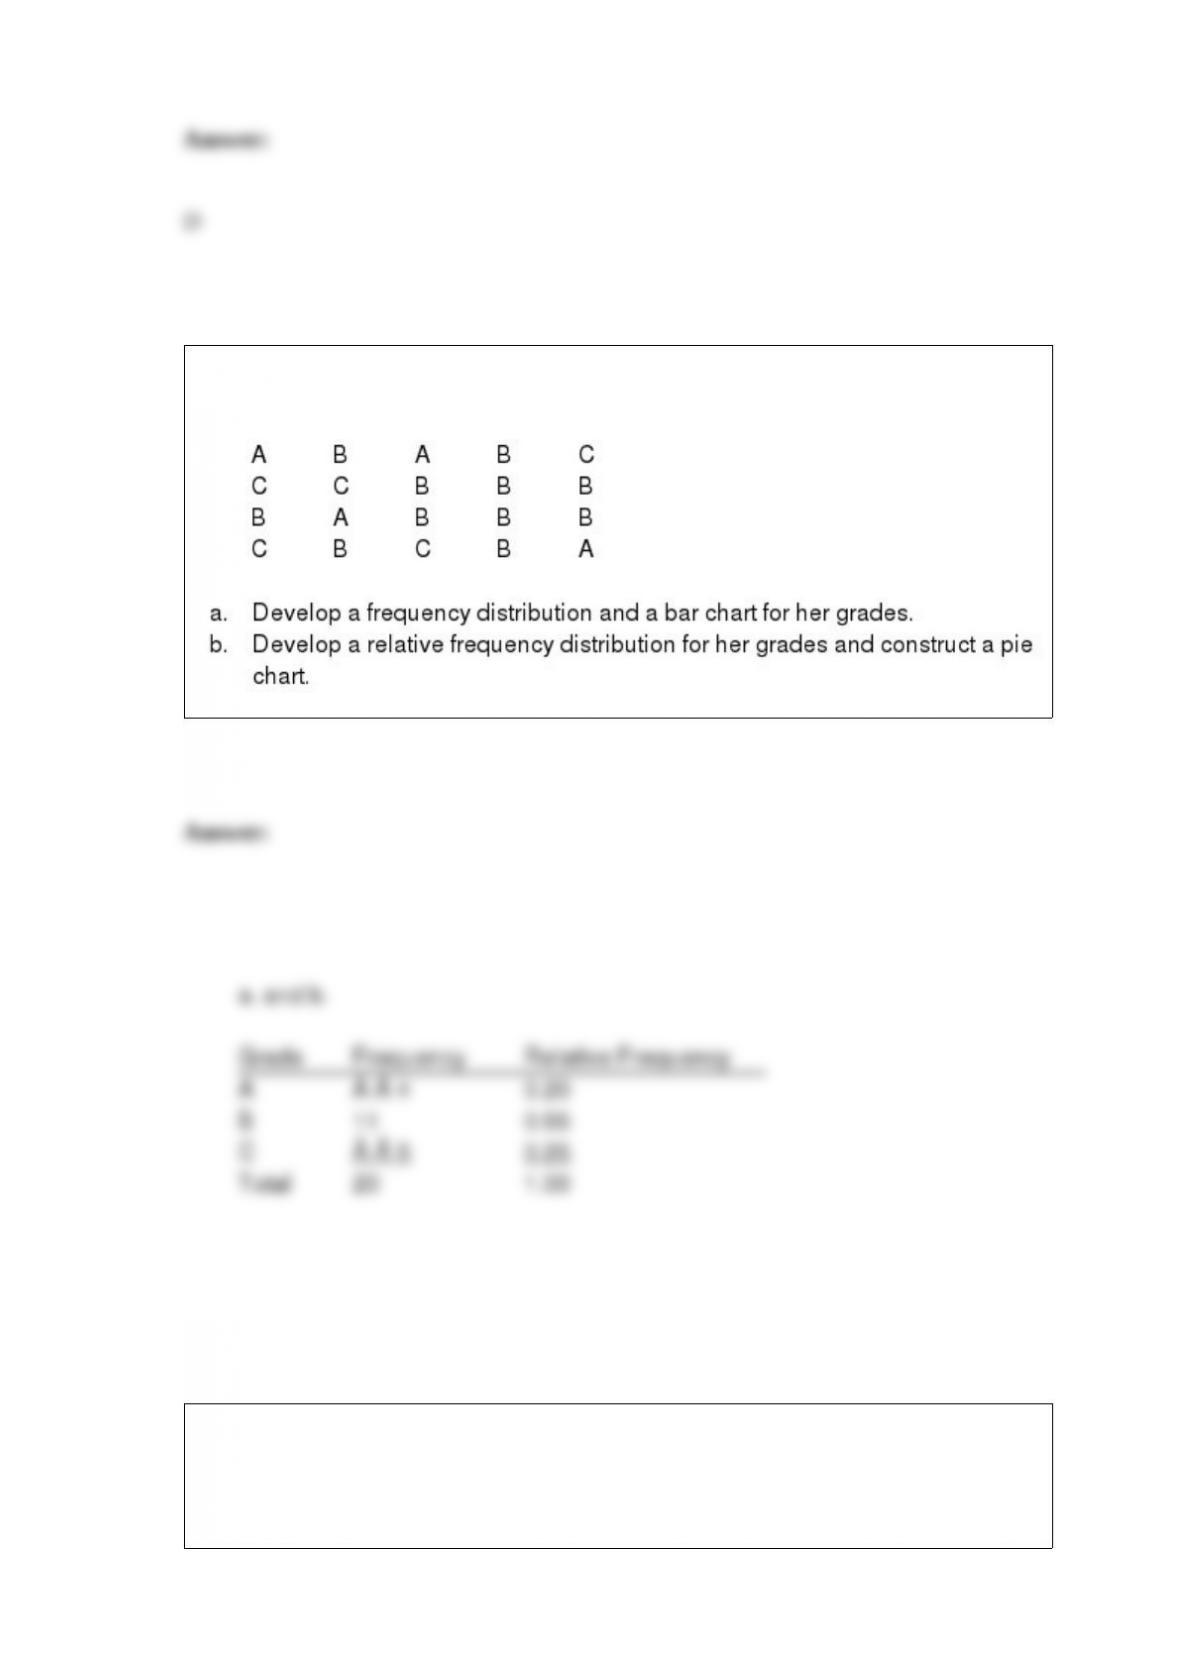
A student has completed 20 courses in the School of Arts and Sciences. Her grades in
the 20 courses are shown below.
Exhibit 14-3
Regression analysis was applied between sales data (in $1,000s) and advertising data
(in $100s) and the following information was obtained.
Refer to Exhibit 14-3. The critical F value at 0.05 is
a. 3.59
b. 3.68
c. 4.45
d. 4.54
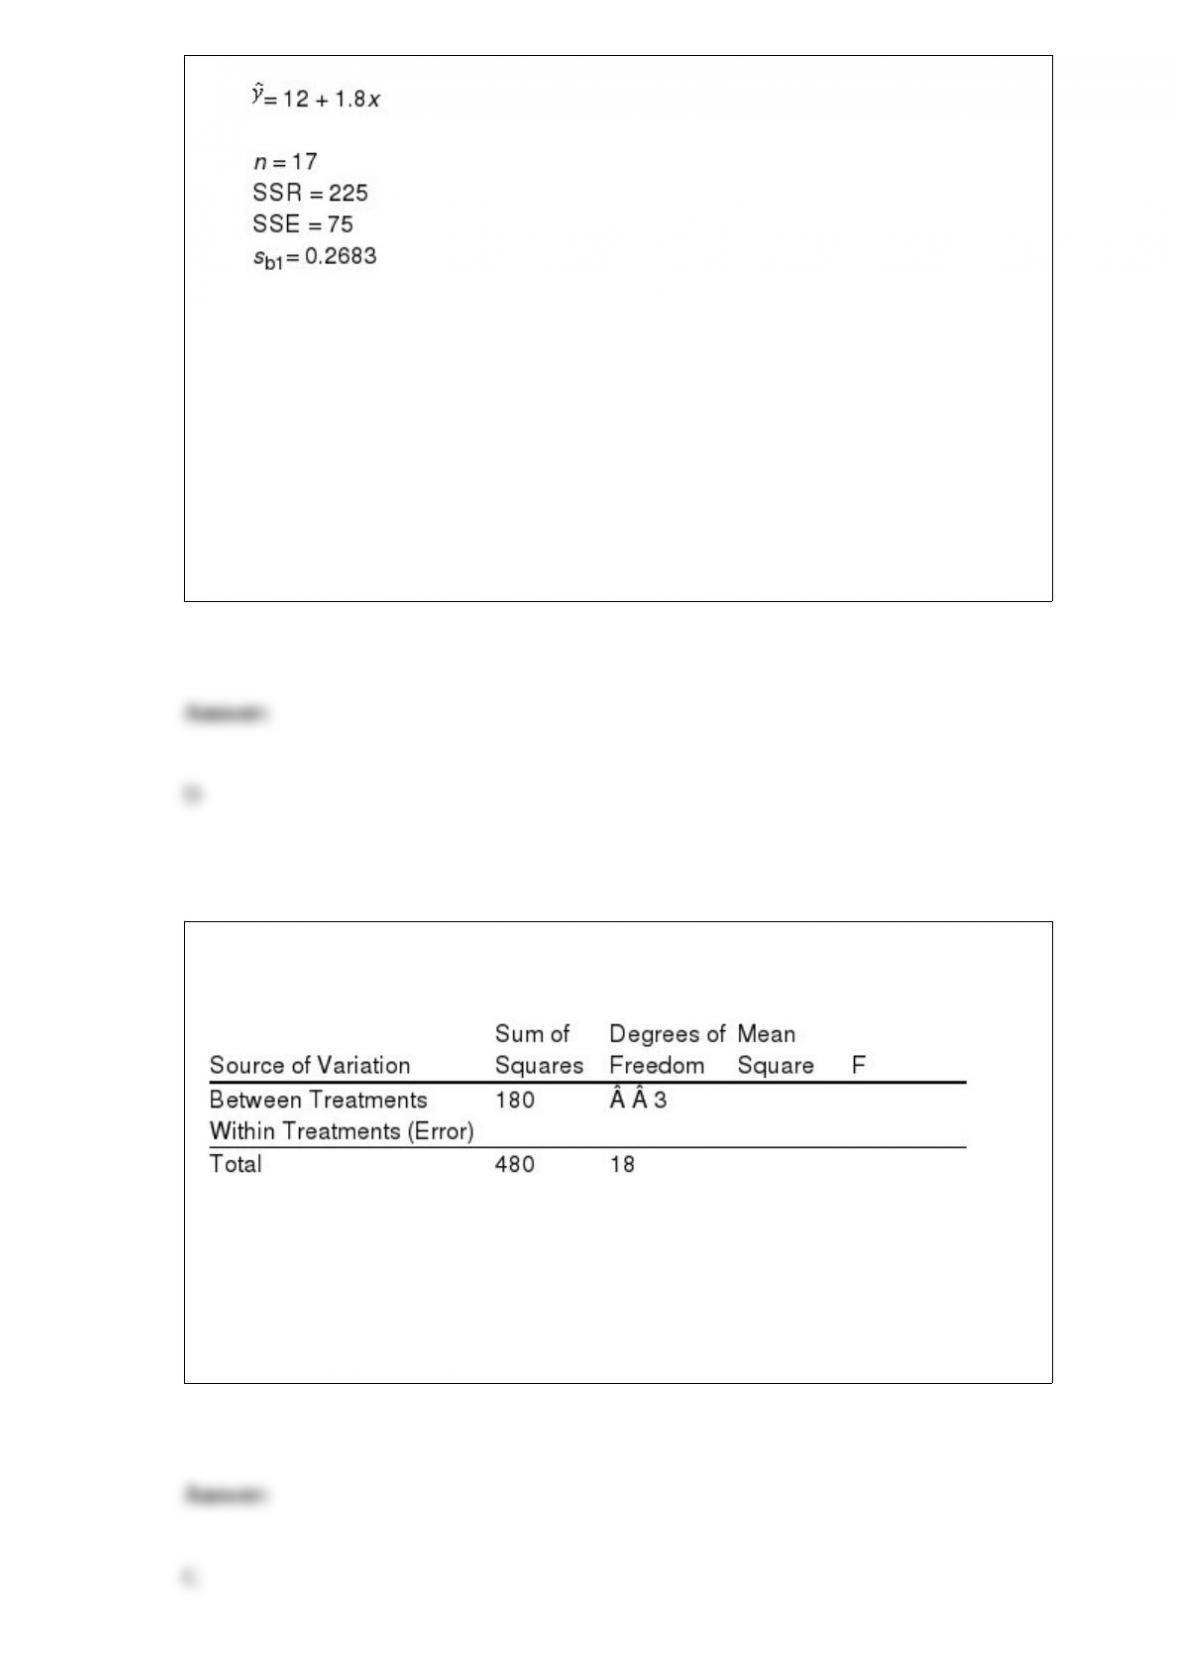
Exhibit 13-5
Part of an ANOVA table is shown below.
Refer to Exhibit 13-5. If at a 5% level of significance, we want to determine whether or
not the means of the populations are equal, the critical value of F is
a. 2.53
b. 19.48
c. 3.29
d. 5.86
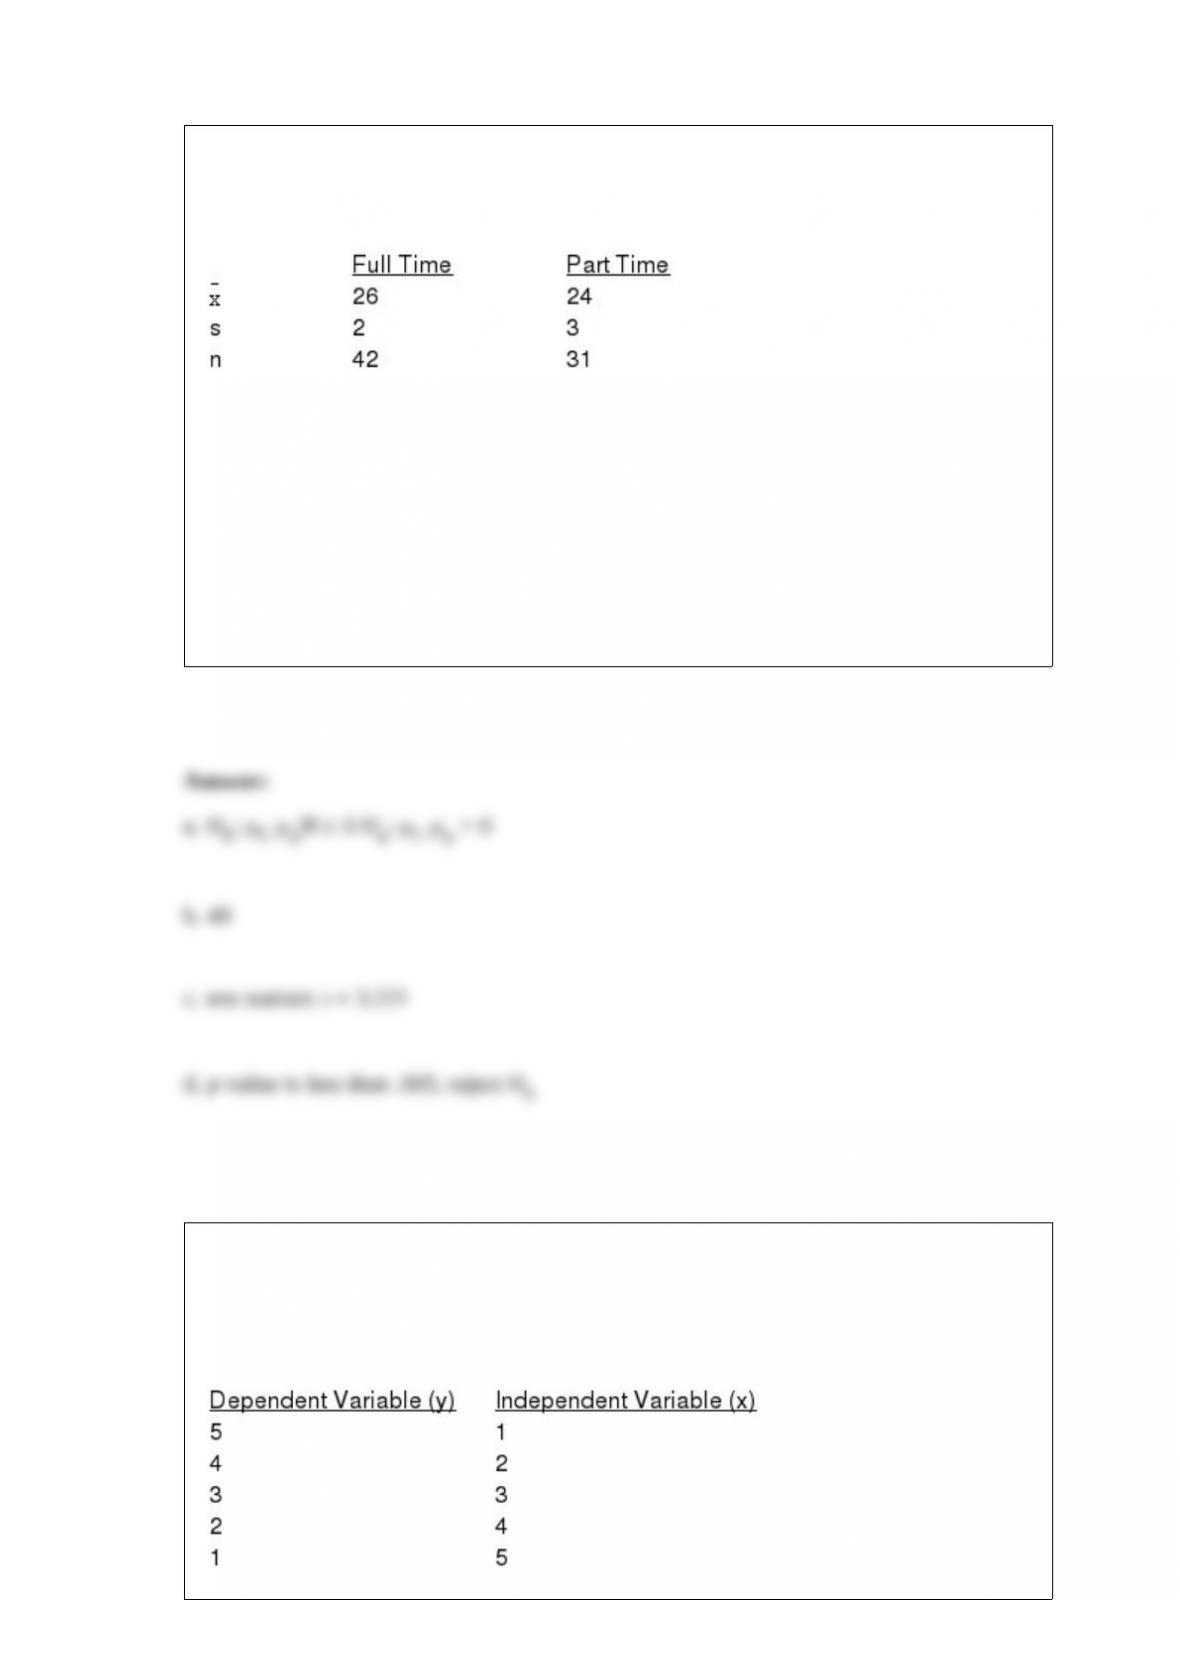
Recently, a local newspaper reported that part time students are older than full time
students. In order to test the validity of its statement, two independent samples of
students were selected.
a. Give the hypotheses for the above.
b. Determine the degrees of freedom.
c. Compute the test statistic.
d. At 95% confidence, test to determine whether or not the average age of part time
students is significantly more than full time students.
Exhibit 14-5
You are given the following information about y and x.

Refer to Exhibit 14-5. The point estimate of y when x = 10 is
a. -10
b. 10
c. -4
d. 4
The rejection region for a one-tailed hypothesis test
a. has an area of 1 –
b. has an area equal to the confidence coefficient
c. is in the tail that supports the null hypothesis
d. is in the tail that supports the alternative hypothesis
The quality control department of a company has decided to select a sample of 20 items
from each shipment of goods it receives and inspect them for defects. It has been
decided that if the sample contains no defective parts, the entire lot will be accepted.
Each shipment contains 1,000 items.
a. What is the probability of accepting a lot that contains 10% defective items?
b. What is the probability of accepting a lot that contains 5% defective items?
c. What is the probability of rejecting a lot that contains 15% defective items?
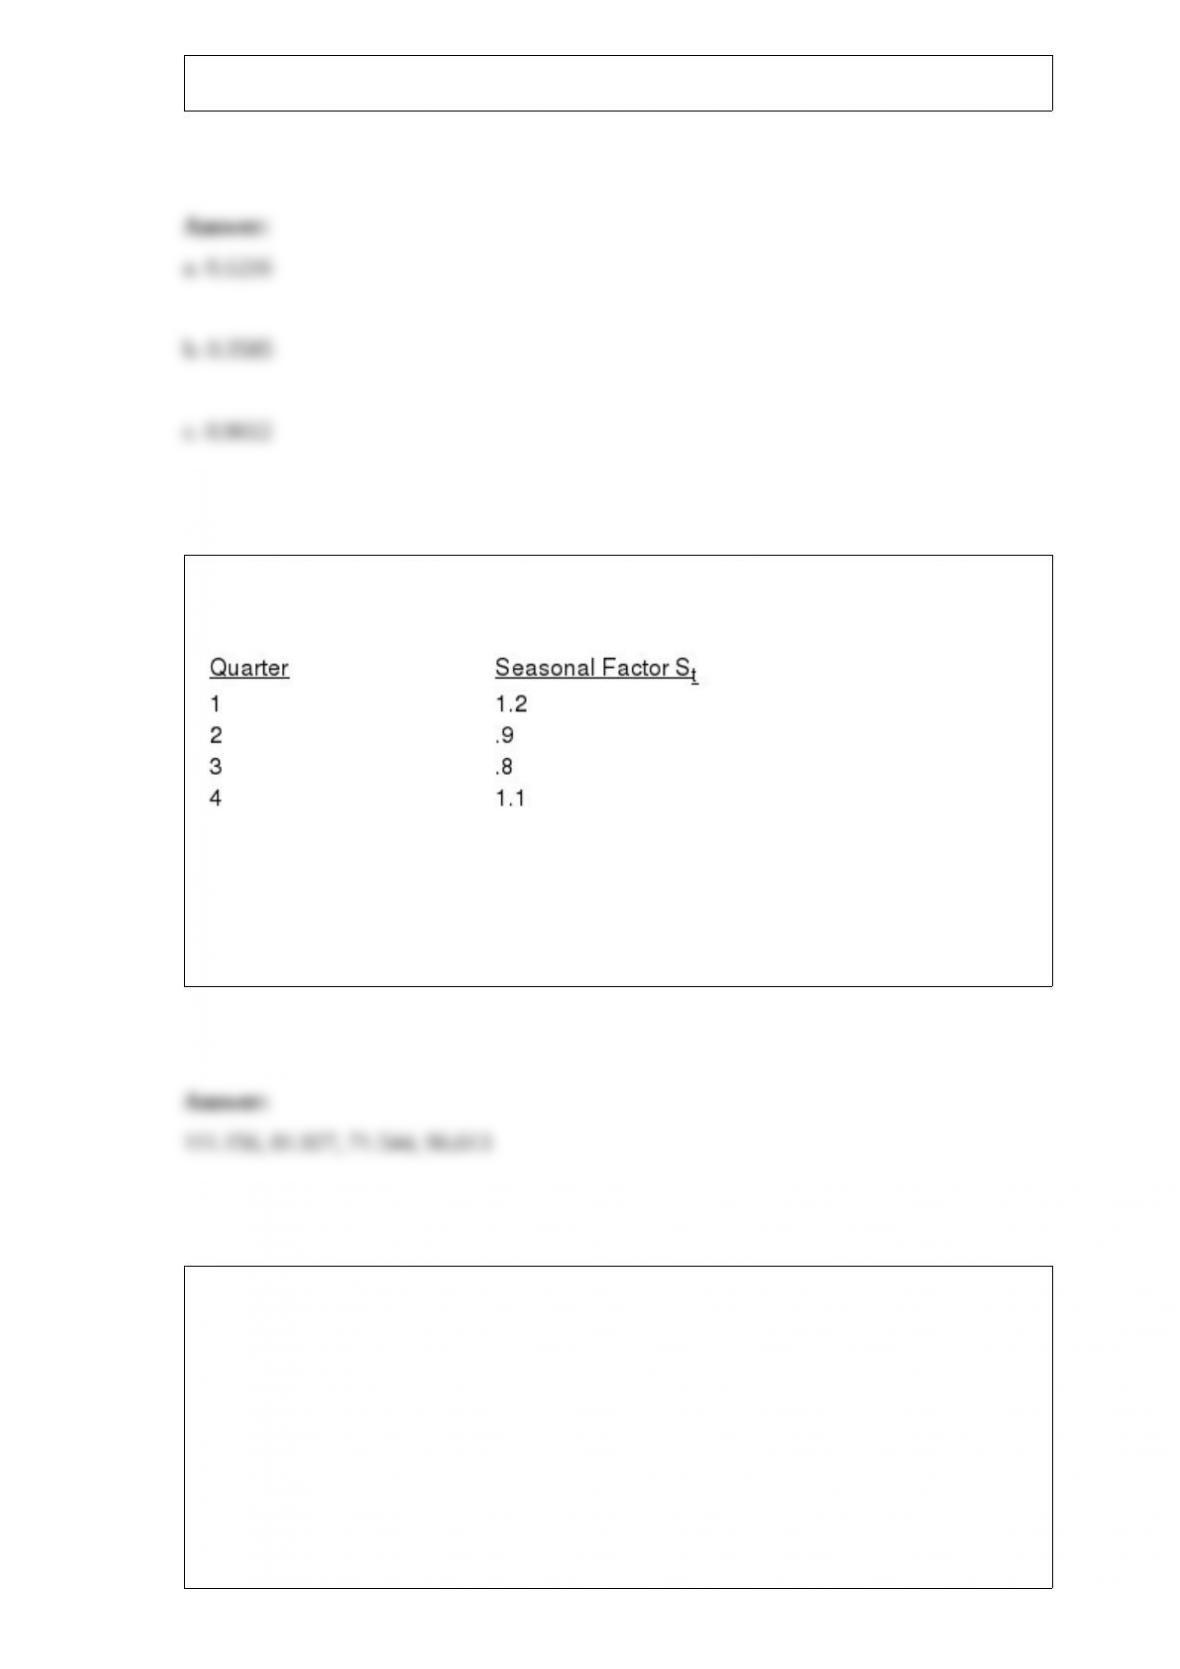
Below you are given the seasonal factors and the estimated trend equation for a time
series. These values were computed on the basis of 5 years of quarterly data.
T = 126.23 – 1.6t
Produce forecasts for all four quarters of year 6 by using the seasonal and trend
components.
Read the t statistic from the table of t distributions and circle the correct answer. A
one-tailed test (upper tail), a sample size of 18 at a .05 level of significance t =
a. 2.12
b. 1.734
c. -1.740
d. 1.740
The standard error of is the
a. variance of
b. variance of the sampling distribution of
c. standard deviation of the sampling distribution of
d. difference between the two means
Two percent of the parts produced by a machine are defective. Forty parts are selected.
Define the random variable x to be the number of defective parts.
a. What is the probability that exactly 3 parts will be defective?
b. What is the probability that the number of defective parts will be more than 2 but
fewer than 6?
c. What is the probability that fewer than 4 parts will be defective?
d. What is the expected number of defective parts?
e. What is the variance for the number of defective parts?

Exhibit 18-2
Students in statistics classes were asked whether they preferred a 10-minute break or to
get out of class 10 minutes early. In a sample of 150 students, 40 preferred a 10-minute
break, 80 preferred to get out 10 minutes early, and 30 had no preference. We want to
determine if there is a difference in students’ preferences.
Refer to Exhibit 18-2. The null hypothesis should be
a. rejected
b. not rejected
c. revised
d. None of these alternatives is correct.
Read the t statistic from the table of t distributions and circle the correct answer. A
one-tailed test (lower tail), a sample size of 10 at a .10 level of significance; t =
a. 1.383
b. -1.372
c. -1.383
d. -2.821
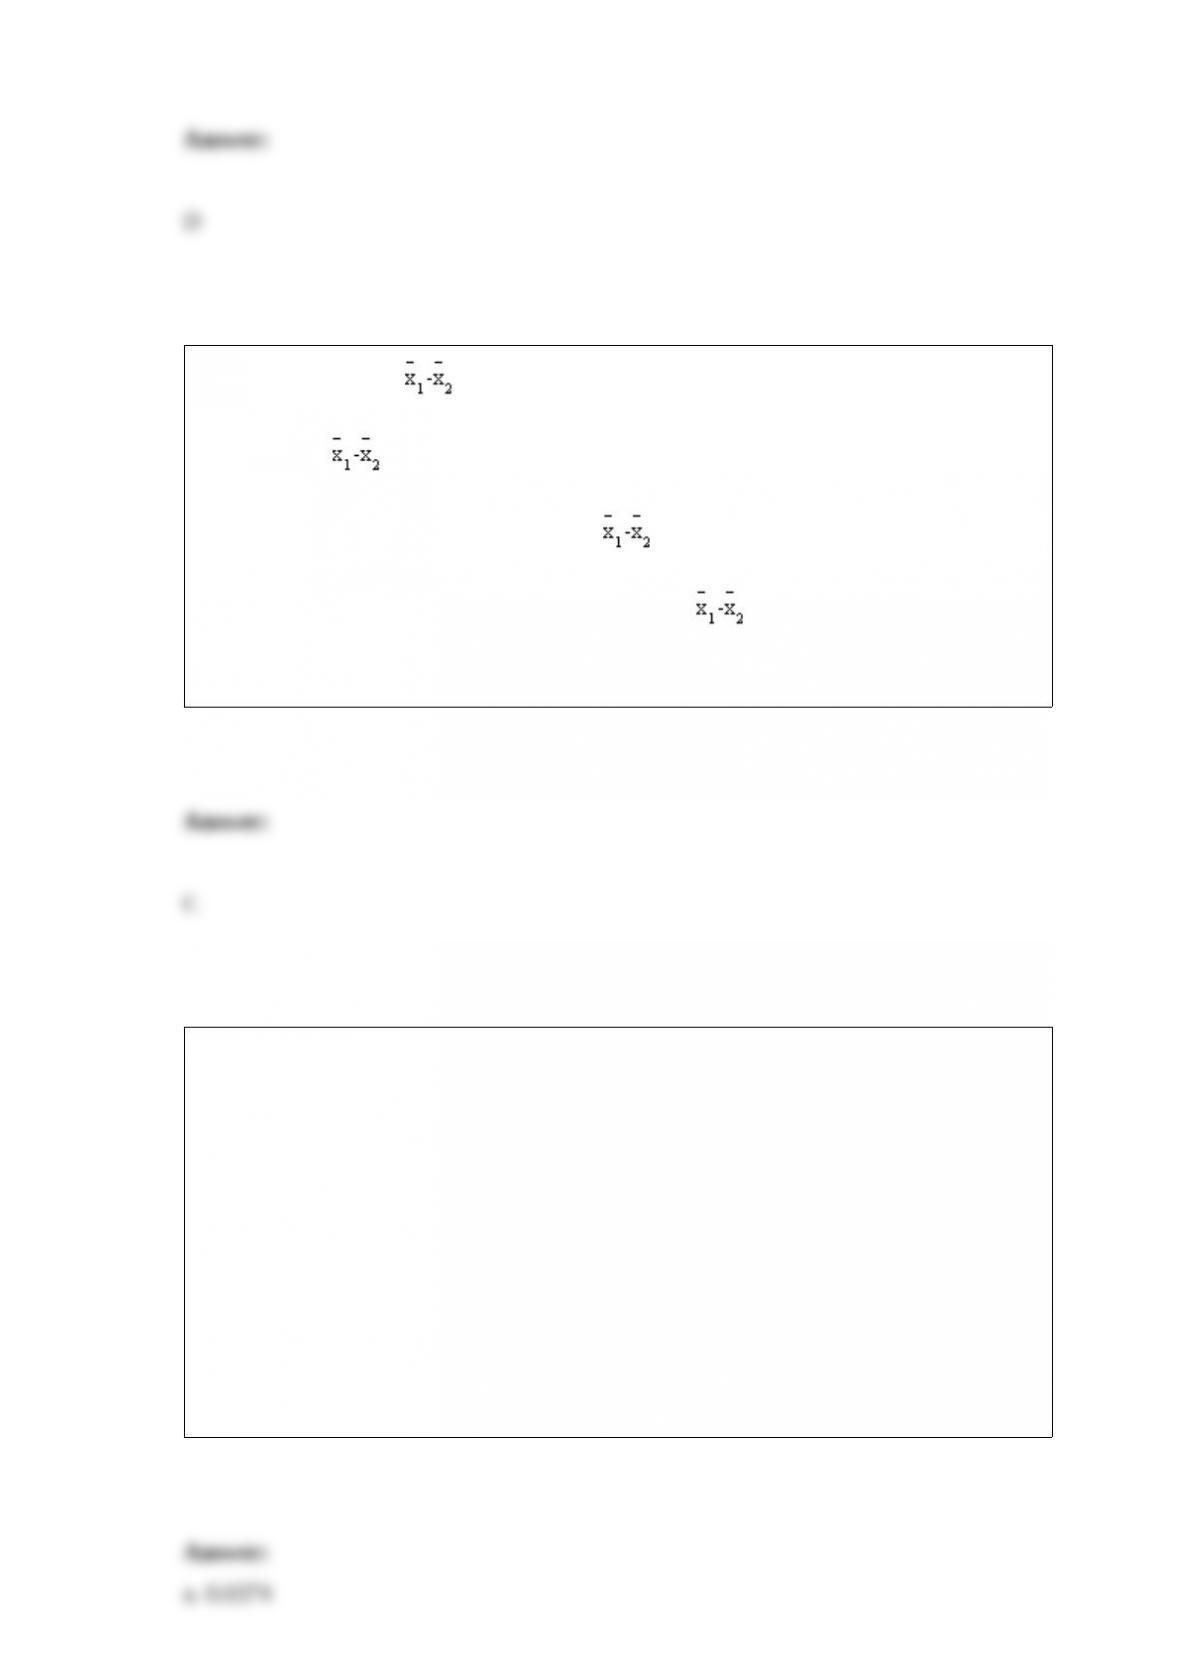
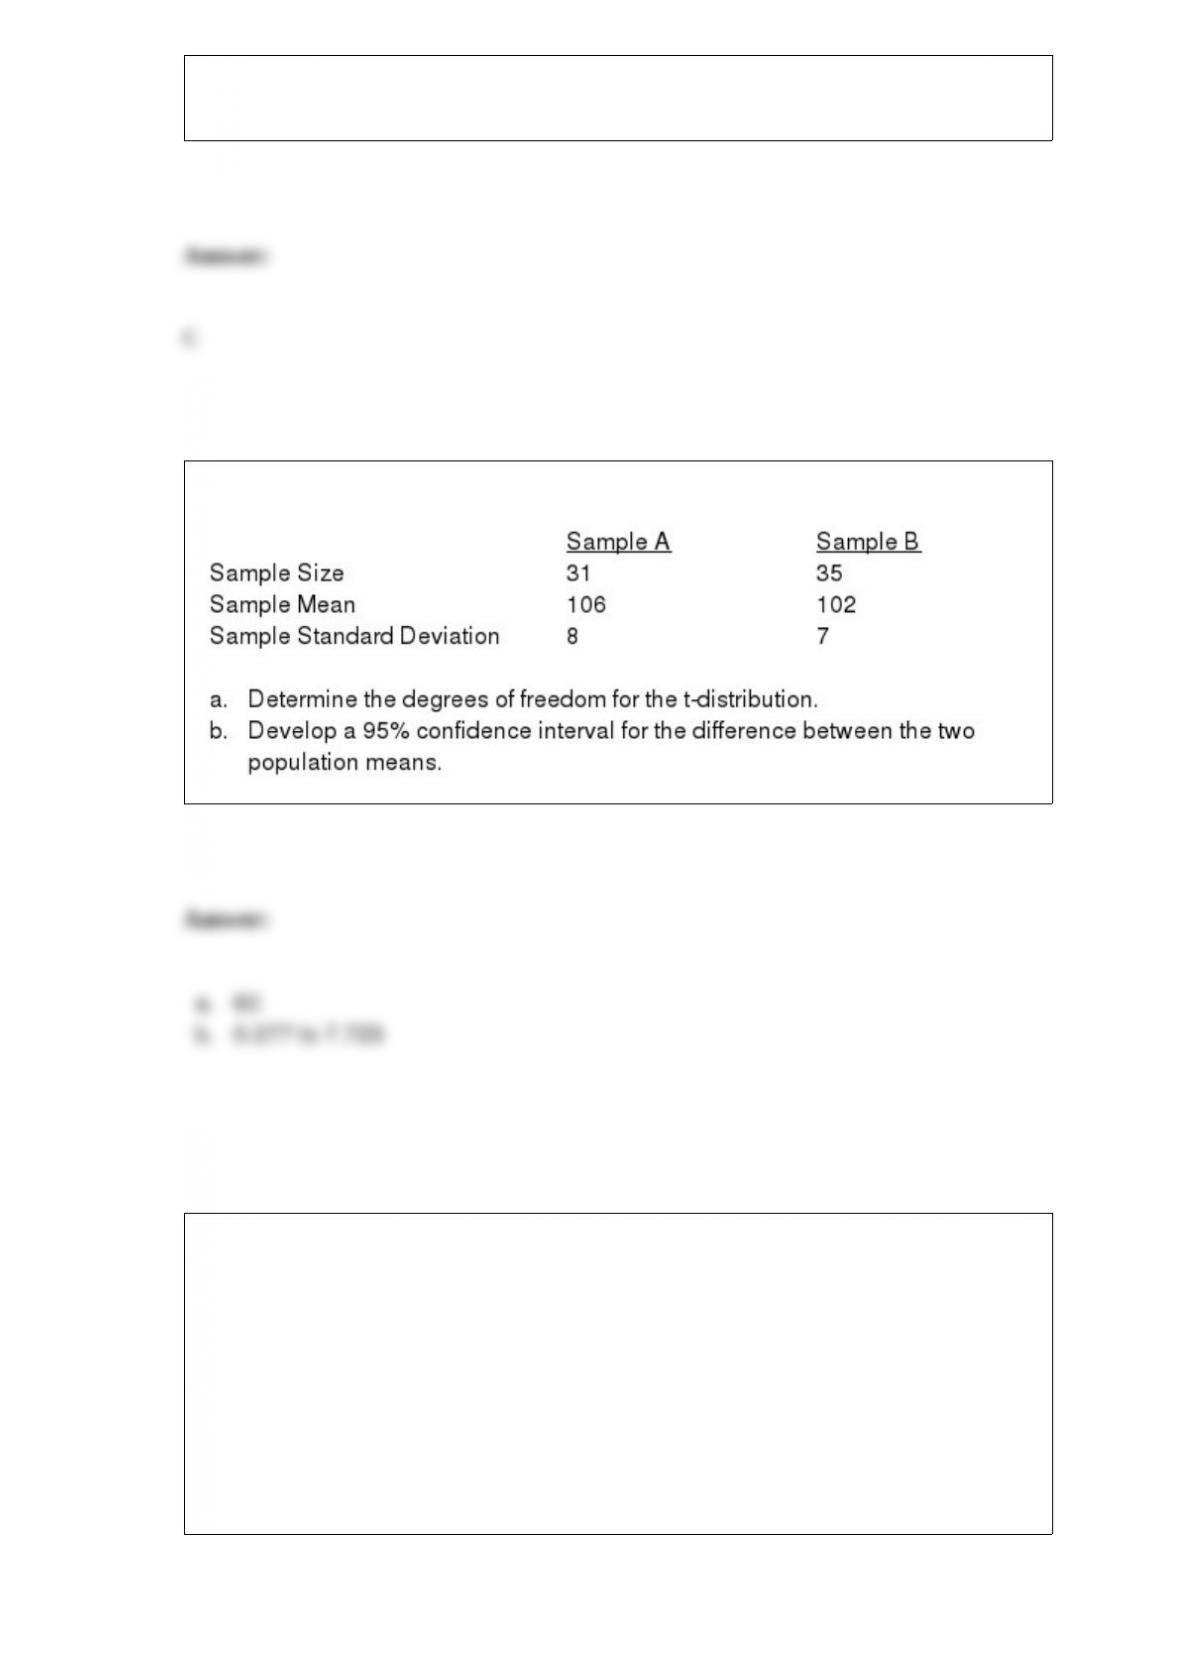
Consider the following results for two samples randomly taken from two populations.
The number of degrees of freedom for the appropriate chi-square distribution in a test
of independence is
a. n-1
b. k-1
c. number of rows minus 1 times number of columns minus 1
d. a chi-square distribution is not used
A simple random sample of 144 items resulted in a sample mean of 1080. The
population standard deviation is known to be 240. Develop a 95% confidence interval
for the population mean.
A sample of 30 items provided a sample mean of 28 and a sample standard deviation of
6. Test the following hypotheses using = 0.05. What is your conclusion?
H0: 2 25
Ha: 2 > 25
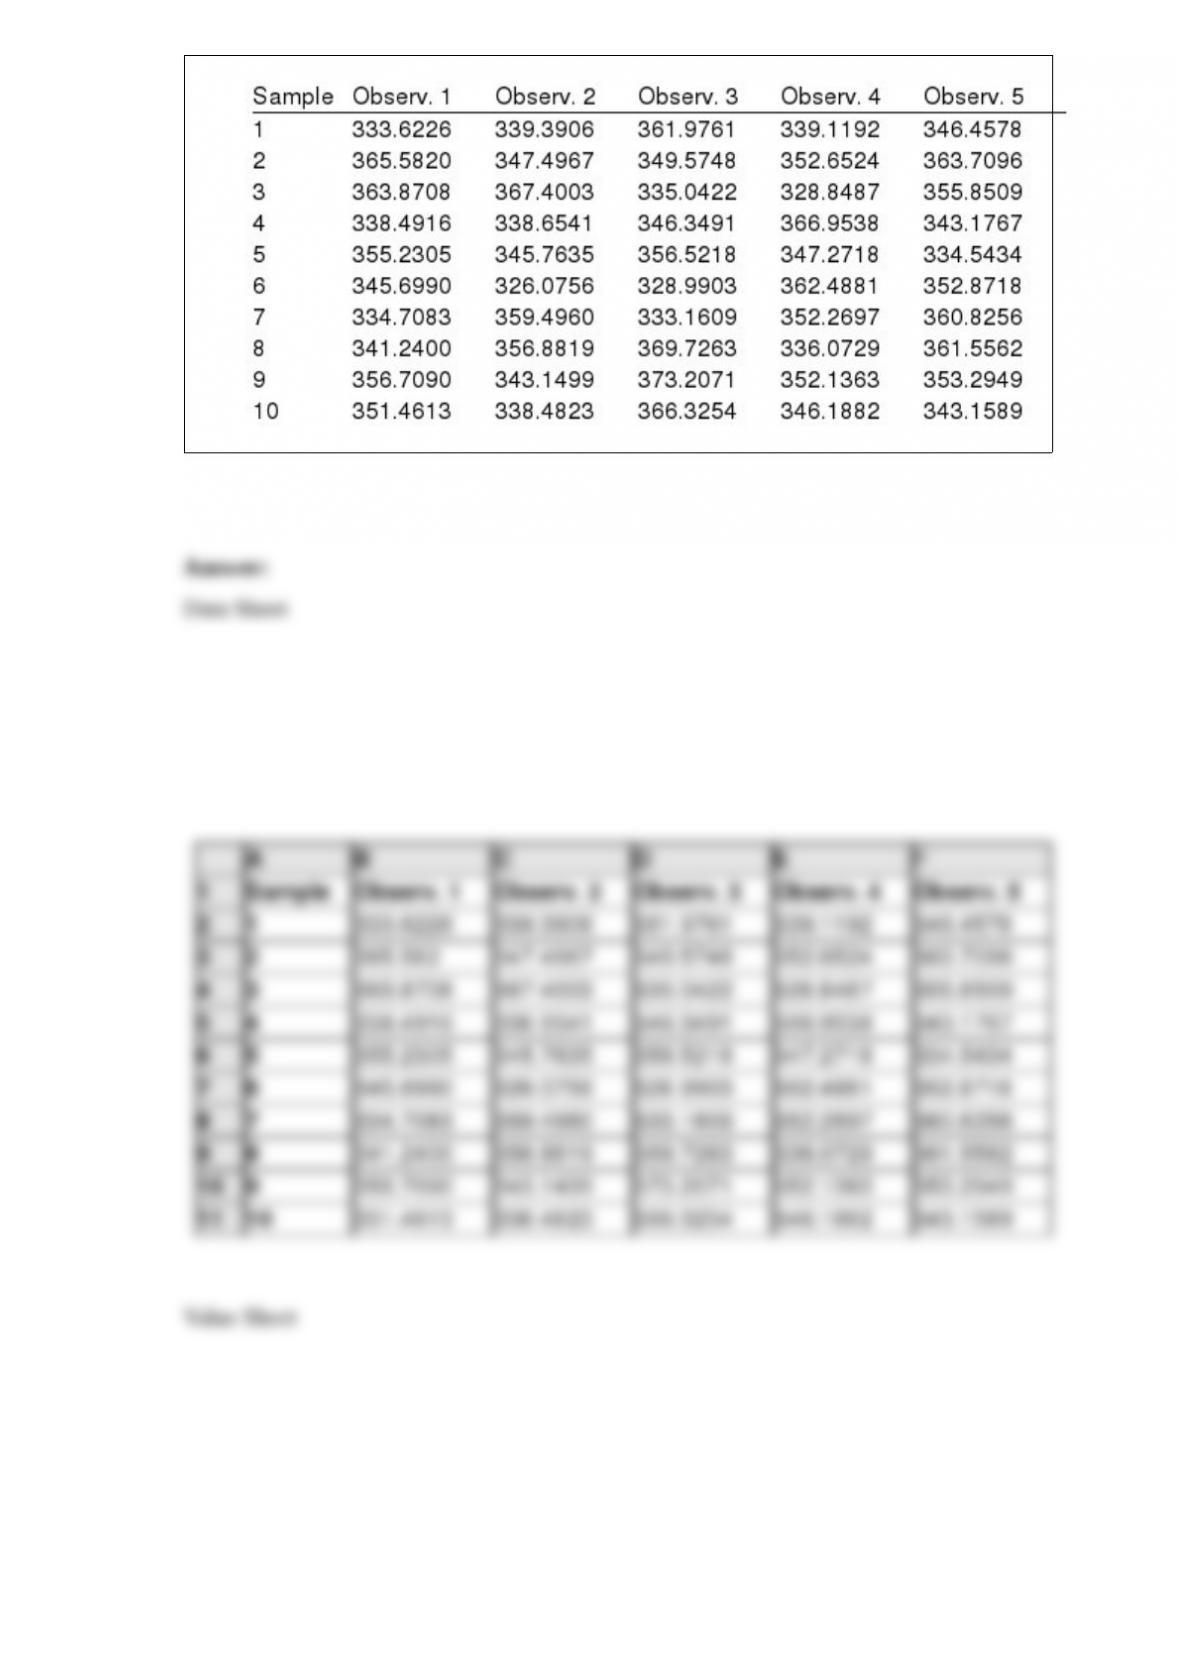
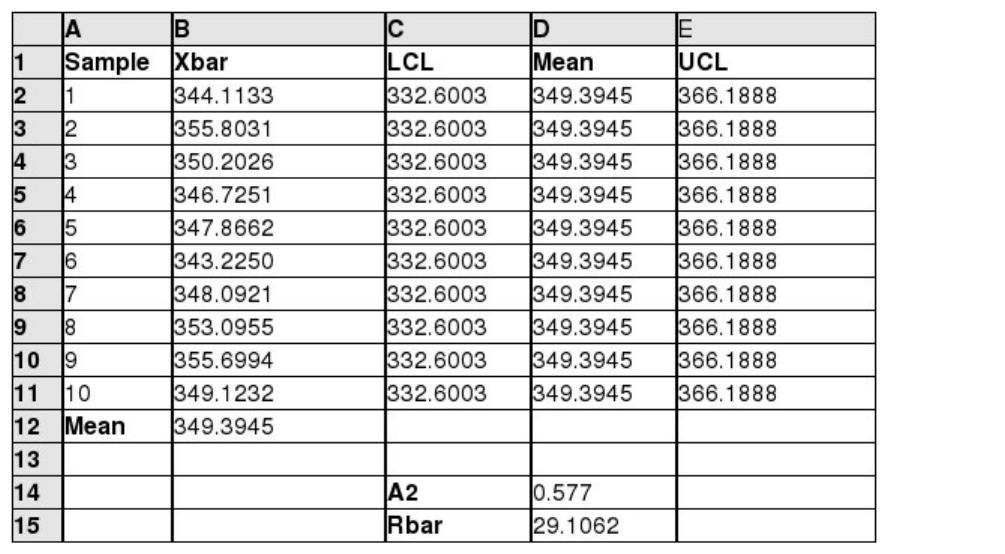
The following data represent the filling weights based on samples of 350-gram
containers. Ten samples of size 5 were taken. Use Excel to develop an x-bar chart.
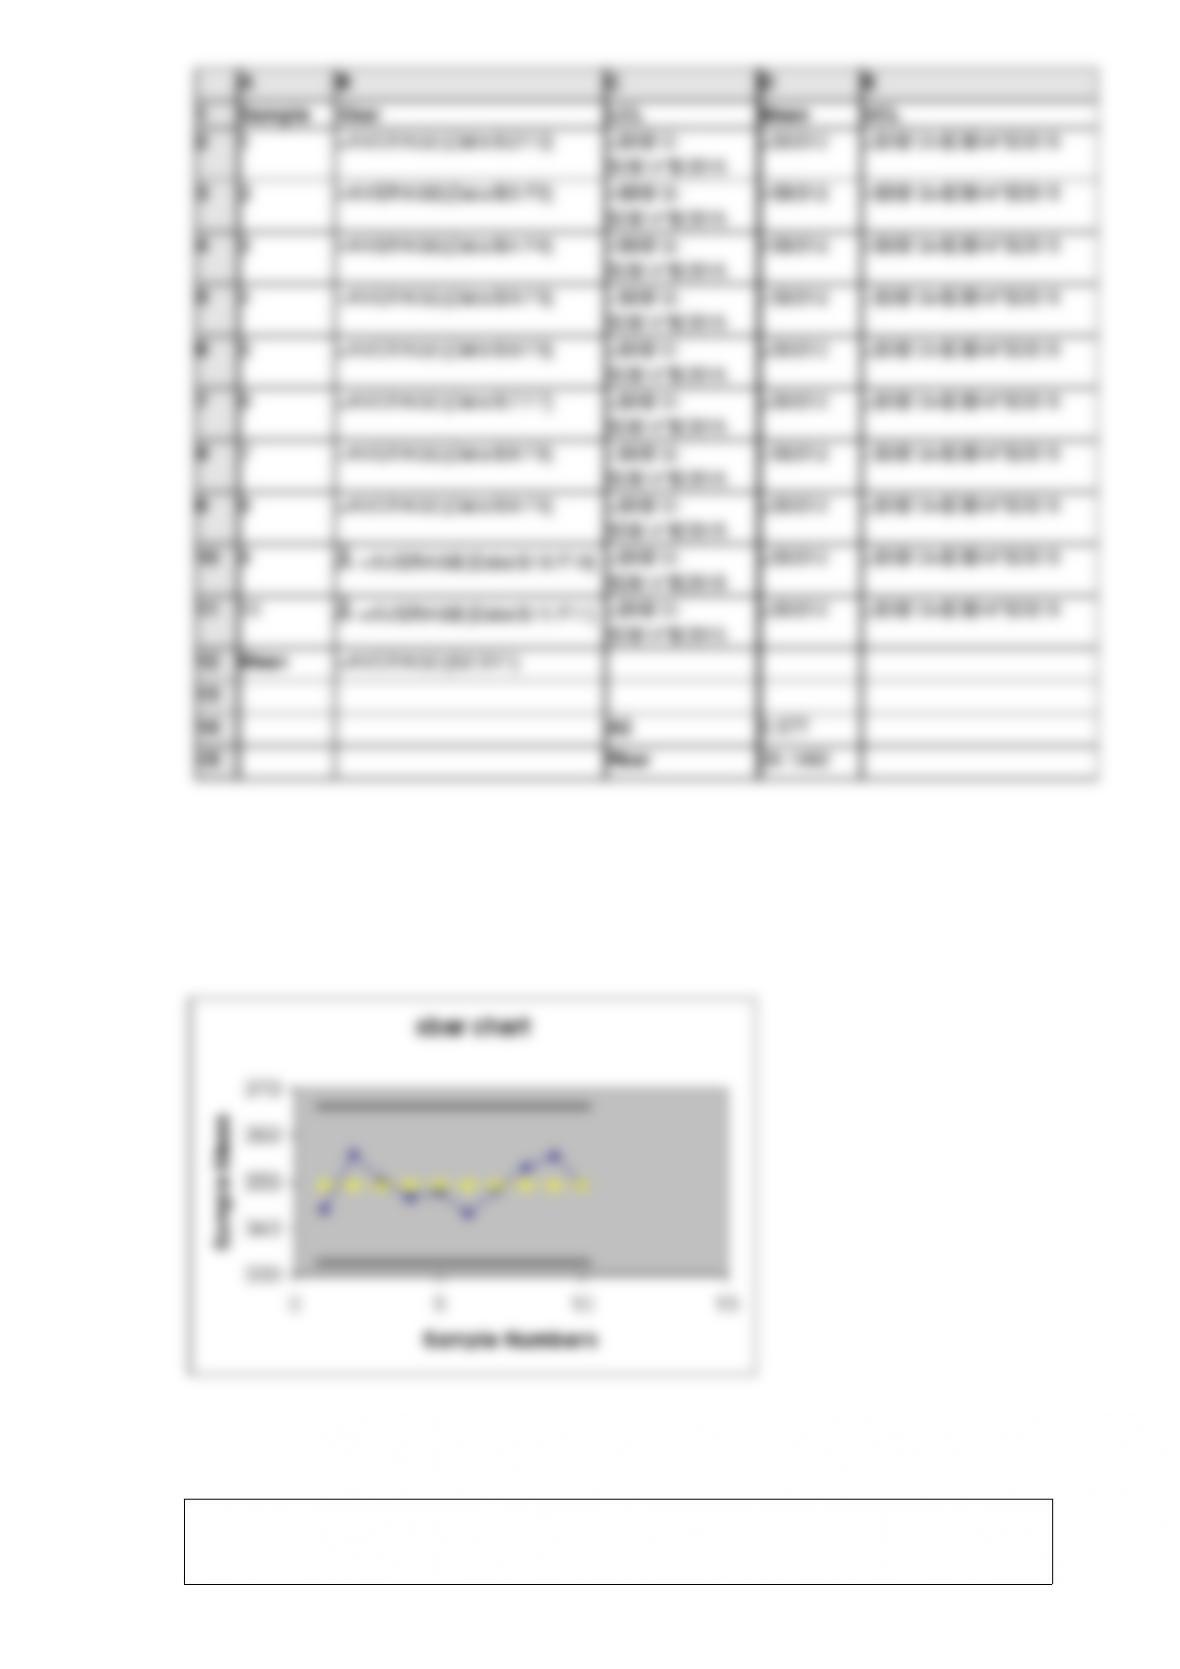
Two faculty members ranked 12 candidates for scholarships. Calculate the Spearman
rank-correlation coefficient and test whether the professors had significantly different
rankings. Use the .02 level of significance.
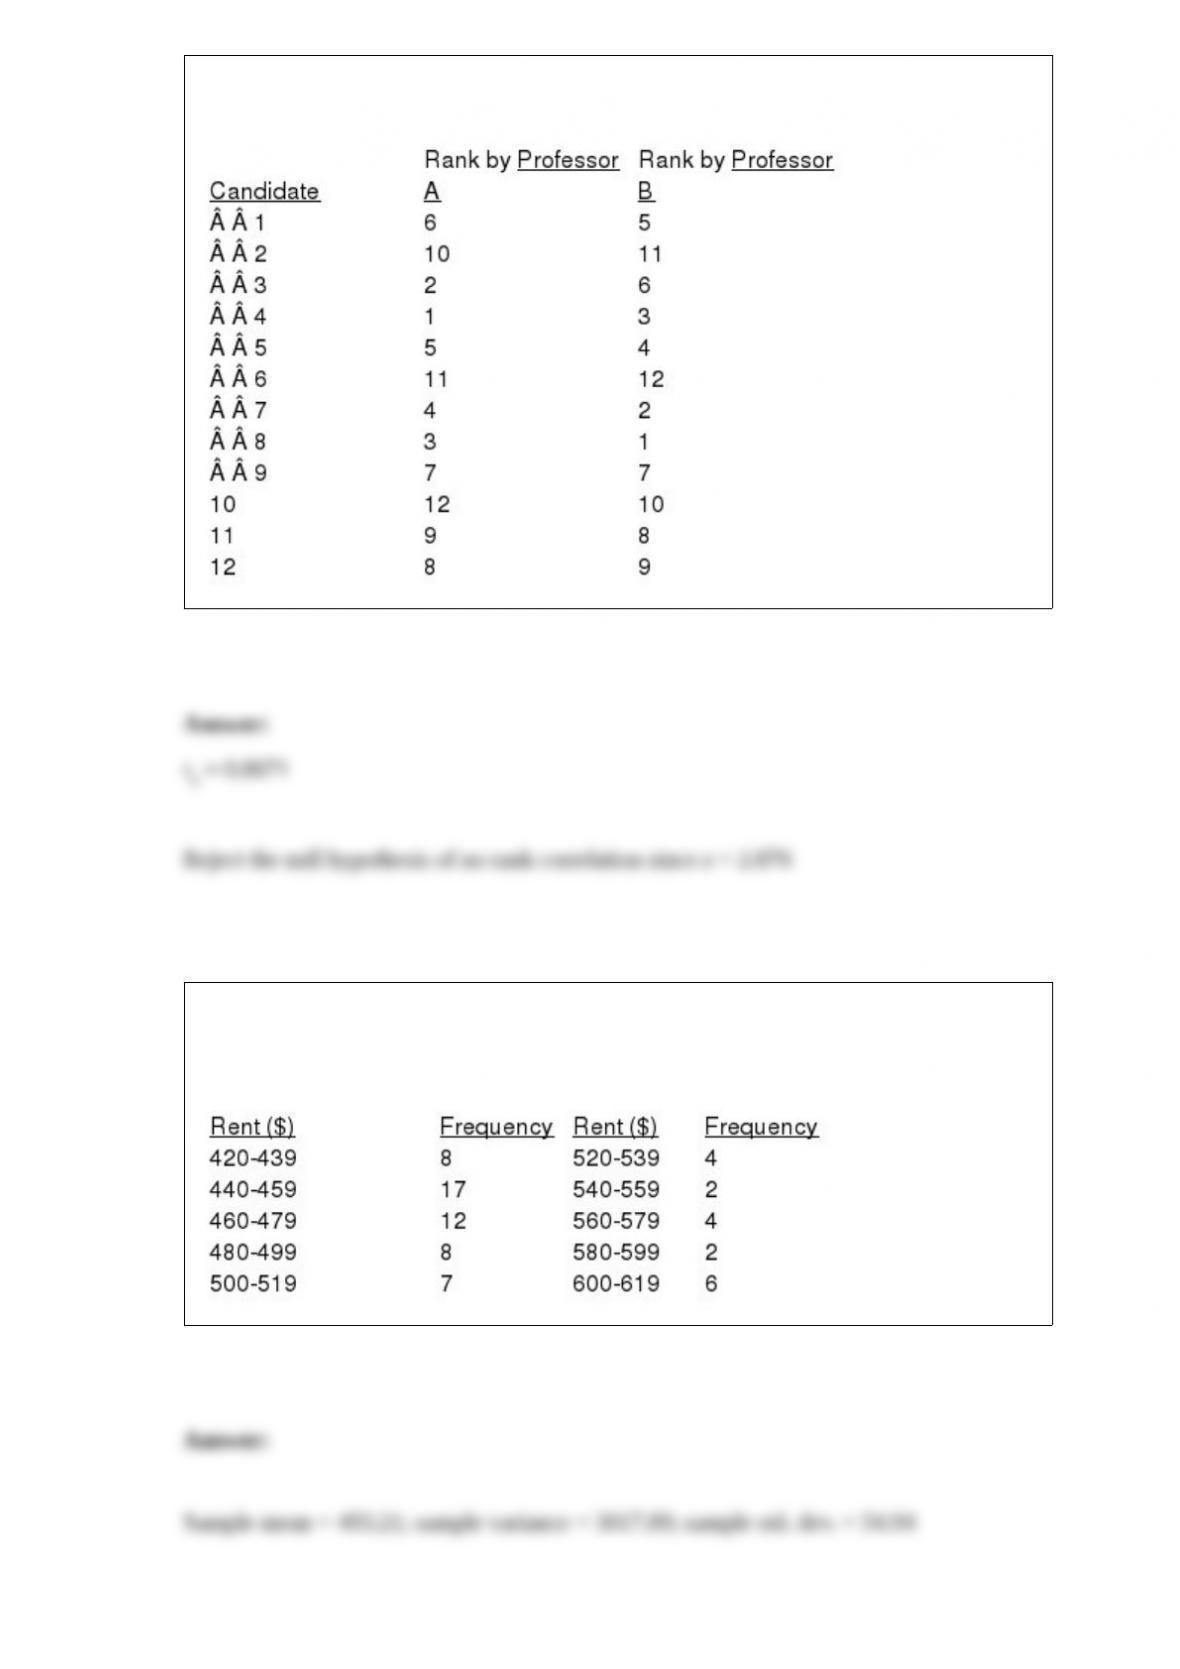
Given below is a sample of 70 monthly rents for one-bedroom apartments presented as
grouped data in the form of a frequency distribution. Compute the sample mean,
variance, and standard deviation.

A regression model relating a dependent variable, y, with one independent variable, x1,
resulted in an SSE of 400. Another regression model with the same dependent variable,
y, and two independent variables, x1 and x2, resulted in an SSE of 320. At = .05,
determine if x2 contributed significantly to the model. The sample size for both models
was 20.