
The variance is a weighted average of the
a. square root of the deviations from the mean
b. square root of the deviations from the median
c. squared deviations from the median
d. squared deviations from the mean
Exhibit 18-6
It is believed that the median yearly income in a suburb of Atlanta is $70,000. A sample
of 67 residents was taken. Thirty-eight had yearly incomes above $70,000, 26 had
yearly incomes below $70,000, and 3 had yearly incomes equal to $70,000. The null
hypothesis to be tested is H0: median = $70,000.
Refer to Exhibit 18-6. The null hypothesis should be
a. rejected
b. not rejected
c. revised
d. None of these alternatives is correct.
Exhibit 14-3
Regression analysis was applied between sales data (in $1,000s) and advertising data

(in $100s) and the following information was obtained.
Refer to Exhibit 14-3. The t statistic for testing the significance of the slope is
a. 1.80
b. 1.96
c. 6.709
d. 0.555
Consider the following hypothesis test:
Ho: p 0.5
Ha: p 0.5
A sample of 800 provided a sample proportion of 0.58.
a. Using 0.05, what is the rejection rule?
b. Determine the standard error of the proportion.
c. Compute the value of the test statistic z. What is your conclusion?
d. Determine the p-value.
A fast food restaurant is considering a promotion that will offer customers to purchase a
toy featuring a cartoon movie character. If more than 20% of the customers purchase
the toy, the promotion will be profitable. A sample of 50 restaurants is used to test the
promotion.
a. State the hypotheses associated with the restaurant’s test.
b. Describe a Type I error for this situation.
c. Describe a Type II error for this situation.
Suppose we are interested in investing in one of three investment opportunities: d1, d2,
or d3. The following profit payoff table shows the profits (in thousands of dollars) under
each of the 3 possible economic conditionsS1, S2, and S3:
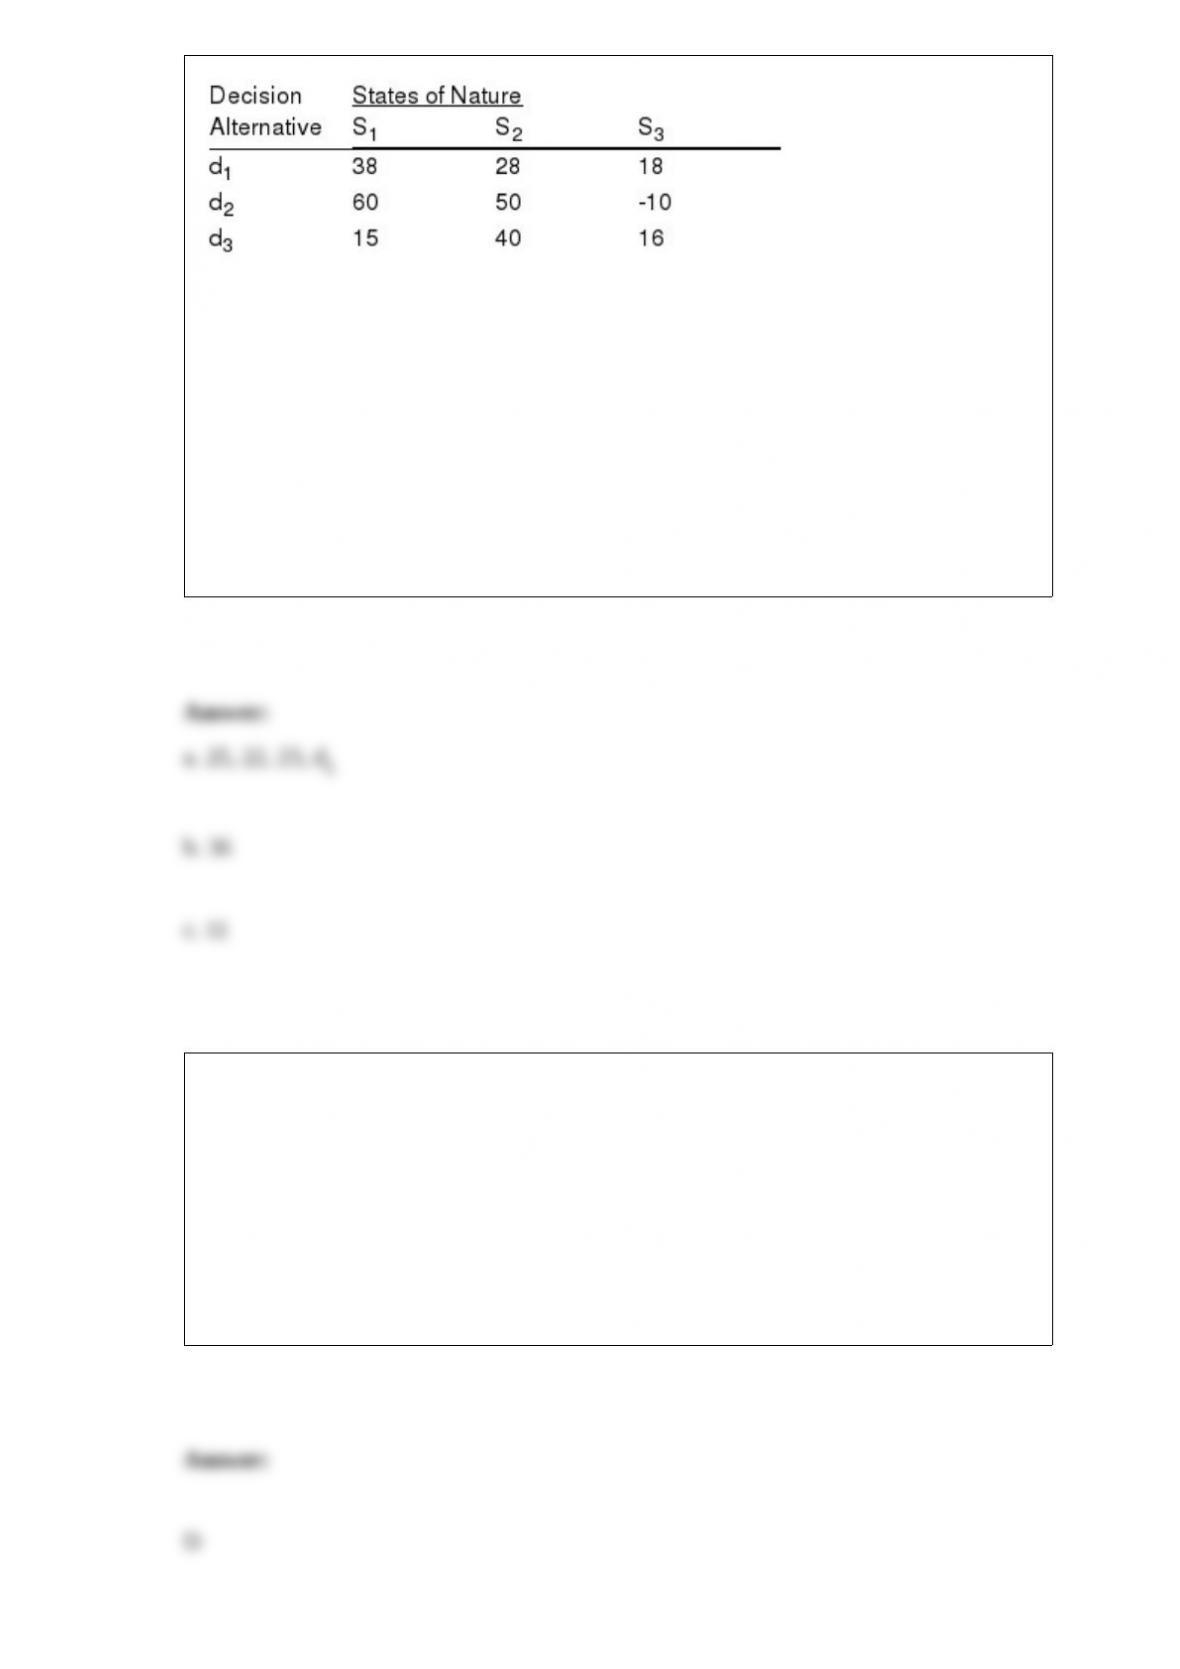
Assume the states of nature have the following probabilities of occurrence: P(S1) = 0.2
P(S2) = 0.3 P(S3) = 0.5
a. Determine the expected value of each alternative and indicate which decision
alternative is the best.
b. Determine the expected value with perfect information about the states of nature.
c. Determine the expected value of perfect information.
A probability distribution for all possible values of a sample statistic is known as a
a. sample statistic
b. parameter
c. simple random sample
d. sampling distribution

Exhibit 11-6
We want to test the hypothesis that the population variances are equal.
Refer to Exhibit 11-6. The null hypothesis
a. should be rejected
b. should not be rejected
c. should be revised
d. None of these alternatives is correct.
As the goodness of fit for the estimated regression equation increases,
a. the absolute value of the regression equation’s slope increases
b. the value of the regression equation’s y intercept decreases
c. the value of the coefficient of determination increases
d. the value of the correlation coefficient increases

Exhibit 10-10
The results of a recent poll on the preference of shoppers regarding two products are
shown below.
Refer to Exhibit 10-10. At 95% confidence, the margin of error is
a. 0.064
b. 0.044
c. 0.0225
d. 52
Convenience sampling is an example of
a. probabilistic sampling
b. sampling where the probabilities are known
c. nonprobabilistic sampling
d. None of these alternatives is correct.

X is a normally distributed random variable with a mean of 50 and a standard deviation
of 5. Use Excel to calculate the following:
a. P(x 45)
b. P(45 x 55)
c. P(x 55)
d. x value with .20 in the lower tail
e. x value with .01 in the upper tail
A nonparametric test would be used if
a. nominal data is available
b. interval data is available
c. it is known that the population is normally distributed
d. None of these alternatives is correct.
Given that z is a standard normal random variable, what is the value of z if the area to
the right of z is 0.1401?
a. 1.08
b. 0.1401
c. 2.16
d. -1.08
The value of the sum of the squared deviations from the mean, i.e., must
always be
a. less than the mean
b. negative
c. either positive or negative depending on whether the mean is negative or positive
d. at least zero
Which of the following is not a measure of variability of a single variable?
a. range
b. covariance
c. standard deviation
d. coefficient of variation

Which of the following is a measure of dispersion?
a. percentiles
b. quartiles
c. interquartile range
d. all of these are measures of dispersion