Unlock document.
This document is partially blurred.
Unlock all pages and 1 million more documents.
Get Access

Exhibit 6-4
The starting salaries of individuals with an MBA degree are normally distributed with a
mean of $40,000 and a standard deviation of $5,000.
Refer to Exhibit 6-4. What is the probability that a randomly selected individual with an
MBA degree will get a starting salary of at least $47,500?
a. 0.4332
b. 0.9332
c. 0.0668
d. 0.5000
A decision criterion which weights the payoff for each decision by its probability of
occurrence is known as the
a. payoff criterion
b. expected value criterion
c. probability
d. expected value of perfect information
A random sample of 21 checking accounts at a bank showed an average daily balance
of $430 with a standard deviation of $50.

The weight of an object, measured to the nearest gram, is an example of
a. a continuous random variable
b. a discrete random variable
c. either a continuous or a discrete random variable, depending on the weight of the
object
d. either a continuous or a discrete random variable depending on the units of
measurement
The Department of Transportation of a city has noted that on the average there are 14
accidents per day. The average number of accidents is an example of
a. descriptive statistics
b. statistical inference
c. a sample

d. a population
Ten percent of the items produced by a machine are defective. Out of 15 items chosen
at random,
a. what is the probability that exactly 3 items will be defective?
b. what is the probability that less than 3 items will be defective?
c. what is the probability that exactly 11 items will be non-defective?
For the interval estimation of when is assumed known, the proper distribution to
use is the
a. standard normal distribution
b. t distribution with n degrees of freedom
c. t distribution with n 1 degrees of freedom
d. t distribution with n 2 degrees of freedom

Simple random sampling has been used to obtain a sample of n = 40 elements from a
population of N=300. The sample proportion
Exhibit 5-11
The random variable x is the number of occurrences of an event over an interval of ten
minutes. It can be assumed that the probability of an occurrence is the same in any two
time periods of an equal length. It is known that the mean number of occurrences in ten
minutes is 5.3.
Refer to Exhibit 5-11. The expected value of the random variable x is
a. 2
b. 5.3
c. 10
d. 2.30
An ANOVA procedure is applied to data obtained from 6 samples where each sample
contains 20 observations. The degrees of freedom for the critical value of F are
a. 6 numerator and 20 denominator degrees of freedom
b. 5 numerator and 20 denominator degrees of freedom
c. 5 numerator and 114 denominator degrees of freedom
d. 6 numerator and 20 denominator degrees of freedom
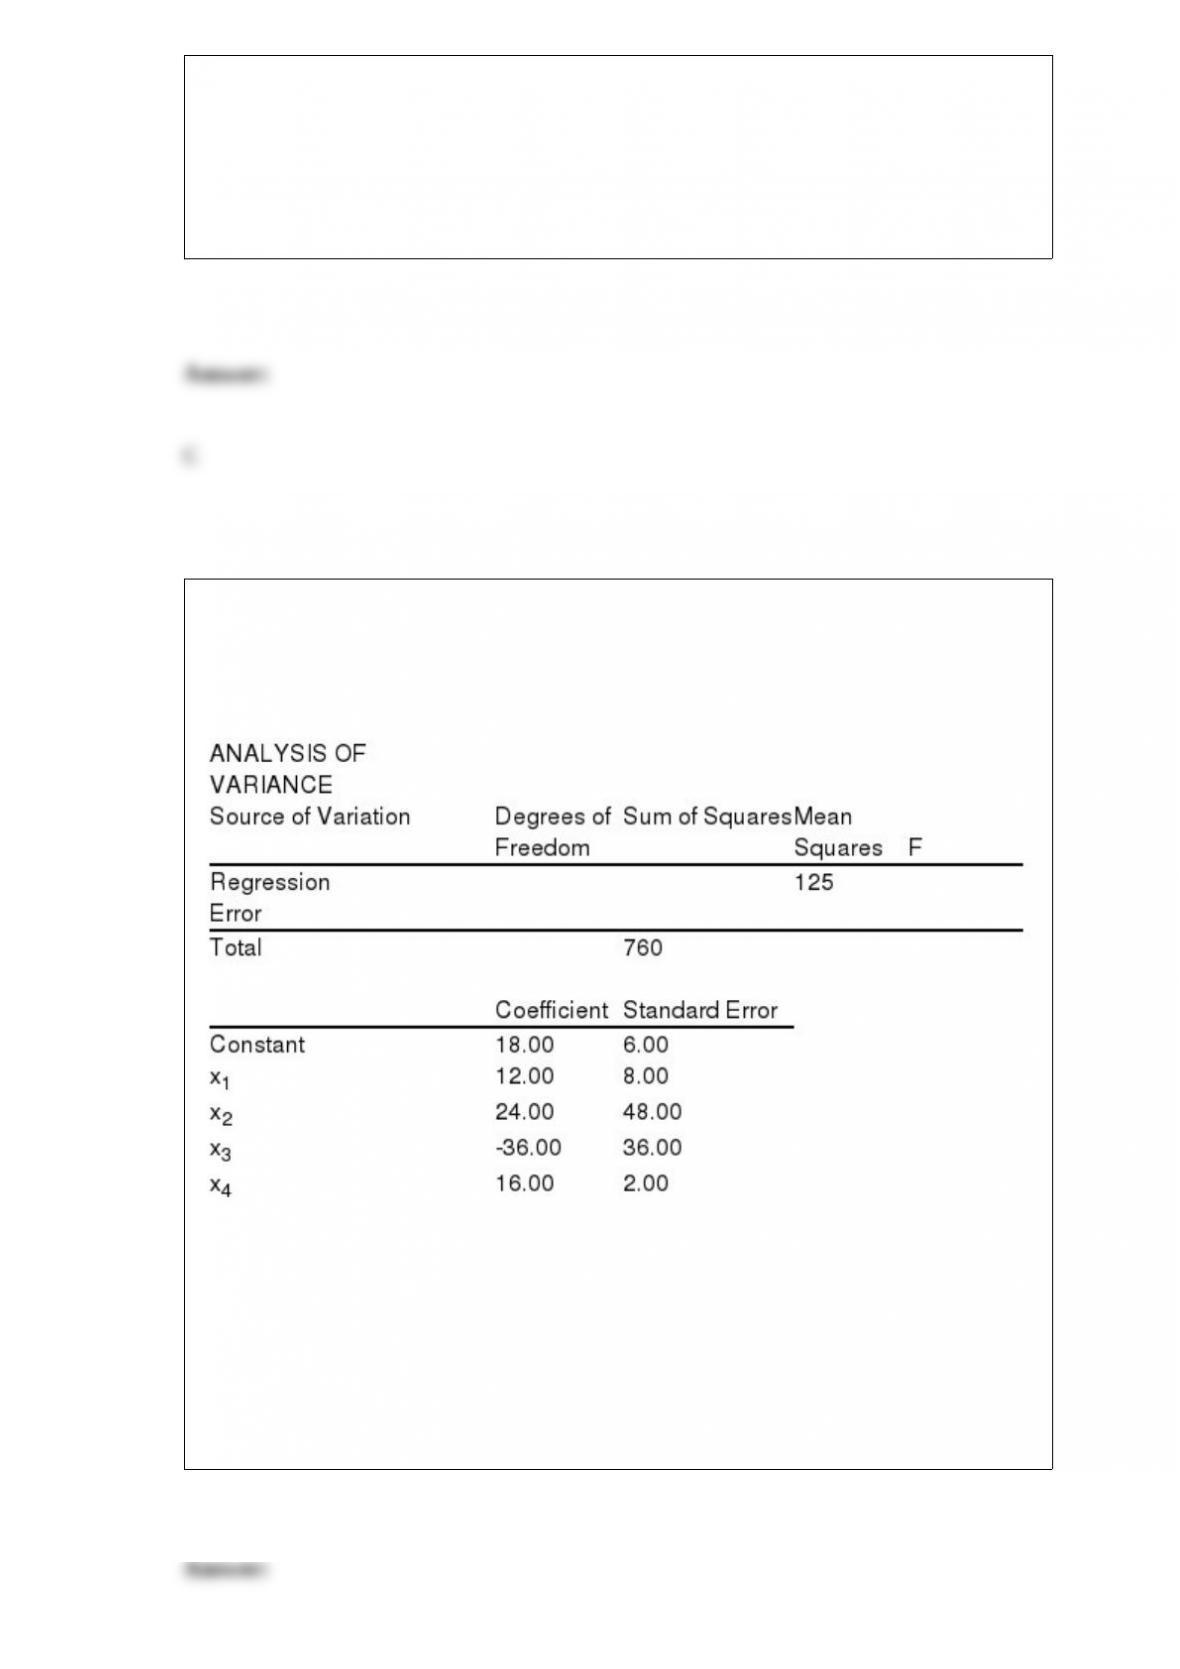
Multiple regression analysis was used to study the relationship between a dependent
variable, y, and four independent variables; x1, x2, x3 and, x4. The following is a partial
result of the regression analysis involving 31 observations.
a. Compute the coefficient of determination.
b. At = 0.05, perform an F test and determine whether or not the regression model is
significant.
c. Perform a t test and determine whether or not 1 is significantly different from zero
( = 0.05).
d. Perform a t test and determine whether or not 4 is significantly different from zero
( = 0.05).

Initial estimates of the probabilities of events are known as
a. sets
b. posterior probabilities
c. conditional probabilities
d. prior probabilities
Excel's Chart Tools can be used to construct a
a. bar chart
b. pie chart
c. histogram
d. All of these can be constructed using Excel's Chart Tools.

Exhibit 10-5
The following information was obtained from matched samples.
Refer to Exhibit 10-5. The null hypothesis tested is H0: d = 0. The test statistic for the
difference between the two population means is
a. 2
b. 0
c. -1
d. -2
Experts in problem solving agree that the first step in solving a complex problem is to
a. decompose it into a series of smaller subproblems
b. acquire the best software available for solving it
c. assign several teams to work on it simultaneously
d. recognize your staff's limitations and hire expert consultants
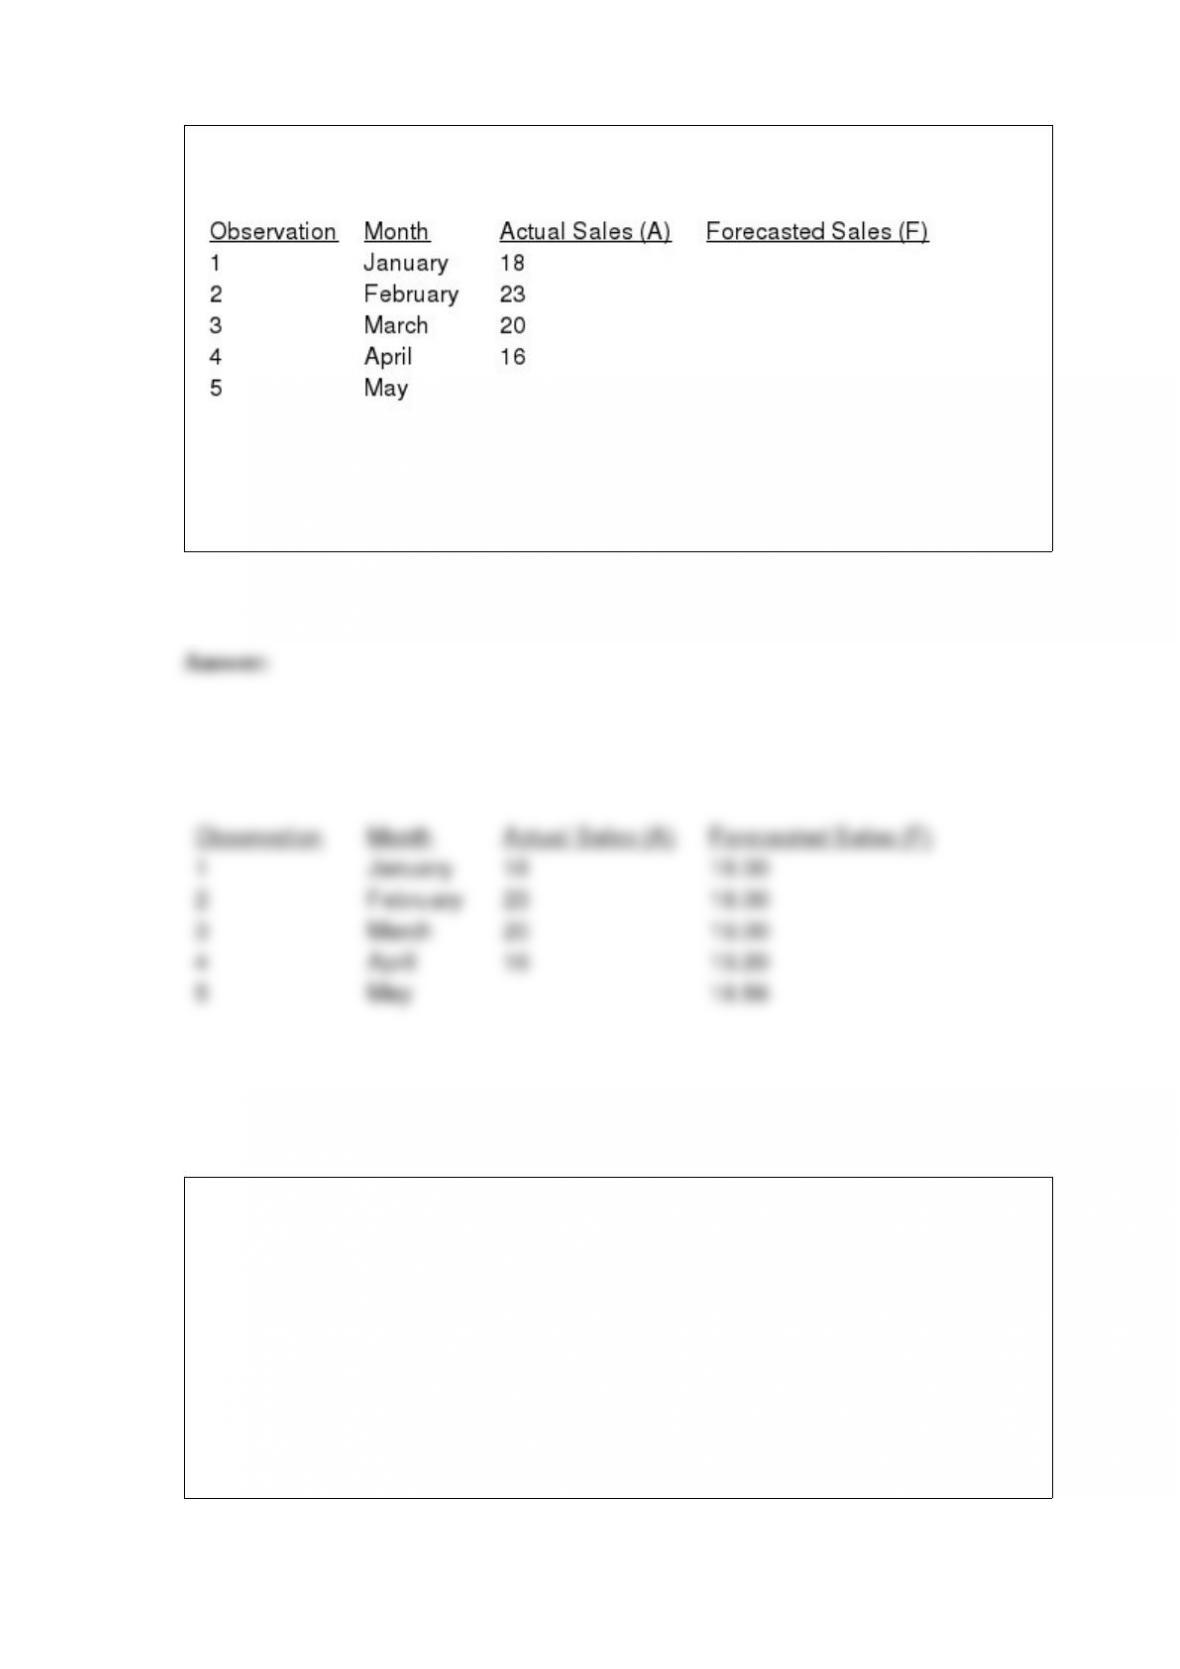
Actual sales for January through April are shown below.
Use exponential smoothing with = 0.2 to calculate smoothed averages and forecast
sales for May from the above data. Assume the forecast for the initial period (January)
is 18. Show all of your computations.
When the results of experimentation or historical data are used to assign probability
values, the method used to assign probabilities is referred to as the
a. relative frequency method
b. subjective method
c. classical method
d. posterior method
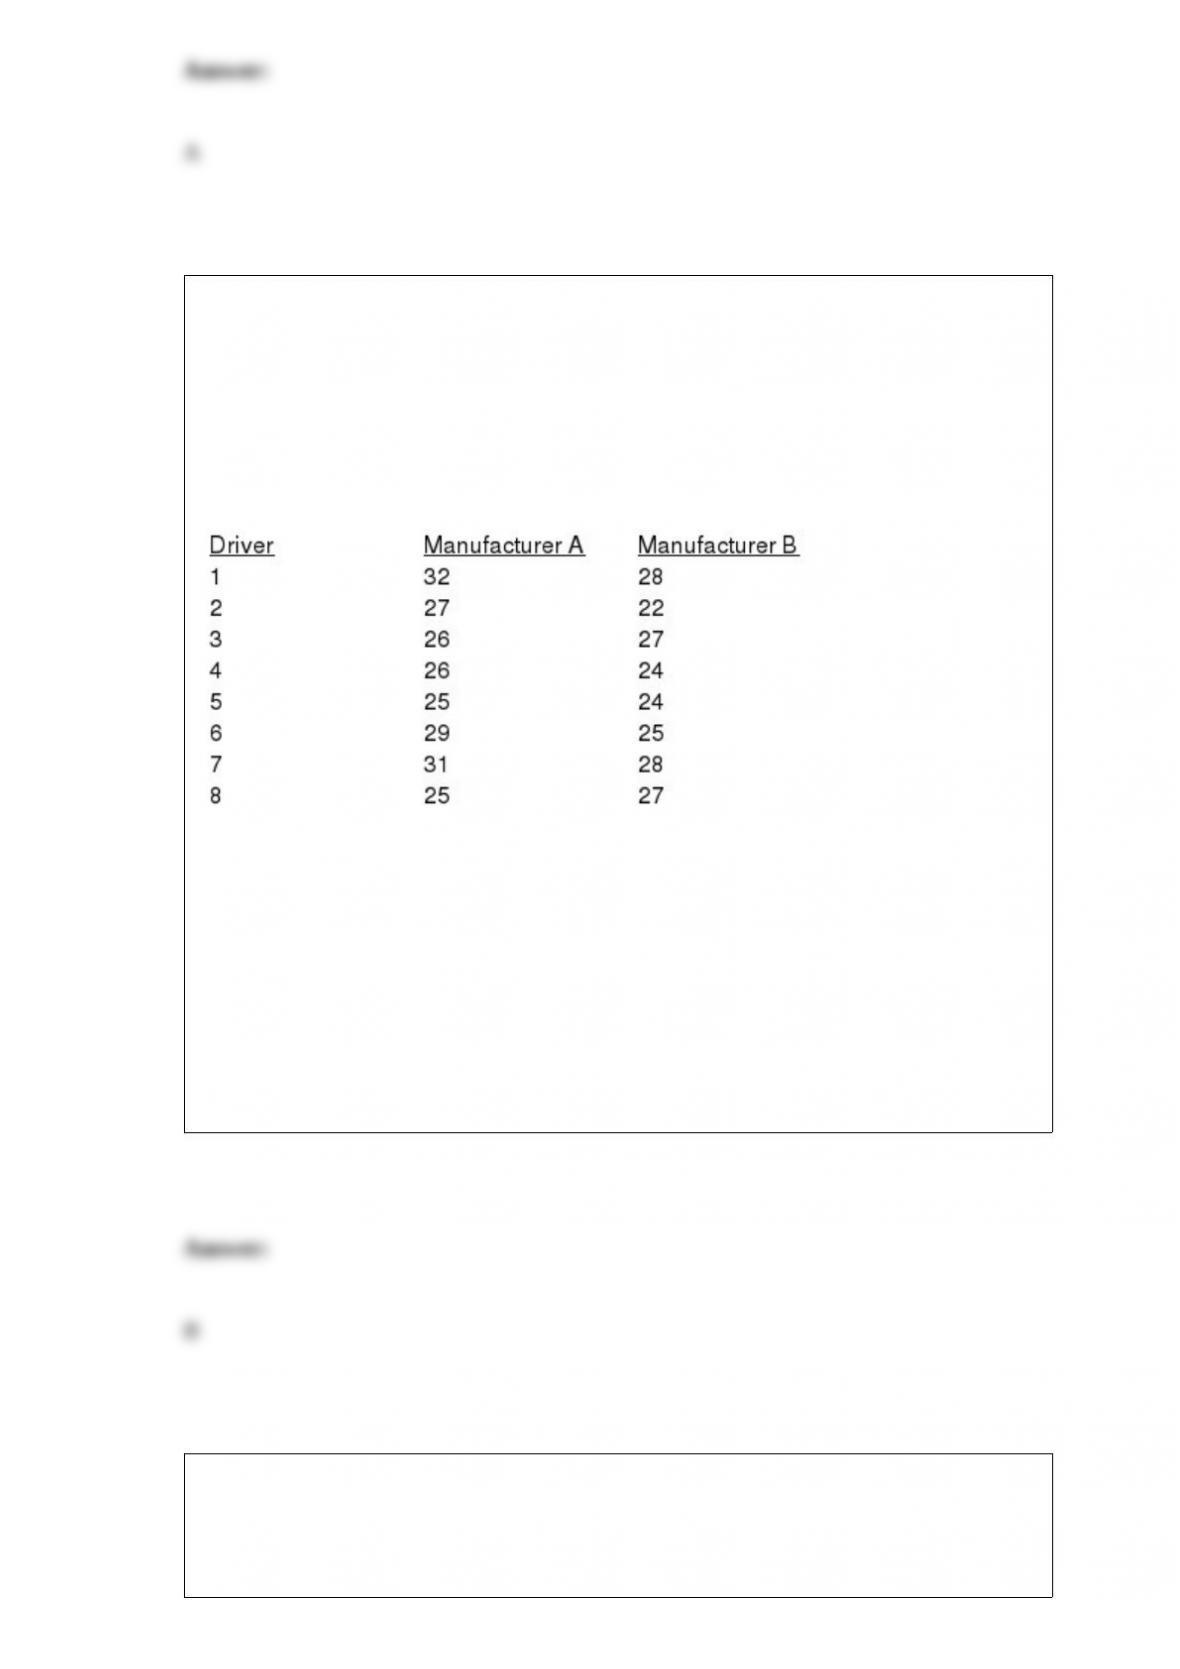
Exhibit 10-9
Two major automobile manufacturers have produced compact cars with the same size
engines. We are interested in determining whether or not there is a significant difference
in the MPG (miles per gallon) of the two brands of automobiles. A random sample of
eight cars from each manufacturer is selected, and eight drivers are selected to drive
each automobile for a specified distance. The following data show the results of the test.
Refer to Exhibit 10-9. At 90% confidence the null hypothesis
a. should not be rejected
b. should be rejected
c. should be revised
d. None of these alternatives is correct.
If two groups of numbers have the same mean, then their
a. standard deviations must also be equal
b. medians must also be equal
c. modes must also be equal
d. None of the other answers are correct.
The standard deviation of all possible values is called the
a. standard error of proportion
b. standard error of the mean
c. mean deviation
d. central variation
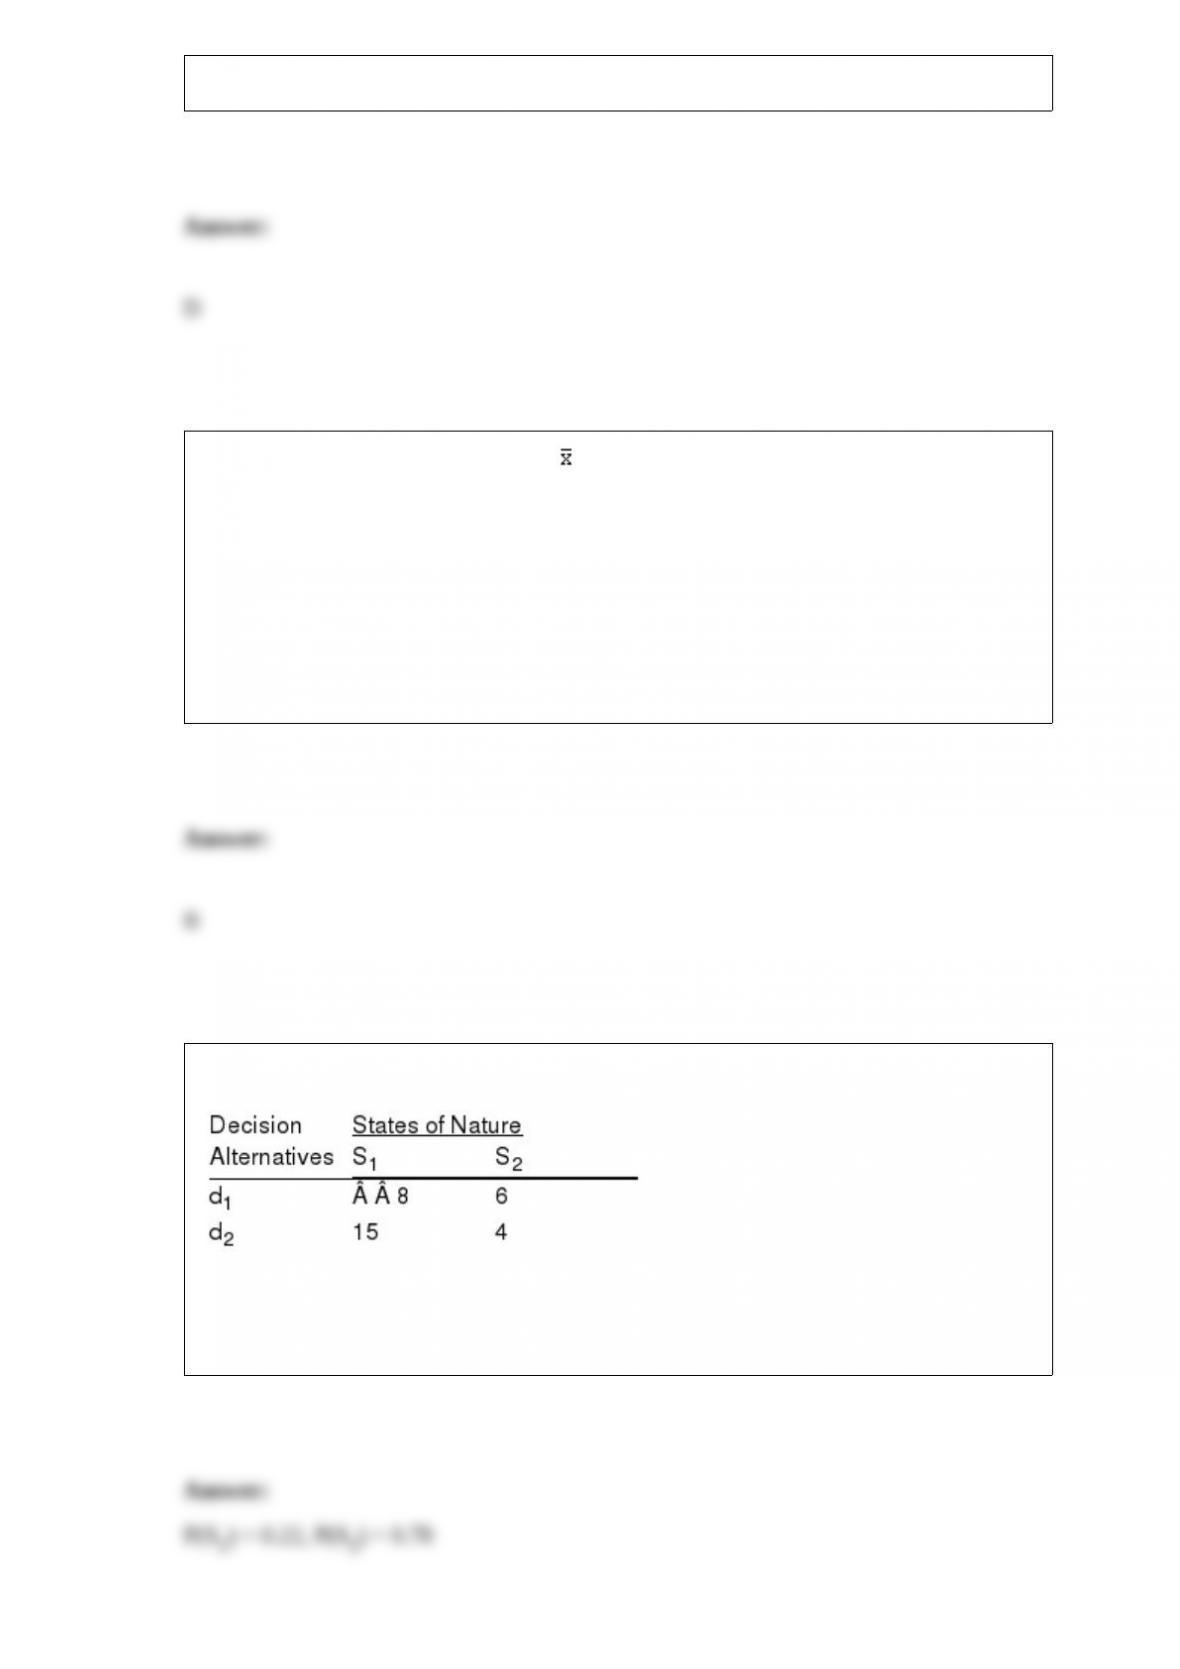
Consider the following profit payoff table.
What should the probabilities of S1 and S2 be so that the expected values of the two
decision alternatives equal one another?
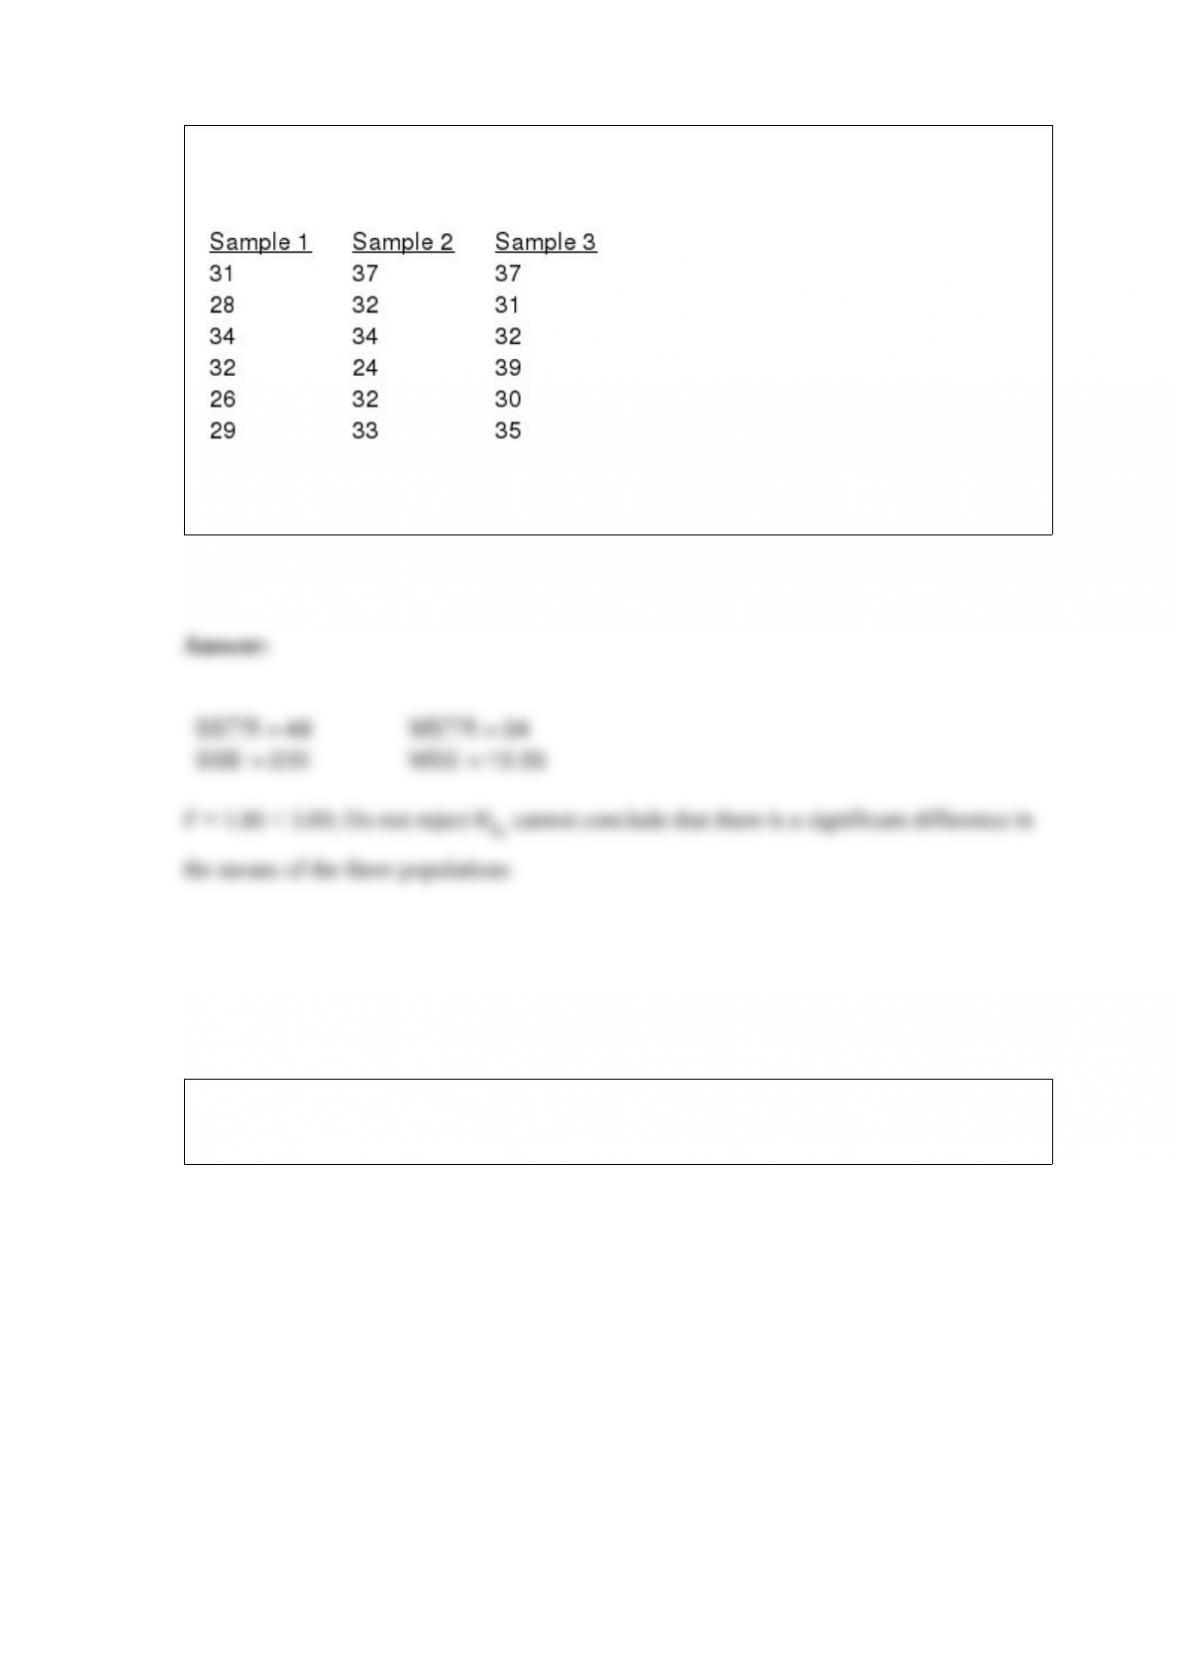
Six observations were selected from each of three populations. The data obtained is
shown below:
Test at = 0.05 level to determine if there is a significant difference in the means of the
three populations.
A survey of male and female students showed the following ranking of 12 professors in
the management department:
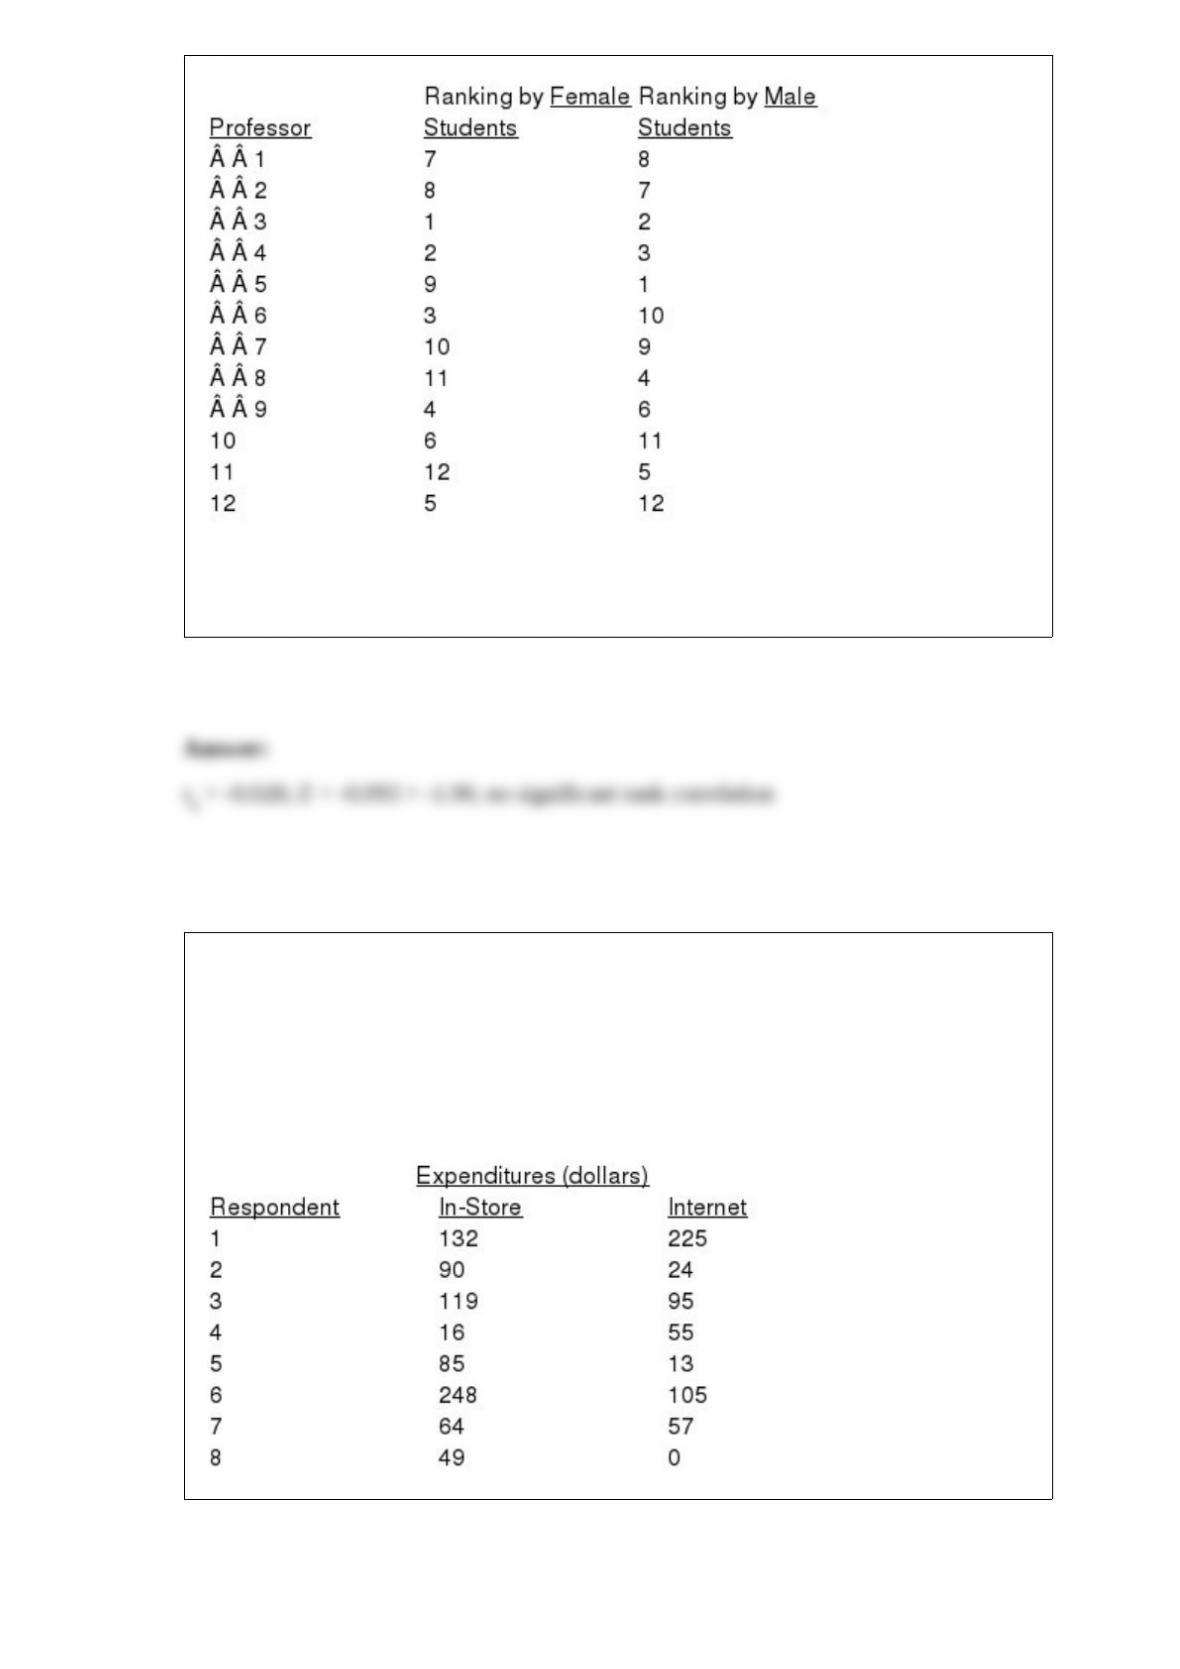
Do the rankings given by the female students agree with the rankings given by the male
students? Use = 0.05.
A survey was recently conducted to determine if consumers spend more on
computer-related purchases via the Internet or store visits. Assume a sample of
8 respondents provided the following data on their computer-related purchases
during a 30-day period. Using a .05 level of significance, can we conclude that
consumers spend more on computer-related purchases by way of the Internet
than by visiting stores?
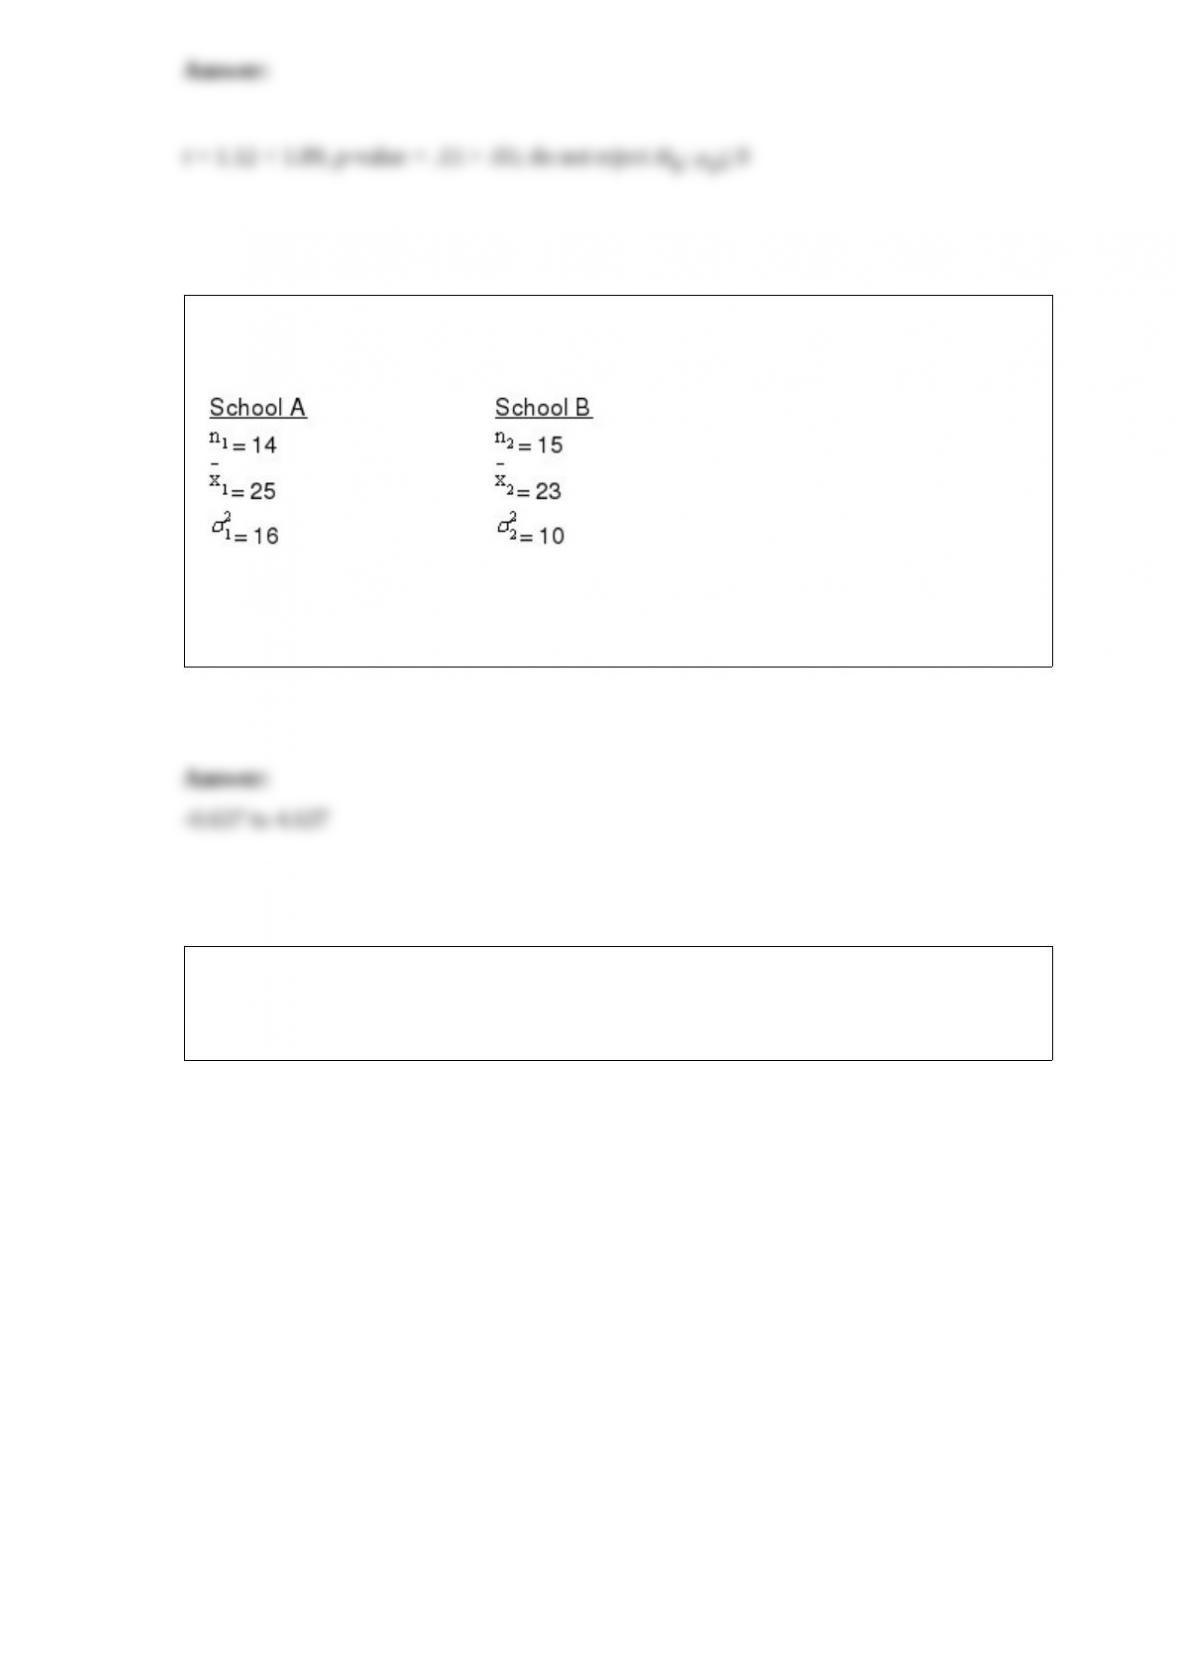
The following sample information is given concerning the ACT scores of high school
seniors form two local schools.
Develop a 95% confidence interval estimate for the difference between the two
populations.
Exhibit 17-4
The Espresso Cart has had the following pattern of espresso sales over the last two
weeks:

Refer to Exhibit 17-4. What is the forecast for Friday's sales using a 3-day weighted
moving average with weights of .5 (for newest), .3, and .2 (for oldest)?
881.3
889.4
893.6
894.7
A health club annually surveys its members. Last year, 33% of the members said they
use the treadmill at least 4 times a week. How large of sample should be taken this year
to estimate the percentage of members who use the treadmill at least 4 times a week?
The estimate is desired to have a margin of error of 5% with a 95% level of confidence.
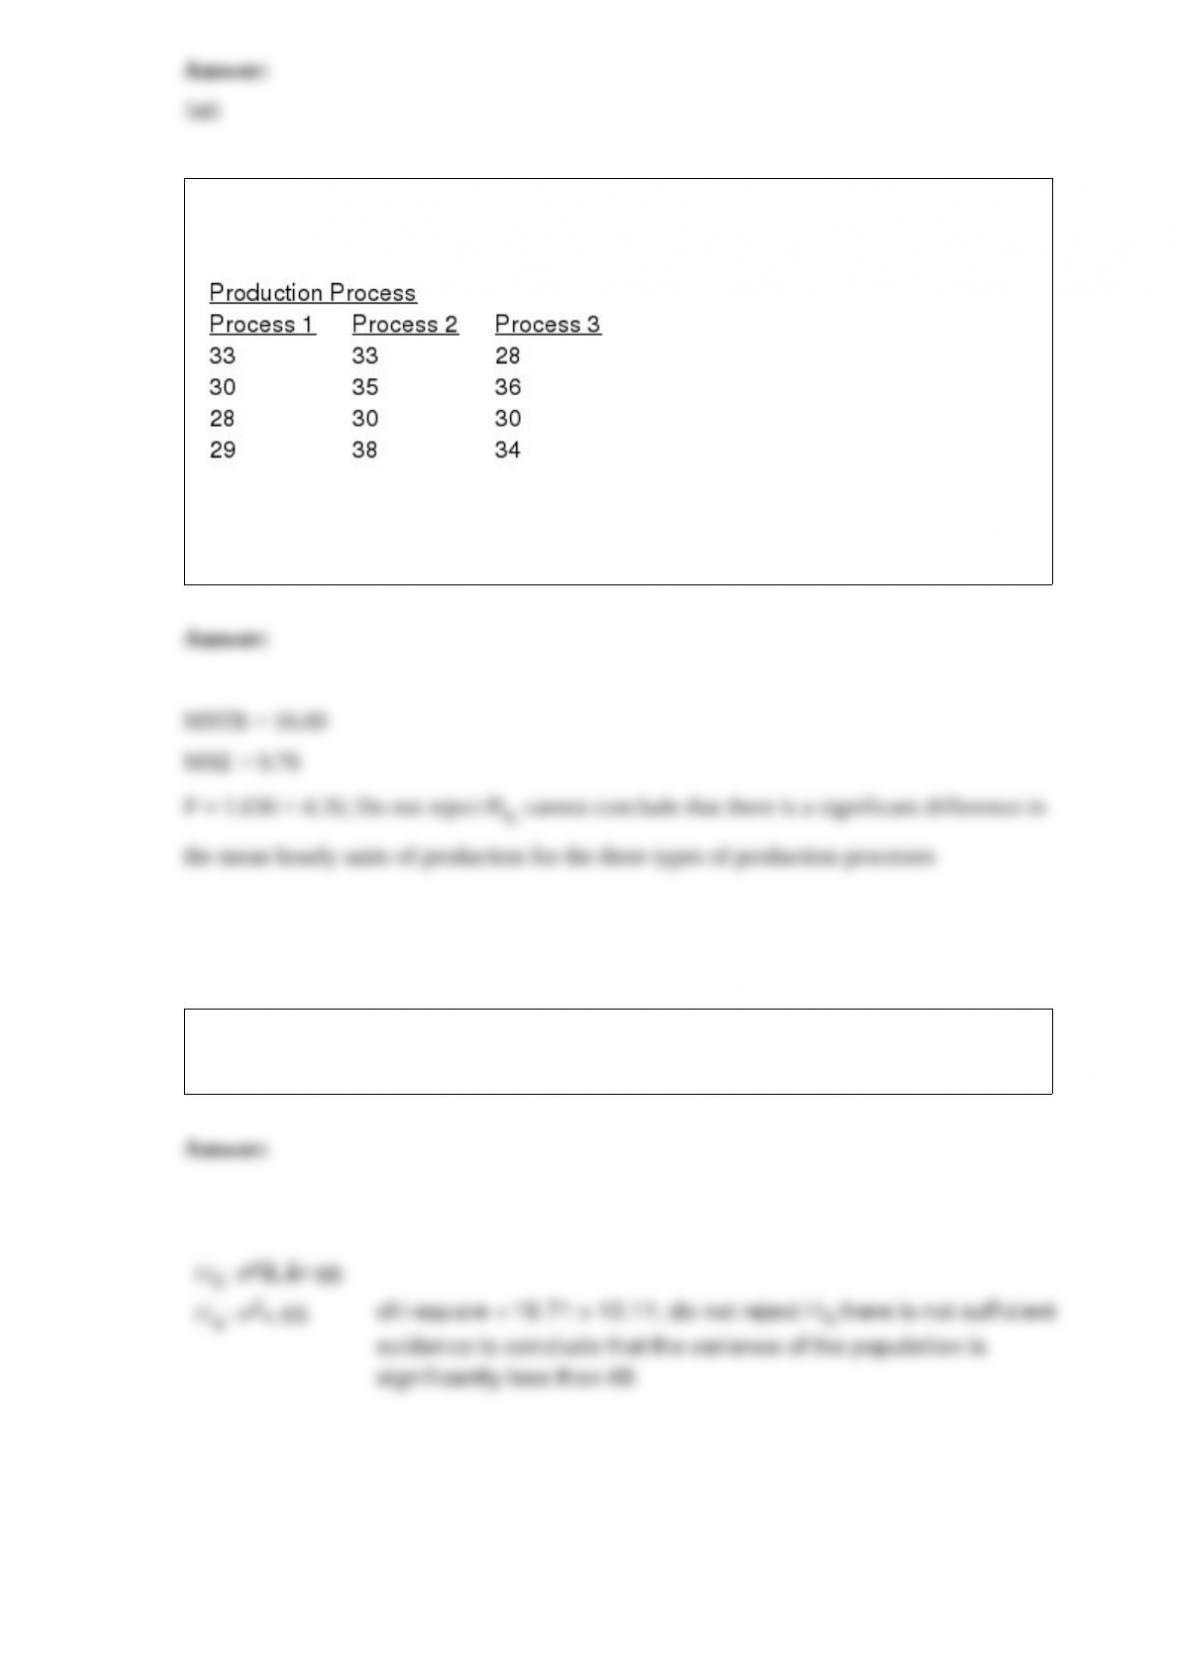
Individuals were randomly assigned to three different production processes. The hourly
units of production for the three processes are shown below.
Use the analysis of variance procedure with = 0.05 to determine if there is a
significant difference in the mean hourly units of production for the three types of
production processes.
A random sample of 20 observations showed a standard deviation of 8. At a 5% level of
significance, test to see if the variance of the population is significantly less than 65.


