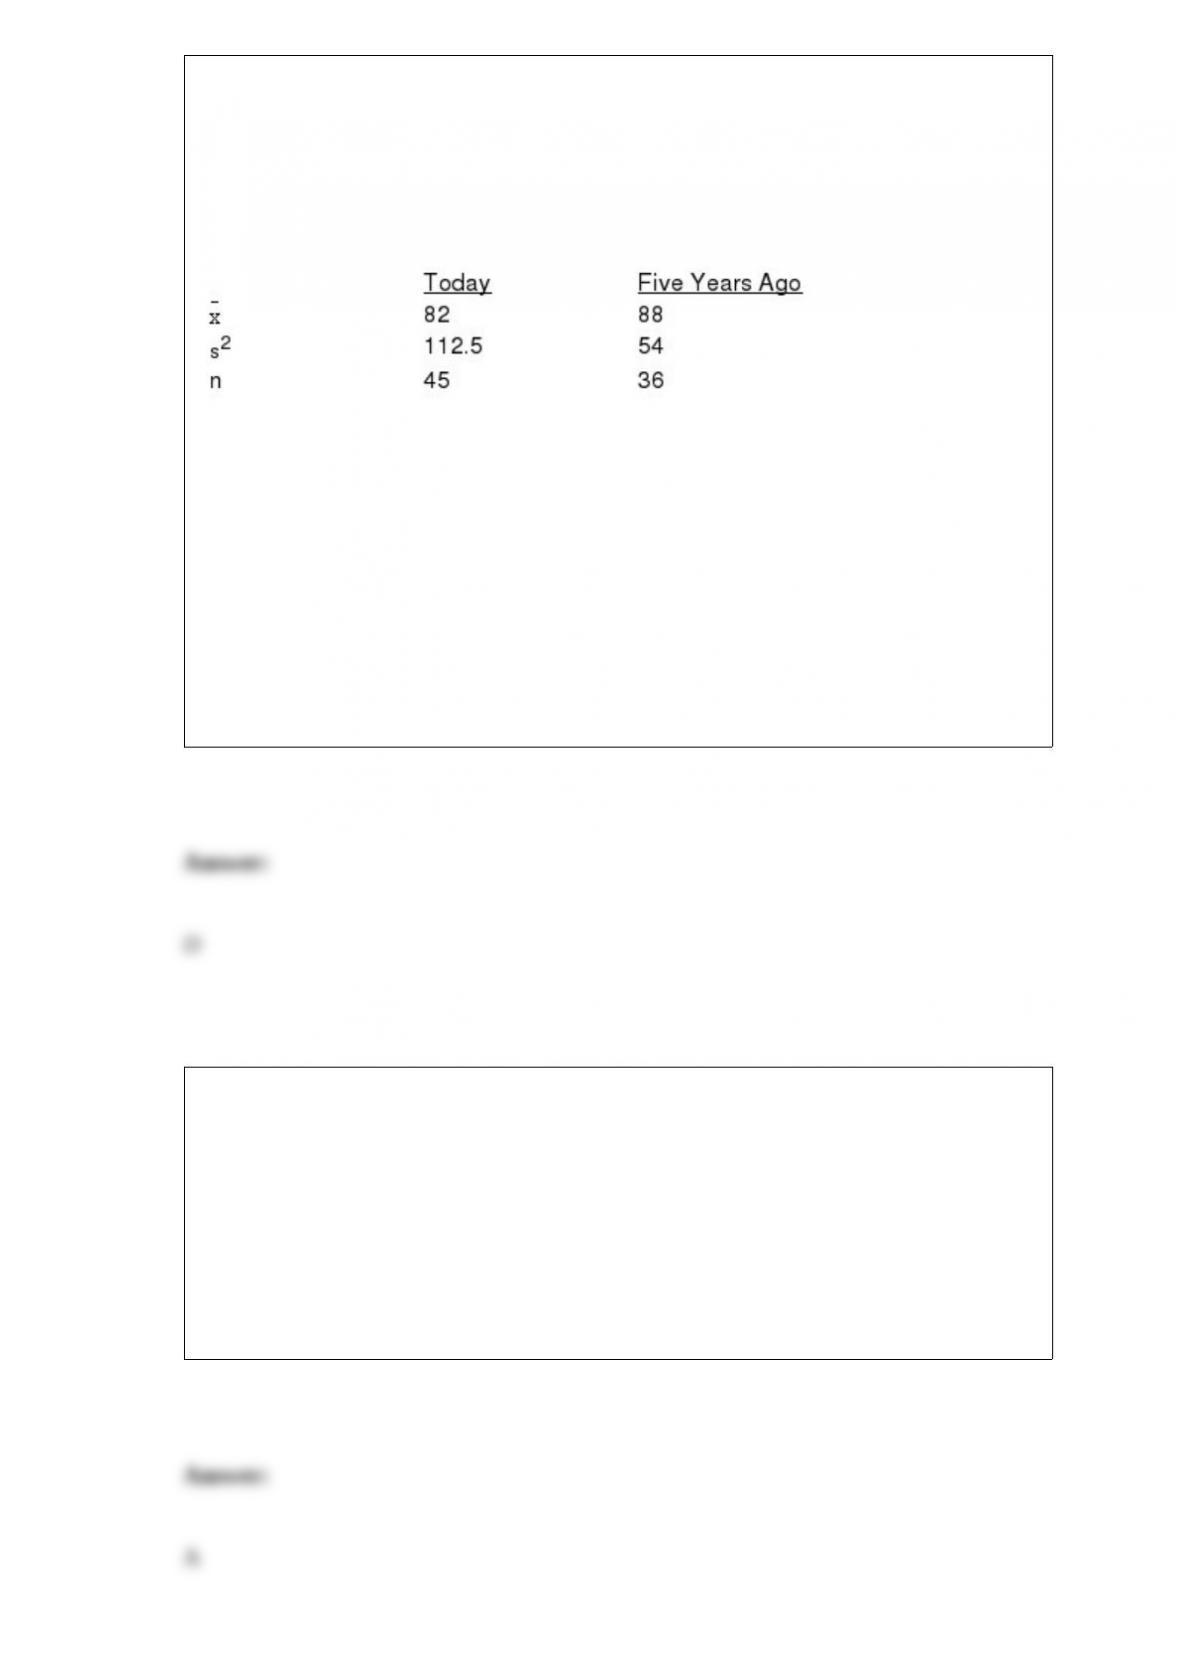
Exhibit 10-3
A statistics teacher wants to see if there is any difference in the abilities of students
enrolled in statistics today and those enrolled five years ago. A sample of final
examination scores from students enrolled today and from students enrolled five years
ago was taken. You are given the following information.
Refer to Exhibit 10-3. The test statistic for the difference between the two population
means is
a. -.47
b. -.65
c. -1.5
d. -3
Six Sigma represents a quality level of at most ____ defects per million opportunities.
a. 3.4
b. 6.0
c. 19.7
d. 99.5
The probability of at least one head in two flips of a coin is
a. 0.33
b. 0.50
c. 0.75
d. 1.00
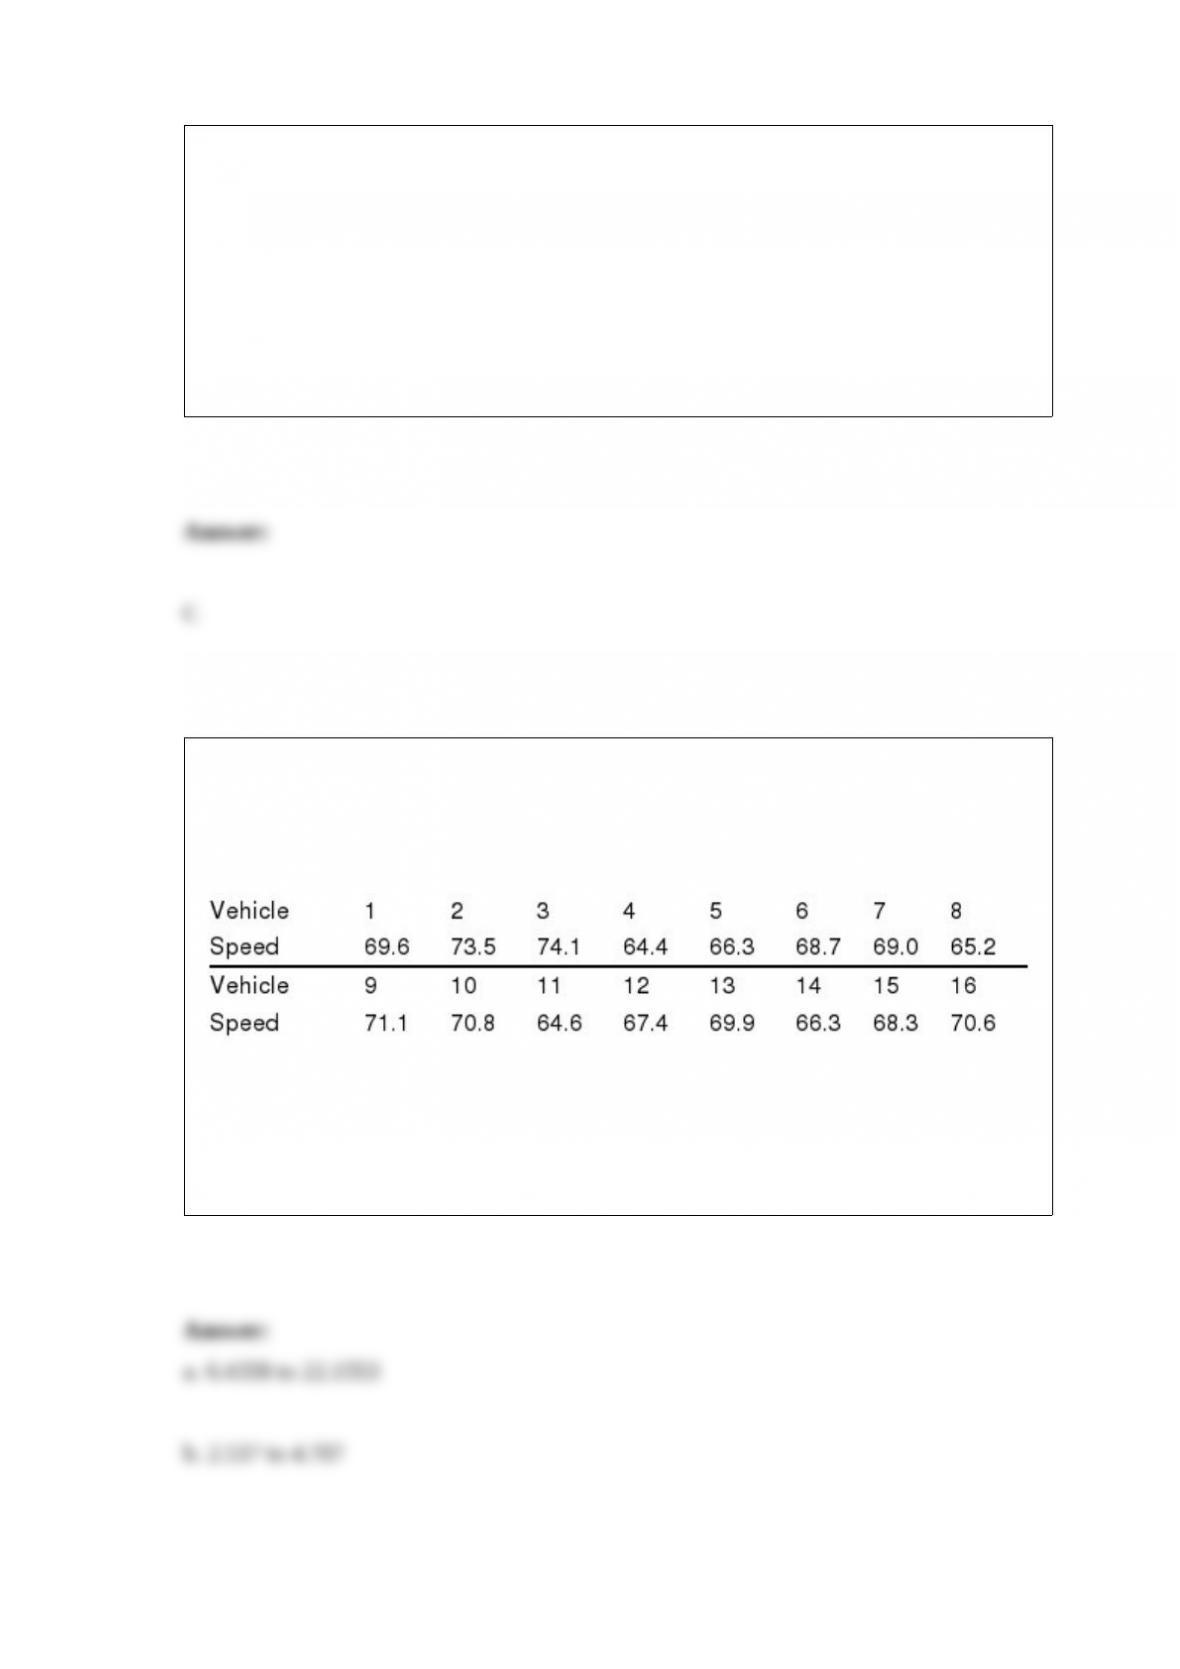
The State Highway Patrol (SHP) periodically samples vehicle speeds at Milepost 92 on
Interstate 17. The SHP is concerned about the dispersion of speeds of vehicles sharing
the same highway because significant difference in speed is a known cause of accidents.
The speeds of a random sample of 16 vehicles are shown below.
a. Develop a 90% confidence interval estimate of the population variance (i.e., the
speed variance of vehicles at Milepost 92 on Interstate 17).
b. Develop a 90% confidence interval estimate of the population standard deviation.

In regression analysis, which of the following is not a required assumption about the
error term
?
a. The expected value of the error term is zero.
b. The variance of the error term is the same for all values of x.
c. The values of the error term are independent.
d. All are required assumptions about the error term.
Exhibit 16-4
In a laboratory experiment, data were gathered on the life span (y in months) of 33 rats,
units of daily protein intake (x1), and whether or not agent x2 (a proposed life extending
agent) was added to the rats diet (x2 = 0 if agent x2 was not added, and x2 = 1 if agent
was added.) From the results of the experiment, the following regression model was
developed.
= 36 + 0.8x1 – 1.7x2
Also provided are SSR = 60 and SST = 180.
Refer to Exhibit 16-4. The life expectancy of a rat that was not given any protein and

that did not take agent x2 is
a. 36.7
b. 34.3
c. 36
d. 38.4
A numerical measure computed from a sample, such as sample mean, is known as a
a. population parameter
b. sample parameter
c. sample statistic
d. population mean
The error that occurs because a sample, and not the entire population, is used to
estimate a population parameter is a
a. nonsampling error
b. sampling error
c. judgment error
d. standard error
For which of the following values of p is the value of p(1 p) maximized?
a. p 0.99
b. p 0.90
c. p 1.0
d. p 0.50
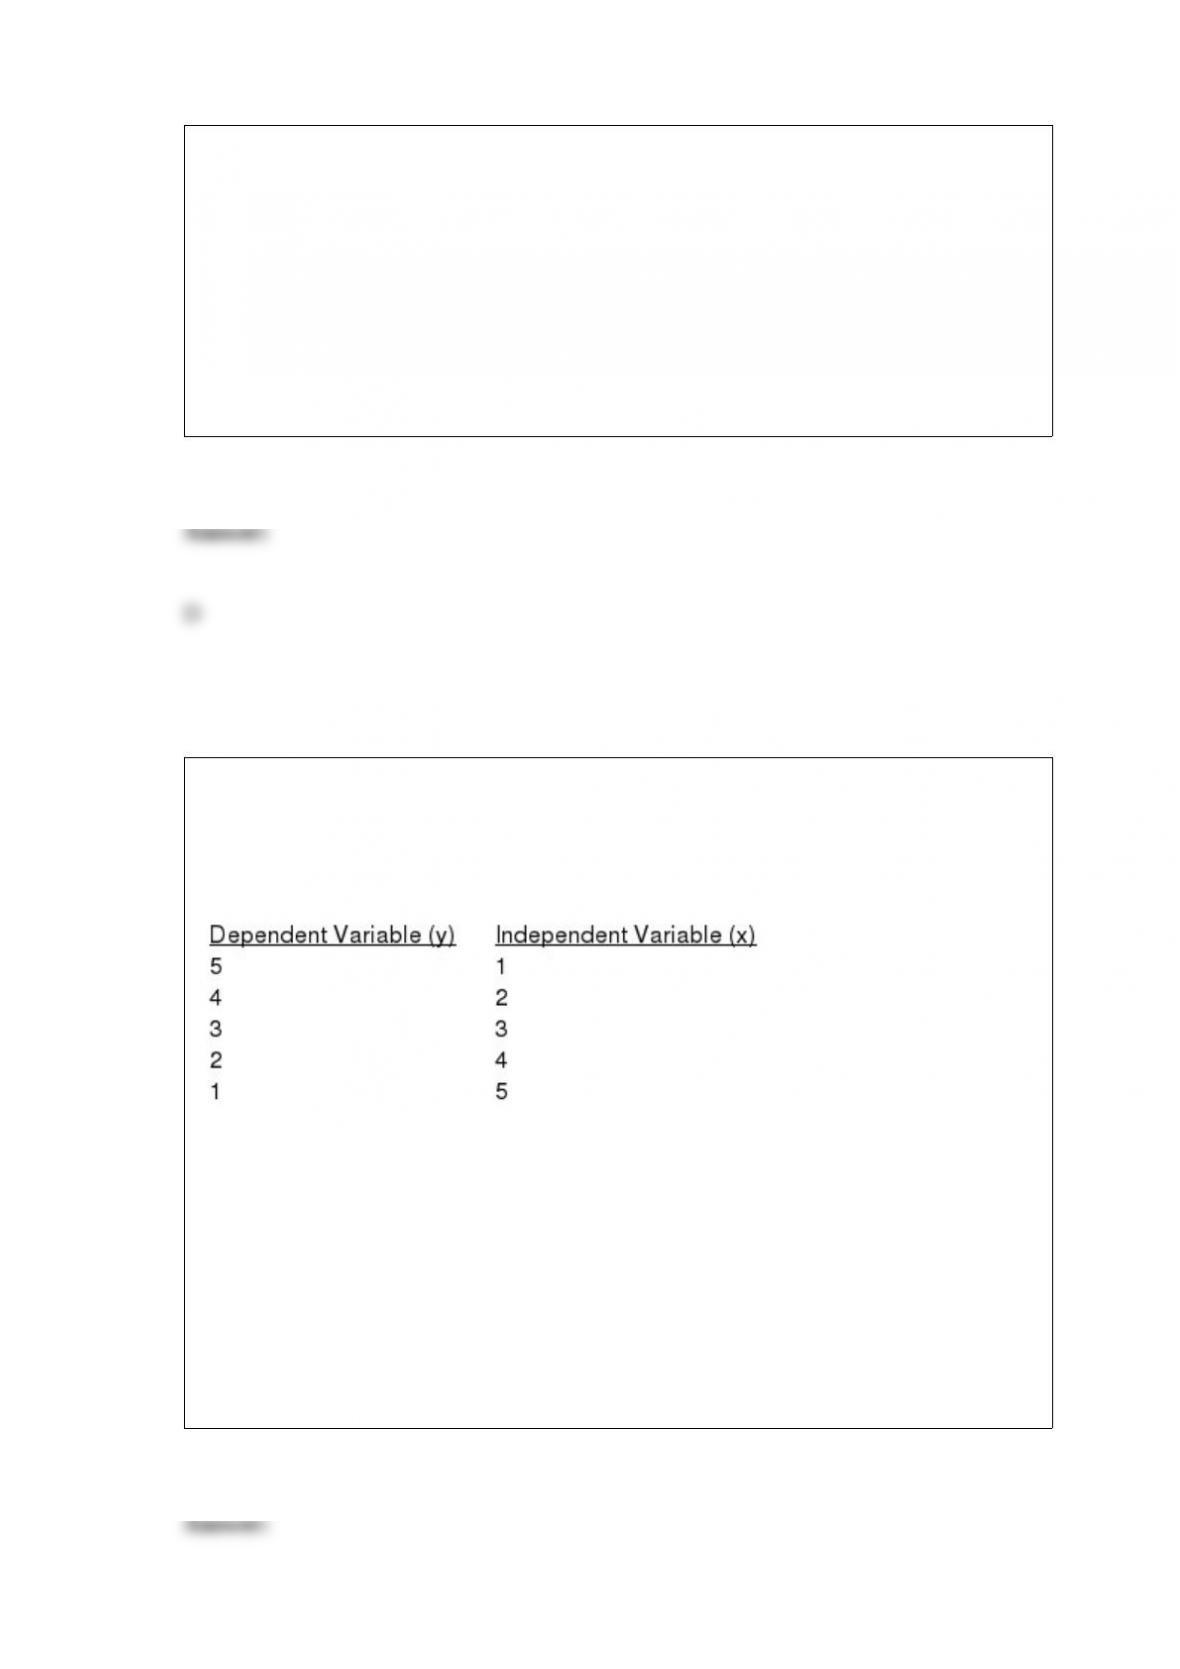
Exhibit 14-5
You are given the following information about y and x.
Refer to Exhibit 14-5. The sample correlation coefficient equals
a. 0
b. +1
c. -1
d. -0.5
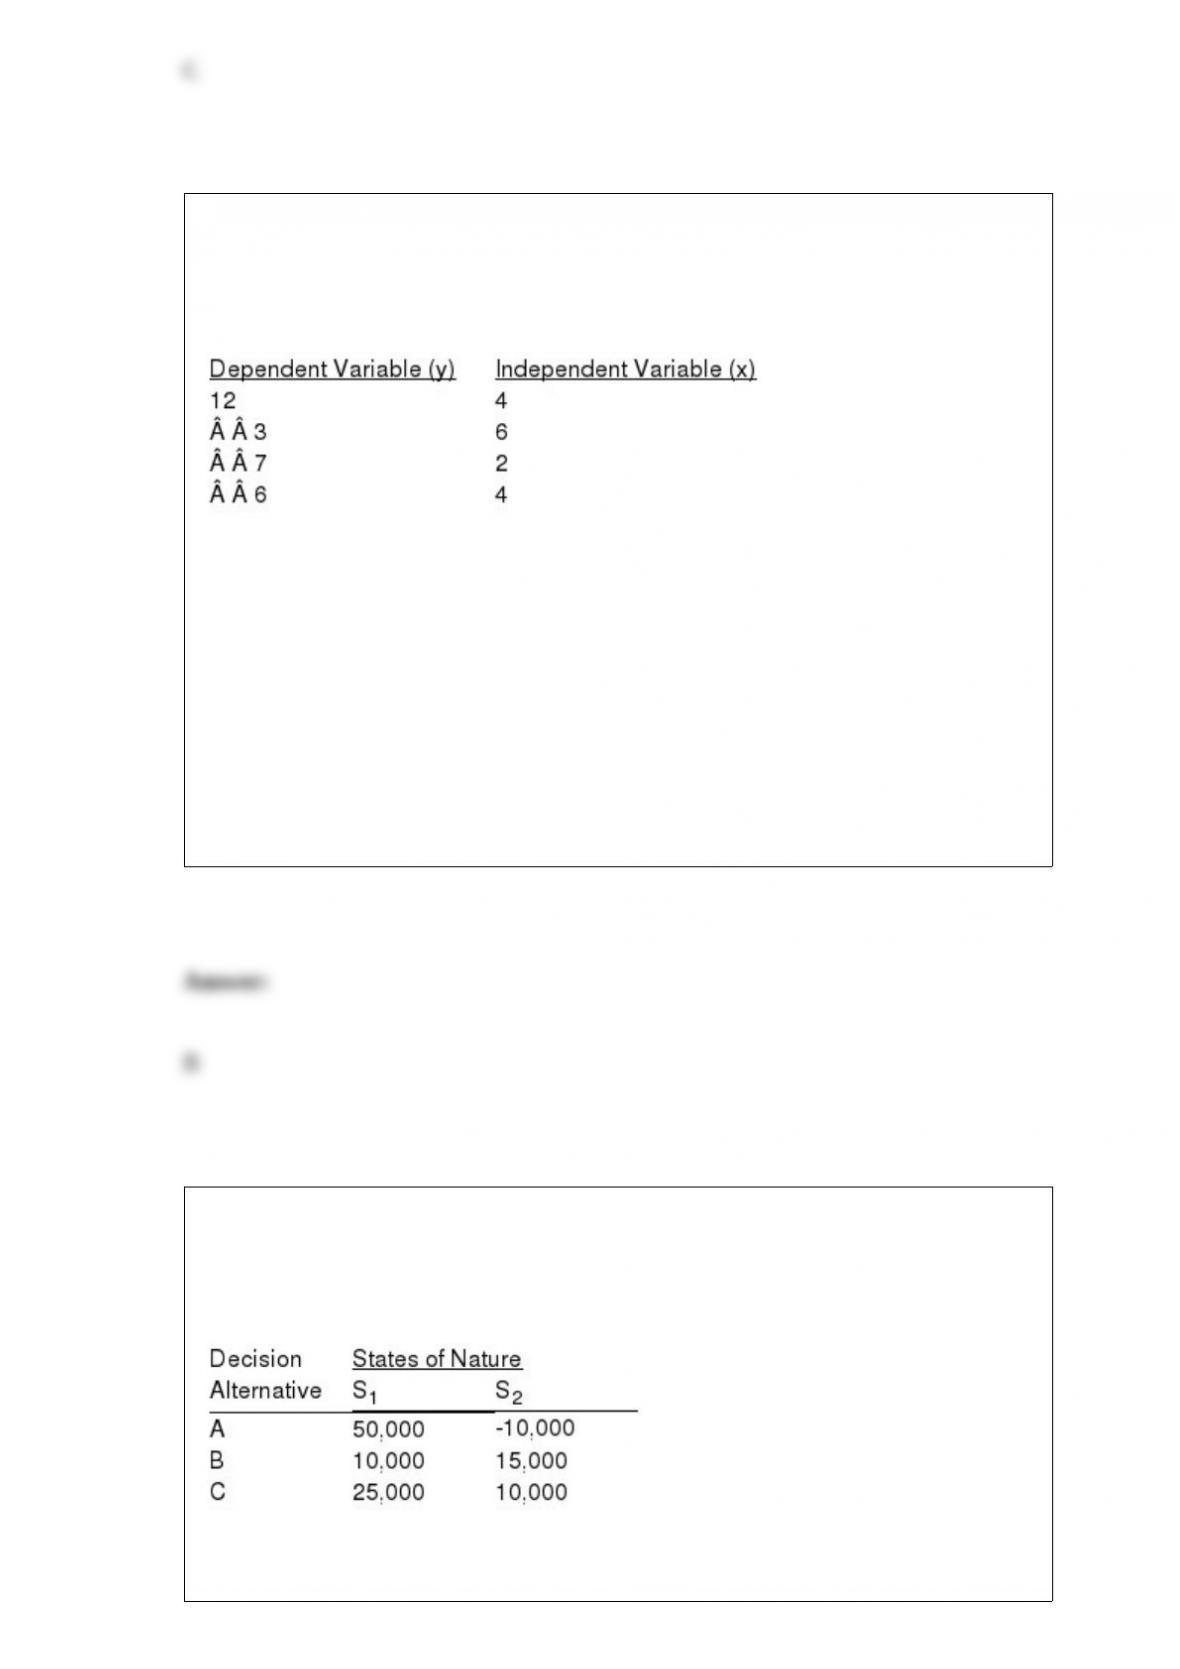
Exhibit 14-6
You are given the following information about y and x.
The primary tool or measure for determining whether the assumed regression model is
appropriate is
a. the F test
b. residual analysis
c. the R2 value
d. the correlation coefficient
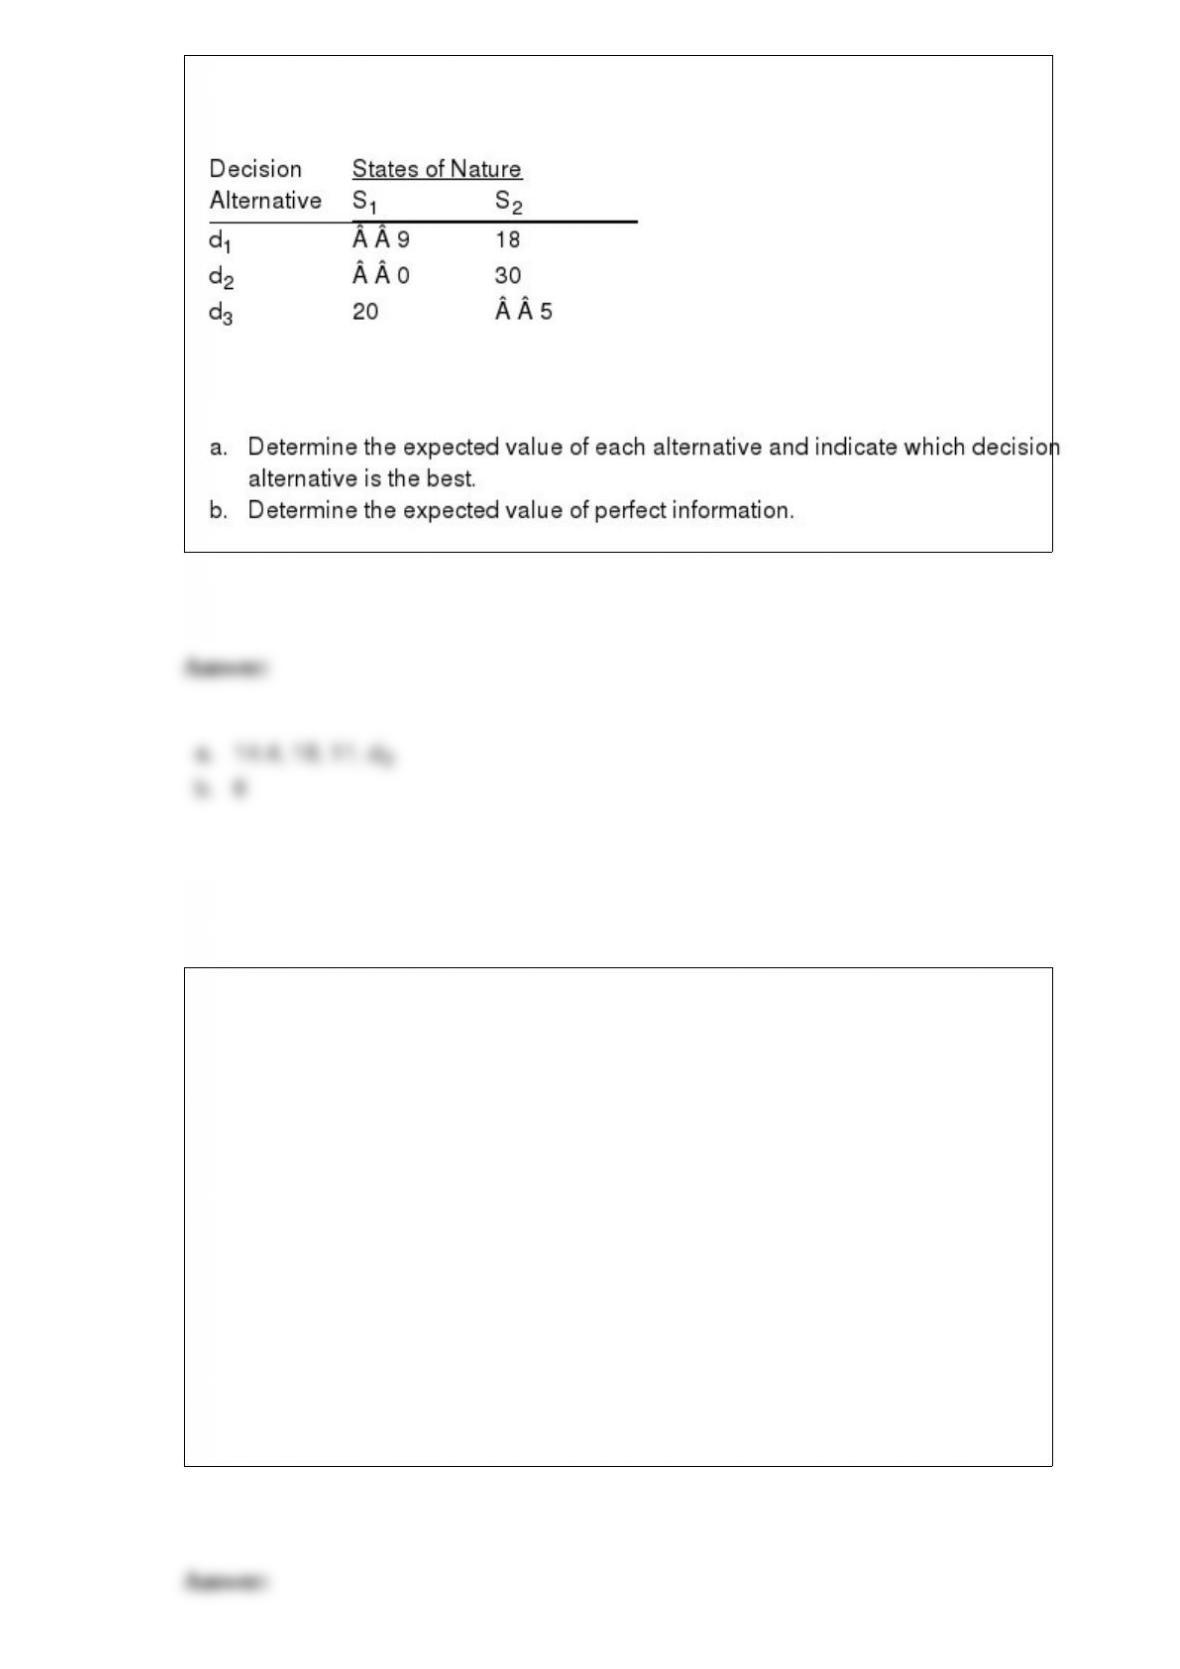
Exhibit 20-3
Below you are given a payoff table involving two states of nature and three decision
alternatives.
The probability of the occurrence of state of nature S1 is 0.4.

Refer to Exhibit 20-3. The expected value of the best alternative equals
a. 13,000
b. 14,000
c. 15,000
d. 16,000
We can use the normal distribution to make confidence interval estimates for the
population proportion, p, when
a. np 5
b. n(1 p) 5
c. p has a normal distribution
d. Both np 5 and n(1 p) 5
Read the z statistic from the normal distribution table and circle the correct answer. A
one-tailed test (lower tail) at a .063 level of significance; z
a. -1.86
b. -1.53

c. -1.96
d. -1.645
In Excel, which of the following functions is used to conduct a hypothesis test (using
the p-value) for a population variance?
a. CHISQ.DIST
b. F-Test
c. CHI.INV
d. None of these answers are correct.
The following regression model has been proposed to predict sales at a fast food outlet.
= 18 – 2x1 + 7x2 + 15x3
where
x1 = the number of competitors within 1 mile
x2 = the population within 1 mile (in 1,000s)
x3 = 1 if drive-up windows are present, 0 otherwise
= sales (in $1,000s)
a. What is the interpretation of 15 (the coefficient of x3) in the regression equation?
b. Predict sales for a store with 2 competitors, a population of 10,000 within one mile,
and one drive-up window (give the answer in dollars).
c. Predict sales for the store with 2 competitors, a population of 10,000 within one mile,
and no drive-up window (give the answer in dollars).
Exhibit 18-1
Ten people were given two types of cereal, Brand X and Brand Y. Three people
preferred Brand X, 5 people preferred Brand Y, and 2 people were undecided. We want
to determine whether or not the two products are equal.
Refer to Exhibit 18-1. To test the null hypothesis, the appropriate probability
distribution to use is
a. normal
b. chi-square
c. Poisson
d. binomial
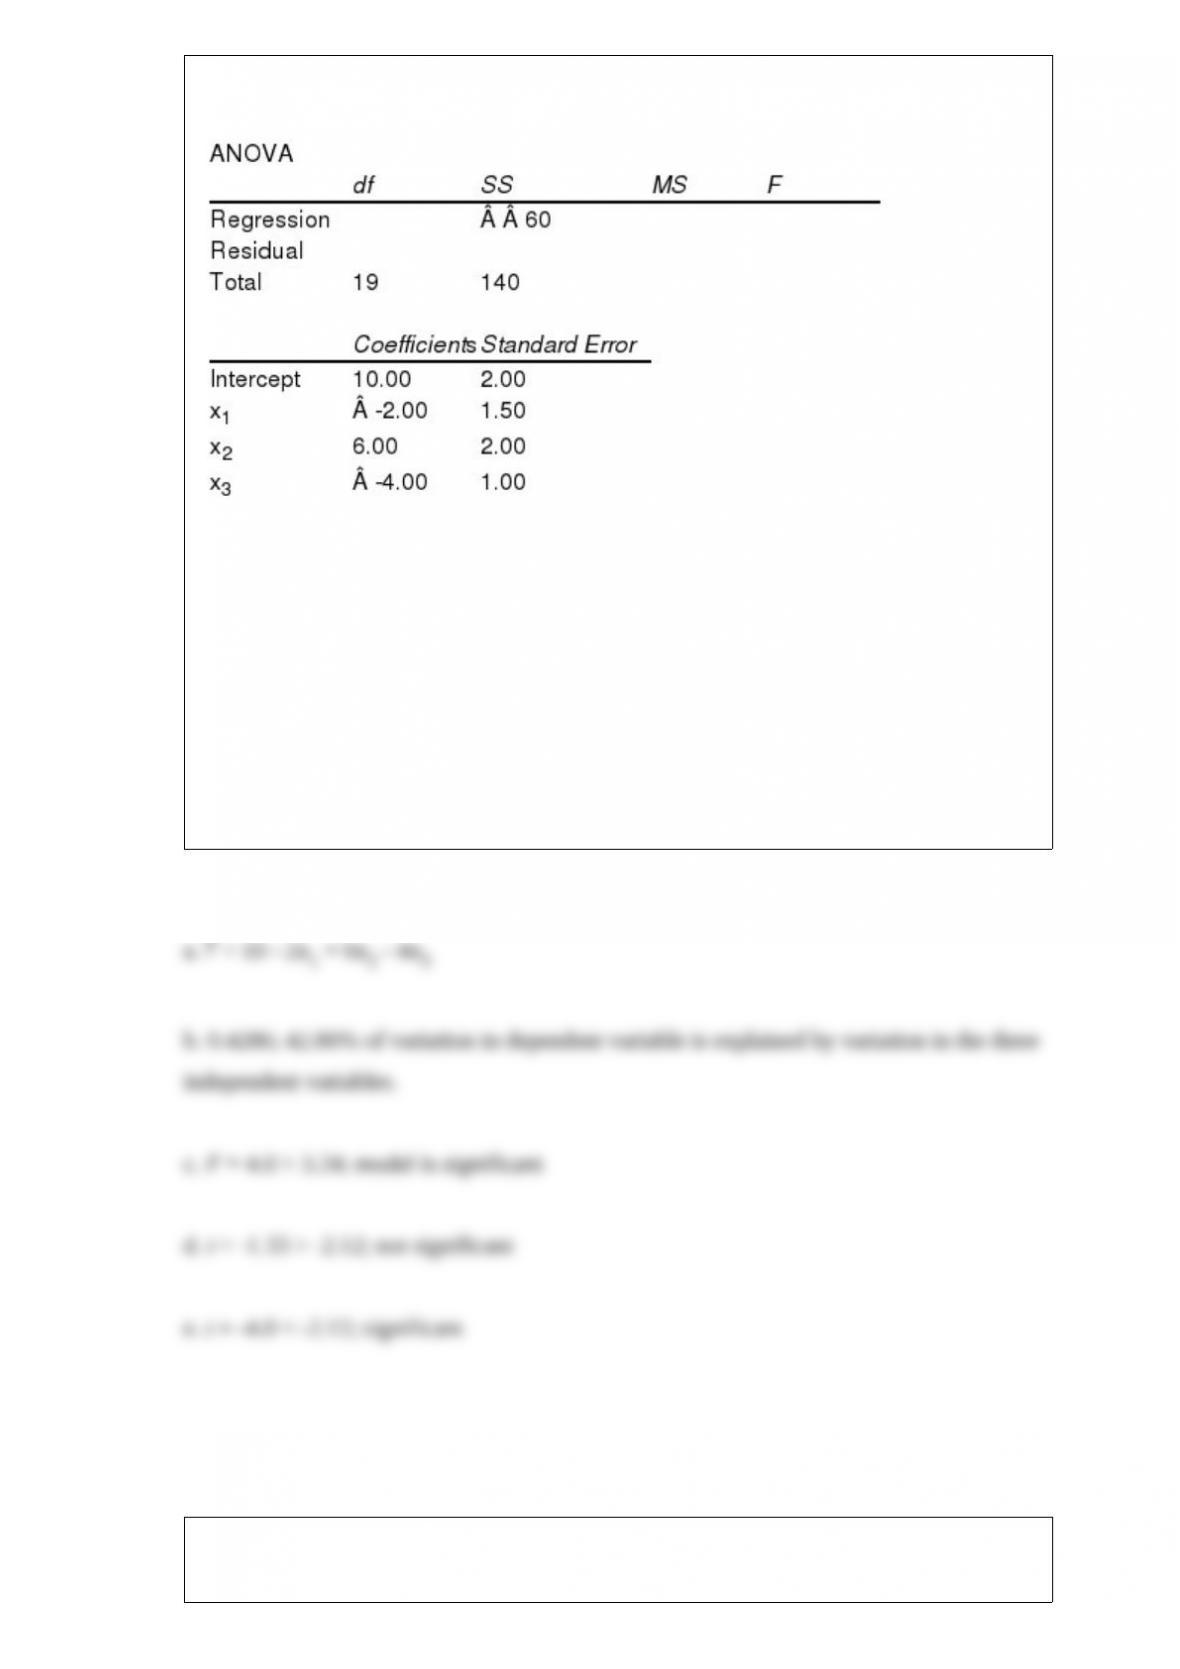
Shown below is a partial Excel output from a regression analysis.
a. Use the above results and write the regression equation.
b. Compute the coefficient of determination and fully interpret its meaning.
c. Is the regression model significant? Perform an F test and let = 0.05.
d. At = 0.05, test to see if there is a relation between x1 and y.
e. At = 0.05, test to see if there is a relation between x3 and y.
The time at which the mailman delivers the mail to Ace Bike Shop follows a normal
distribution with mean 2:00 PM and standard deviation of 15 minutes.
a. What is the probability the mail will arrive after 2:30 PM?
b. What is the probability the mail will arrive before 1:36 PM?
c. What is the probability the mail will arrive between 1:48 PM and 2:09 PM?
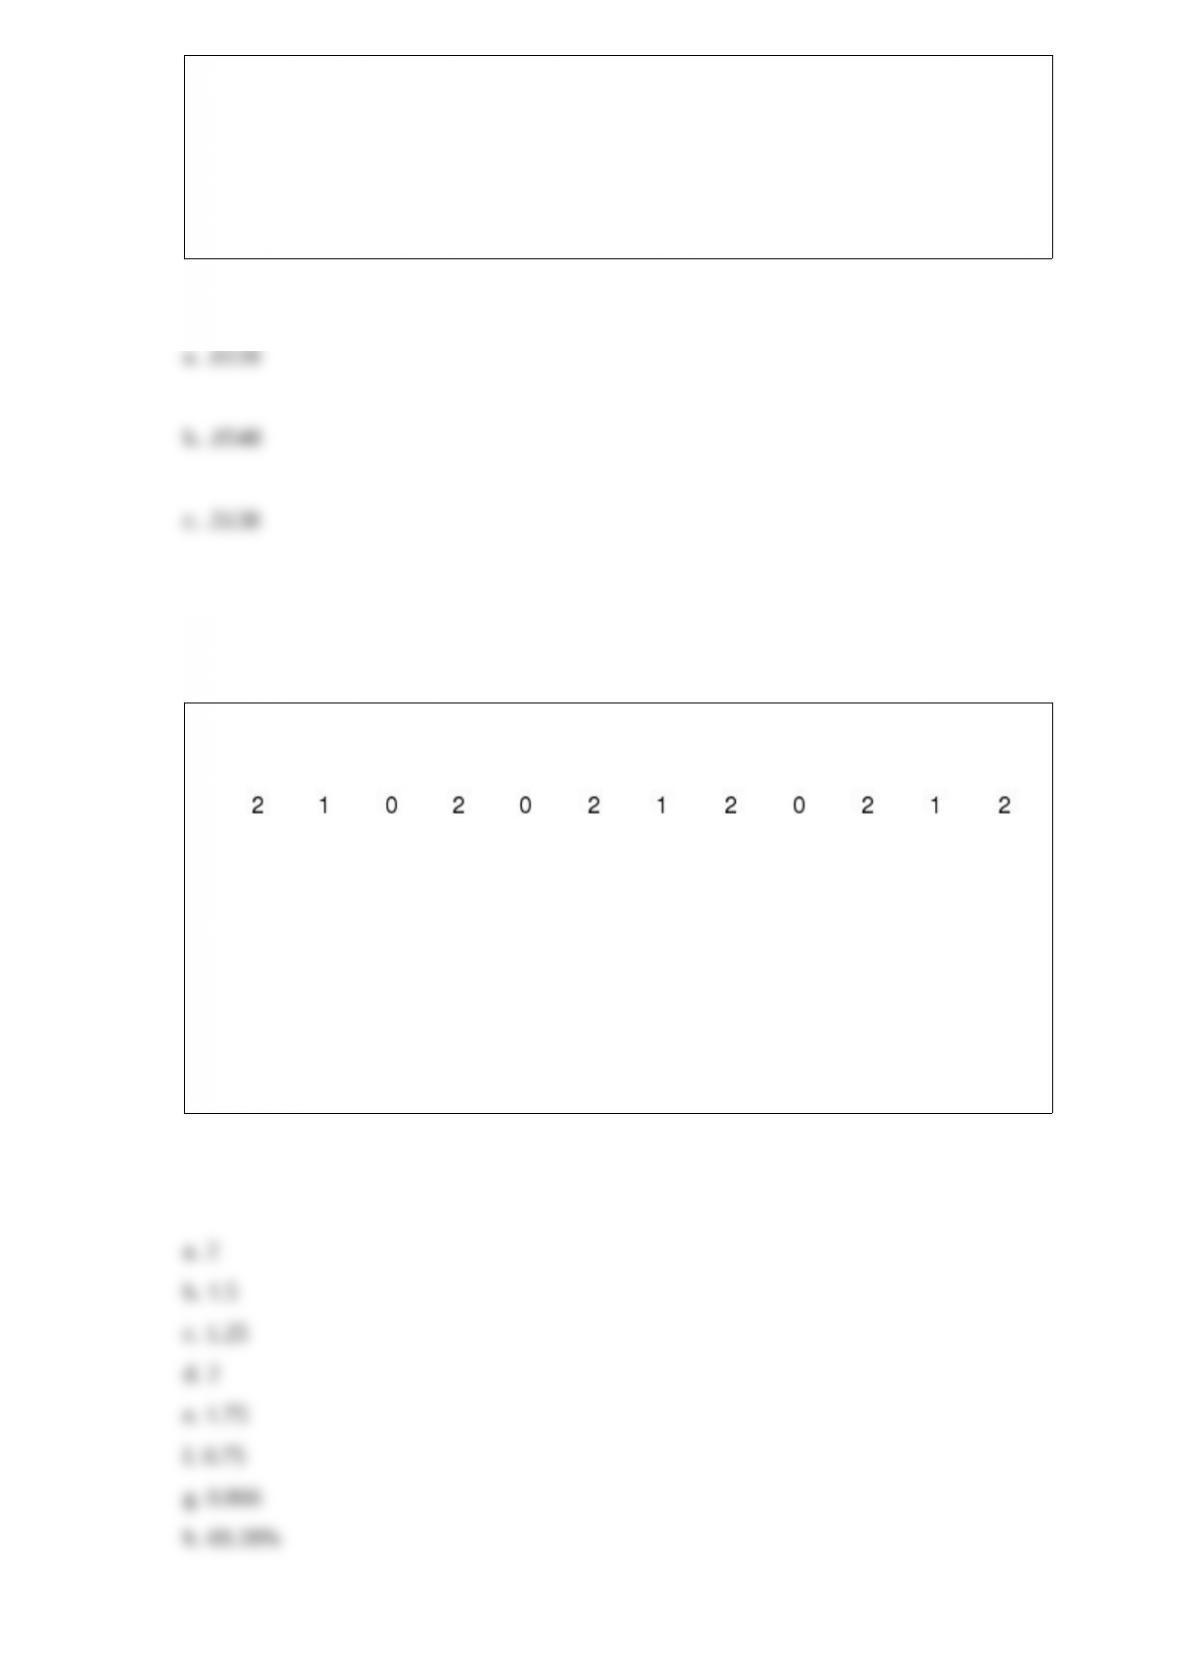
A sample of twelve families was taken. Each family was asked how many times per
week they dine in restaurants. Their responses are given below.
Using this data set, compute the
a. mode
b. median
c. mean
d. range
e. interquartile range
f. variance
g. standard deviation
h. coefficient of variation

Exhibit 5-8
The student body of a large university consists of 60% female students. A random
sample of 8 students is selected.
Refer to Exhibit 5-8. What is the probability that among the students in the sample at
least 7 are female?
a. 0.1064
b. 0.0896
c. 0.0168
d. 0.8936
The standard deviation is the
a. variance squared
b. square root of the sum of the deviations from the mean
c. same as the expected value
d. positive square root of the variance
Assume you are faced with the following decision alternatives and two states of nature.
The payoff table is shown below.
Assume the states of nature have the following probabilities: P(S1) = 0.4, P(S2) = 0.6
Exhibit 18-5
Forty-one individuals from a sample of 60 indicated they oppose legalized abortion. We
are interested in determining whether or not there is a significant difference between the
proportions of opponents and proponents of legalized abortion.
Refer to Exhibit 18-5. The hypothesis is to be tested at the 5% level. The decision rule
is not to reject the null hypothesis if
a. -1.96 < z < 1.96
b. -3 < t < 3
c. F > 5
d. Chi-square > 5
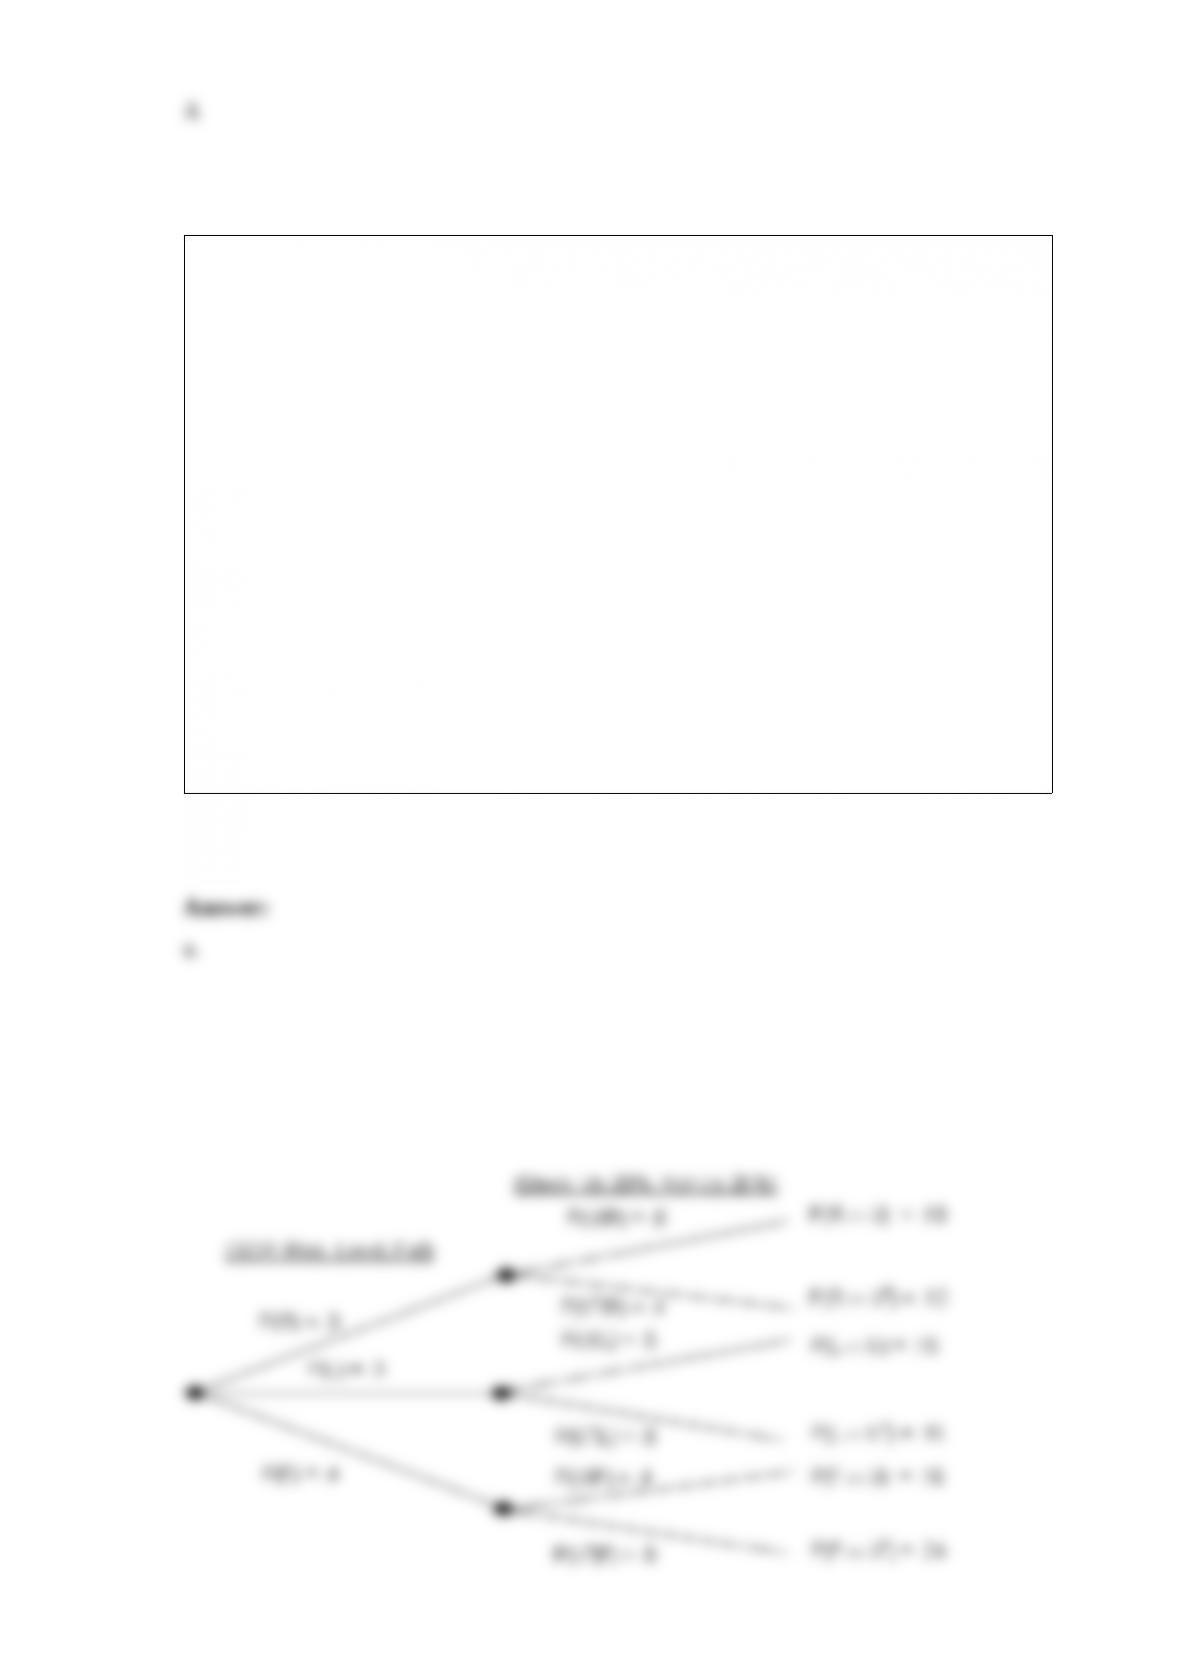
An investment advisor recommends the purchase of shares in Infogenics, Inc. He has
made the following predictions:
P(Stock goes up 20% | Rise in GDP) = .6
P(Stock goes up 20% |
P(Stock goes up 20% | Fall in GDP) = .4
An economist has predicted that the probability of a rise in the GDP is 30%, whereas
the probability of a fall in the GDP is 40%.
a. Draw a tree diagram to represent this multiple-step experiment.
b. What is the probability that the stock will go up 20%?
c. We have been informed that the stock has gone up 20%. What is the probability of a
rise or fall in the GDP?