CHAPTER 13—EXPERIMENTAL DESIGN AND ANALYSIS OF VARIANCE
MULTIPLE CHOICE
1. In an analysis of variance problem if SST = 120 and SSTR = 80, then SSE is
a.
200
b.
40
c.
80
d.
120
2. In the analysis of variance procedure (ANOVA), factor refers to
a.
the dependent variable
b.
the independent variable
c.
different levels of a treatment
d.
the critical value of F
3. In an analysis of variance problem involving 3 treatments and 10 observations per treatment, SSE =
399.6. The MSE for this situation is
a.
133.2
b.
13.32
c.
14.8
d.
30.0
4. When an analysis of variance is performed on samples drawn from k populations, the mean square
between treatments (MSTR) is
a.
SSTR/nT
b.
SSTR/(nT – 1)
c.
SSTR/k
d.
SSTR/(k – 1)
e.
None of these alternatives is correct.
5. In an analysis of variance where the total sample size for the experiment is nT and the number of
populations is k, the mean square within treatments is
a.
SSE/(nT – k)
b.
SSTR/(nT – k)
c.
SSE/(k – 1)
d.
SSE/k
6. The F ratio in a completely randomized ANOVA is the ratio of
a.
MSTR/MSE
b.
MST/MSE
c.
MSE/MSTR
d.
MSE/MST
7. The critical F value with 6 numerator and 60 denominator degrees of freedom at = .05 is
a.
3.74
b.
2.25
c.
2.37
d.
1.96
8. The ANOVA procedure is a statistical approach for determining whether or not
a.
the means of two samples are equal
b.
the means of two or more samples are equal
c.
the means of more than two samples are equal
d.
the means of two or more populations are equal
9. The variable of interest in an ANOVA procedure is called
a.
a partition
b.
a treatment
c.
either a partition or a treatment
d.
a factor
10. An ANOVA procedure is applied to data obtained from 6 samples where each sample contains 20
observations. The degrees of freedom for the critical value of F are
a.
6 numerator and 20 denominator degrees of freedom
b.
5 numerator and 20 denominator degrees of freedom
c.
5 numerator and 114 denominator degrees of freedom
d.
6 numerator and 20 denominator degrees of freedom
11. In the ANOVA, treatment refers to
a.
experimental units
b.
different levels of a factor
c.
a factor
d.
applying antibiotic to a wound
12. The mean square is the sum of squares divided by
a.
the total number of observations
b.
its corresponding degrees of freedom
c.
its corresponding degrees of freedom minus one
d.
None of these alternatives is correct.
13. In factorial designs, the response produced when the treatments of one factor interact with the
treatments of another in influencing the response variable is known as
a.
main effect
b.
replication
c.
interaction
d.
None of these alternatives is correct.
14. An experimental design where the experimental units are randomly assigned to the treatments is
known as
a.
factor block design
b.
random factor design
c.
completely randomized design
d.
None of these alternatives is correct.
15. The number of times each experimental condition is observed in a factorial design is known as
a.
partition
b.
replication
c.
experimental condition
d.
factor
Exhibit 13-1
SSTR = 6,750
H0: 1=2=3=4
SSE = 8,000
Ha: at least one mean is different
nT = 20
16. Refer to Exhibit 13-1. The mean square between treatments (MSTR) equals
a.
400
b.
500
c.
1,687.5
d.
2,250
17. Refer to Exhibit 13-1. The mean square within treatments (MSE) equals
a.
400
b.
500
c.
1,687.5
d.
2,250
18. Refer to Exhibit 13-1. The test statistic to test the null hypothesis equals
a.
0.22
b.
0.84
c.
4.22
d.
4.5
19. Refer to Exhibit 13-1. The null hypothesis is to be tested at the 5% level of significance. The critical
value from the table is
a.
2.87
b.
3.24
c.
4.08

d.
8.7
20. Refer to Exhibit 13-1. The null hypothesis
a.
should be rejected
b.
should not be rejected
c.
was designed incorrectly
d.
None of these alternatives is correct.
Exhibit 13-2
Source of Variation
Sum of
Squares
Degrees of
Freedom
Mean
Square
F
Between Treatments
2,073.6
4
Between Blocks
6,000.0
5
1,200
Error
20
288
Total
29
21. Refer to Exhibit 13-2. The null hypothesis for this ANOVA problem is
a.
1=2=3=4
b.
1=2=3=4=5
c.
1=2=3=4=5=6
d.
1=2= … =20
22. Refer to Exhibit 13-2. The mean square between treatments equals
a.
288
b.
518.4
c.
1,200
d.
8,294.4
23. Refer to Exhibit 13-2. The sum of squares due to error equals
a.
14.4
b.
2,073.6
c.
5,760
d.
6,000
24. Refer to Exhibit 13-2. The test statistic to test the null hypothesis equals
a.
0.432
b.
1.8
c.
4.17
d.
28.8
25. Refer to Exhibit 13-2. The null hypothesis is to be tested at the 5% level of significance. The critical
value from the table is
a.
2.71
b.
2.87
c.
5.19
d.
5.8
26. Refer to Exhibit 13-2. The null hypothesis
a.
should be rejected
b.
should not be rejected
c.
should be revised
d.
None of these alternatives is correct.
Exhibit 13-3
To test whether or not there is a difference between treatments A, B, and C, a sample of 12
observations has been randomly assigned to the 3 treatments. You are given the results below.
Treatment
Observation
A
20
30
25
33
B
22
26
20
28
C
40
30
28
22
27. Refer to Exhibit 13-3. The null hypothesis for this ANOVA problem is
a.
1=2
b.
1=2=3
c.
1=2=3=4
d.
1=2= … =12
28. Refer to Exhibit 13-3. The mean square between treatments (MSTR) equals
a.
1.872
b.
5.86
c.
34
d.
36
29. Refer to Exhibit 13-3. The mean square within treatments (MSE) equals
a.
1.872
b.
5.86
c.
34
d.
36
30. Refer to Exhibit 13-3. The test statistic to test the null hypothesis equals
a.
0.944
b.
1.059
c.
3.13
d.
19.231
31. Refer to Exhibit 13-3. The null hypothesis is to be tested at the 1% level of significance. The critical
value from the table is
a.
4.26
b.
8.02
c.
16.69
d.
99.39
32. Refer to Exhibit 13-3. The null hypothesis
a.
should be rejected
b.
should not be rejected
c.
should be revised
d.
None of these alternatives is correct.
33. The required condition for using an ANOVA procedure on data from several populations is that the
a.
the selected samples are dependent on each other
b.
sampled populations are all uniform
c.
sampled populations have equal variances
d.
sampled populations have equal means
34. An ANOVA procedure is used for data that was obtained from four sample groups each comprised of
five observations. The degrees of freedom for the critical value of F are
a.
3 and 20
b.
3 and 16
c.
4 and 17
d.
3 and 19
35. In ANOVA, which of the following is not affected by whether or not the population means are equal?
a.
b.
between-samples estimate of 2
c.
within-samples estimate of 2
d.
None of these alternatives is correct.
36. A term that means the same as the term “variable” in an ANOVA procedure is
a.
factor
b.
treatment
c.
replication
d.
variance within
37. In order to determine whether or not the means of two populations are equal,
a.
a t test must be performed
b.
an analysis of variance must be performed
c.
either a t test or an analysis of variance can be performed
d.
a chi-square test must be performed
38. The process of allocating the total sum of squares and degrees of freedom is called
a.
factoring
b.
blocking
c.
replicating
d.
partitioning
39. An experimental design that permits statistical conclusions about two or more factors is a
a.
randomized block design
b.
factorial design
c.
completely randomized design
d.
randomized design
40. In a completely randomized design involving three treatments, the following information is provided:
Treatment 1
Treatment 2
Treatment 3
Sample Size
5
10
5
Sample Mean
4
8
9
The overall mean for all the treatments is
a.
7.00
b.
6.67
c.
7.25
d.
4.89
Exhibit 13-4
In a completely randomized experimental design involving five treatments, thirteen observations were
recorded for each of the five treatments. The following information is provided.
SSTR = 200 (Sum Square Between Treatments)
SST = 800 (Total Sum Square)
41. Refer to Exhibit 13-4. The sum of squares within treatments (SSE) is
a.
1,000
b.
600
c.
200
d.
1,600
42. Refer to Exhibit 13-4. The number of degrees of freedom corresponding to between treatments is
a.
60
b.
59
c.
5
d.
4
43. Refer to Exhibit 13-4. The number of degrees of freedom corresponding to within treatments is
a.
60
b.
59
c.
5
d.
4
44. Refer to Exhibit 13-4. The mean square between treatments (MSTR) is
a.
3.34
b.
10.00
c.
50.00
d.
12.00
45. Refer to Exhibit 13-4. The mean square within treatments (MSE) is
a.
50
b.
10
c.
200
d.
600
46. Refer to Exhibit 13-4. If at a 5% level of significance we want to determine whether or not the means
of the five populations are equal, the critical value of F is
a.
2.53
b.
19.48
c.
4.98
d.
39.48
47. Refer to Exhibit 13-4. The conclusion of the test is that the five means
a.
are equal
b.
may be equal
c.
are not equal
d.
None of these alternatives is correct.
Exhibit 13-5
Part of an ANOVA table is shown below.
Source of Variation
Sum of
Squares
Degrees of
Freedom
Mean
Square
F
Between Treatments
180
3
Within Treatments (Error)
Total
480
18
48. Refer to Exhibit 13-5. The mean square between treatments (MSTR) is
a.
20
b.
60
c.
300
d.
15
49. Refer to Exhibit 13-5. The mean square within treatments (MSE) is
a.
60
b.
15
c.
300
d.
20
50. Refer to Exhibit 13-5. If at a 5% level of significance, we want to determine whether or not the means
of the populations are equal, the critical value of F is
a.
2.53
b.
19.48
c.
3.29
d.
5.86
51. Refer to Exhibit 13-5. The conclusion of the test is that the means
a.
are equal to fifty
b.
may be equal
c.
are not equal
d.
None of these alternatives is correct.
Exhibit 13-6
Part of an ANOVA table is shown below.
Source of Variation
Sum of
Squares
Degrees of
Freedom
Mean
Square
F
Between Treatments
64
8
Within Treatments (Error)
2
Total
100
52. Refer to Exhibit 13-6. The number of degrees of freedom corresponding to between treatments is
a.
18
b.
2
c.
4
d.
3
53. Refer to Exhibit 13-6. The number of degrees of freedom corresponding to within treatments is
a.
22
b.
4
c.
5
d.
18
54. Refer to Exhibit 13-6. The mean square between treatments (MSTR) is
a.
36
b.
16
c.
64
d.
15
55. Refer to Exhibit 13-6. If at a 5% significance level we want to determine whether or not the means of
the populations are equal, the critical value of F is
a.
5.80
b.
2.93
c.
3.16
d.
2.90
56. Refer to Exhibit 13-6. The conclusion of the test is that the means
a.
are equal
b.
may be equal
c.
are not equal
d.
None of these alternatives is correct.
Exhibit 13-7
The following is part of an ANOVA table, which was the results of three treatments and a total of 15
observations.
Source of Variation
Sum of
Squares
Degrees of
Freedom
Mean
Square
F
Between Treatments
64
Within Treatments (Error)
96
Total
57. Refer to Exhibit 13-7. The number of degrees of freedom corresponding to between treatments is
a.
12
b.
2
c.
3
d.
4
58. Refer to Exhibit 13-7. The number of degrees of freedom corresponding to within treatments is
a.
12
b.
2
c.
3
d.
15
59. Refer to Exhibit 13-7. The mean square between treatments (MSTR) is
a.
36
b.
16
c.
8
d.
32
60. Refer to Exhibit 13-7. If at a 5% level of significance, we want to determine whether or not the means
of the populations are equal, the critical value of F is
a.
4.75
b.
19.41
c.
3.16
d.
1.96
61. Refer to Exhibit 13-7. The computed test statistics is
a.
32
b.
8
c.
0.667
d.
4
62. Refer to Exhibit 13-7. The conclusion of the test is that the means
a.
are equal
b.
may be equal
c.
are not equal
d.
None of these alternatives is correct.
63. In a completely randomized design involving four treatments, the following information is provided.
Treatment 1
Treatment 2
Treatment 3
Treatment 4
Sample Size
50
18
15
17
Sample Mean
32
38
42
48
The overall mean (the grand mean) for all treatments is
a.
40.0
b.
37.3
c.
48.0
d.
37.0
e.
None of these alternatives is correct.
64. An ANOVA procedure is used for data obtained from five populations. five samples, each comprised
of 20 observations, were taken from the five populations. The numerator and denominator
(respectively) degrees of freedom for the critical value of F are
a.
5 and 20
b.
4 and 20
c.
4 and 99
d.
4 and 95
65. The critical F value with 8 numerator and 29 denominator degrees of freedom at = 0.01 is
a.
2.28
b.
3.20
c.
3.33
d.
3.64
66. An ANOVA procedure is used for data obtained from four populations. Four samples, each comprised
of 30 observations, were taken from the four populations. The numerator and denominator
(respectively) degrees of freedom for the critical value of F are
a.
3 and 30
b.
4 and 30
c.
3 and 119
d.
3 and 116
67. Which of the following is not a required assumption for the analysis of variance?
a.
The random variable of interest for each population has a normal probability distribution.
b.
The variance associated with the random variable must be the same for each population.
c.
At least 2 populations are under consideration.
d.
Populations have equal means.
68. In an analysis of variance, one estimate of 2 is based upon the differences between the treatment
means and the
a.
means of each sample
b.
overall sample mean
c.
sum of observations
d.
populations have equal means
69. In testing for the equality of k population means, the number of treatments is
a. k
b. k – 1
c. nT
d. nT – k
70. If we are testing for the equality of 3 population means, we should use the
a. test statistic F
b. test statistic t
c. test statistic z
d. test statistic
2
PROBLEM
1. Information regarding the ACT scores of samples of students in three different majors are given
below.
Student’s Major
Management
Finance
Accounting
28
22
29
26
23
27
25
24
26
27
22
28
21
24
25
19
26
26
27
27
28
17
29
20
17
28
20
23
24
28
28
29
Sums
230
225
338
Means
23
25
26
Variances
18
6.75
9.33
a.
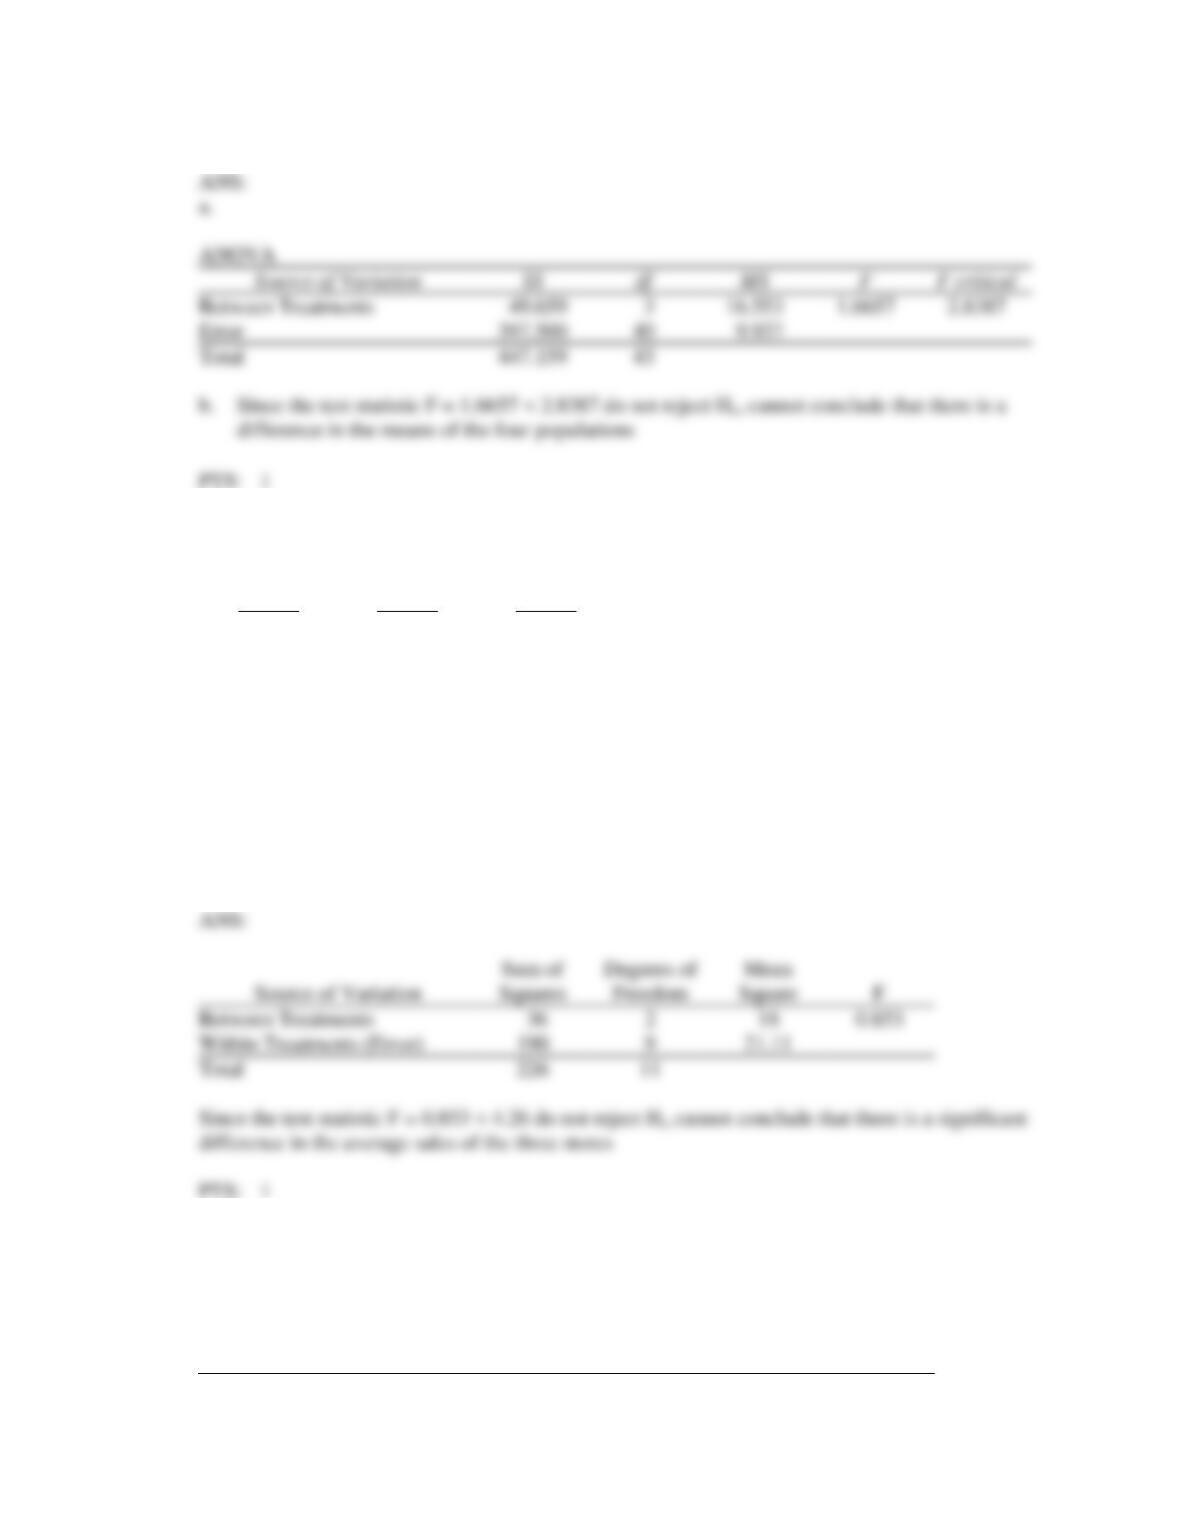
Set up the ANOVA table for this problem.
b.
At a 5% level of significance, test to determine whether there is a significant difference in the
means of the three populations.
2. Information regarding the ACT scores of samples of students in four different majors are given below.
Student’s Major
Management
Marketing
Finance
Accounting
29
22
29
28
27
22
27
26
21
25
27
25
28
26
28
20
22
27
24
21
28
20
20
19
28
23
20
27
23
25
30
24
28
27
29
21
24
28
23
29
27
31
27
24
Sum
318
245
234
312
Mean
26.50
24.50
26.00
24.00
Variance
10.09
6.94
14.50
9.00
Between Treatments
Error
29
Total
significant difference in the means of the three populations
a.
Set up the ANOVA table for this problem.
b.
At a 5% level of significance, test to determine whether there is a significant difference in the
means of the four populations.
3. Guitars R. US has three stores located in three different areas. Random samples of the sales of the
three stores (in $1000) are shown below:
Store 1
Store 2
Store 3
80
85
79
80
86
85
76
81
88
89
80
At a 5% level of significance, test to see if there is a significant difference in the average sales of the
three stores. (Please note that the sample sizes are not equal.)
Between Treatments
190
Total
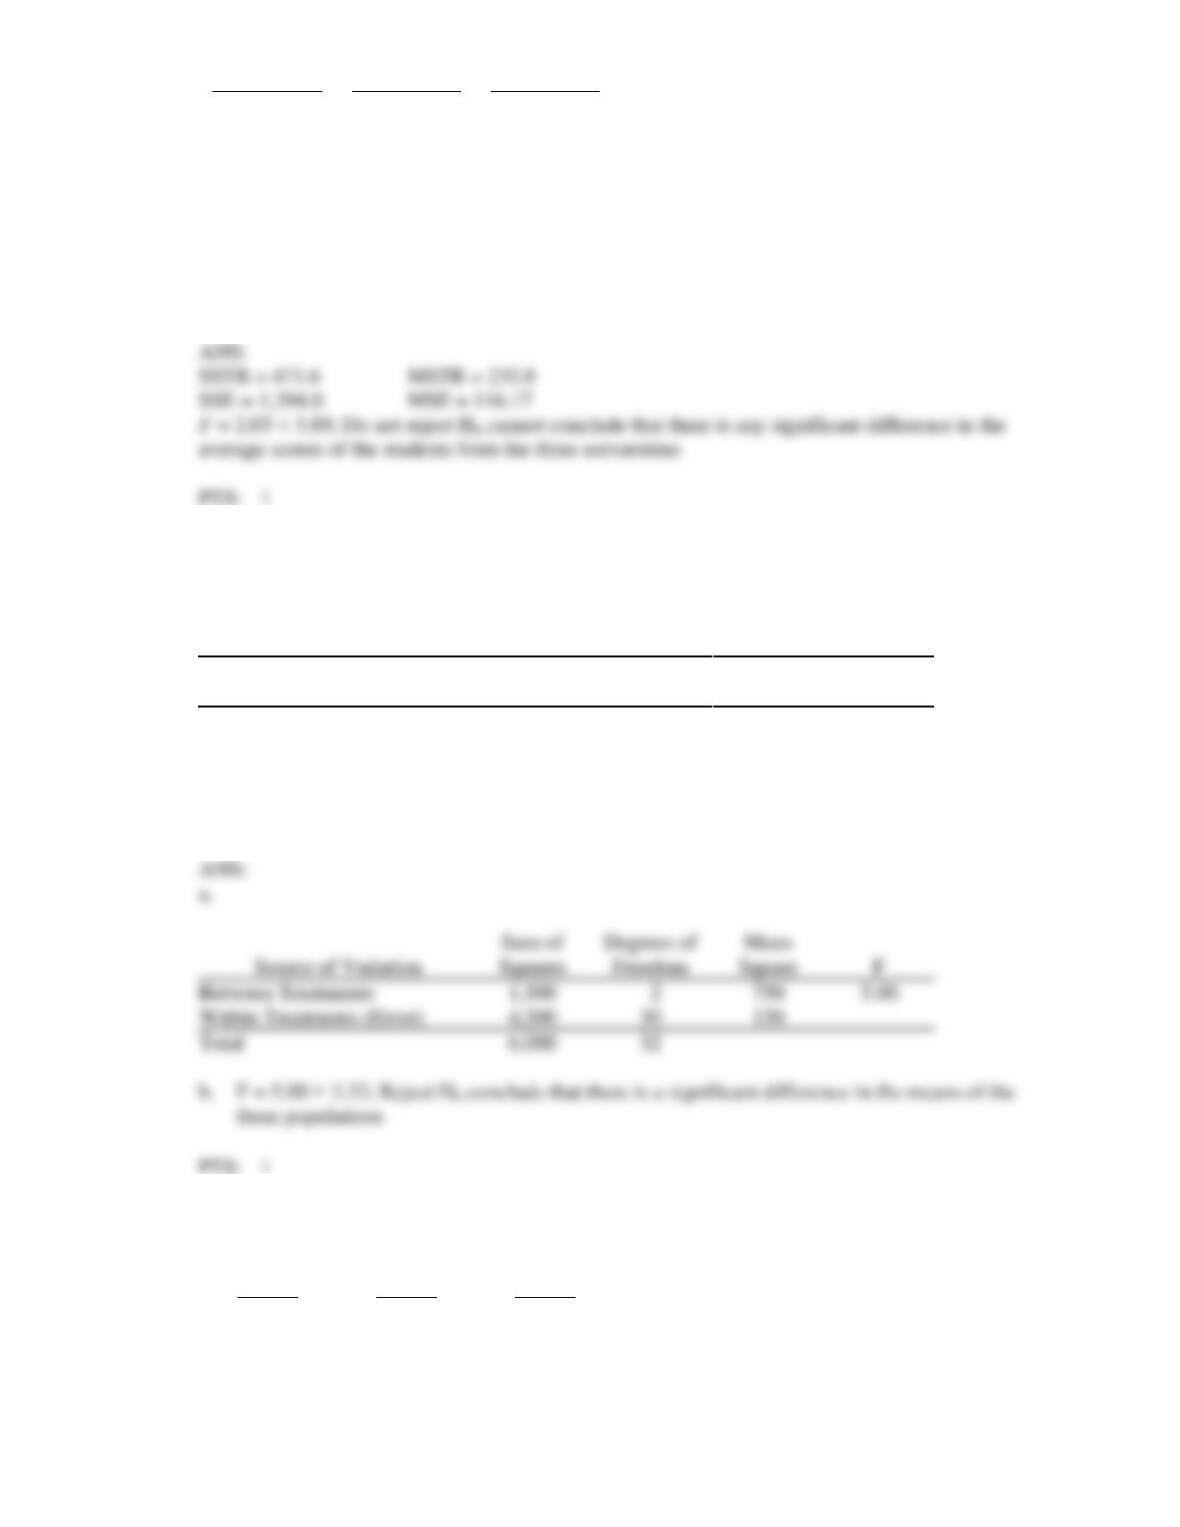
4. In a completely randomized experimental design, 18 experimental units were used for the first
treatment, 10 experimental units for the second treatment, and 15 experimental units for the third
treatment. Part of the ANOVA table for this experiment is shown below.
Source of Variation
Sum of
Squares
Degrees of
Freedom
Mean
Square
F
Error
b.
Since the test statistic F = 1.6657 < 2.8387 do not reject Ho, cannot conclude that there is a
Between Treatments
_____?
_____?
_____?
3.0
Within Treatments (Error)
_____?
_____?
6
Total
_____?
_____?
a.
Fill in all the blanks in the above ANOVA table.
b.
At a 5% level of significance, test to see if there is a significant difference among the means.
5. Random samples were selected from three populations. The data obtained are shown below.
Treatment 1
Treatment 2
Treatment 3
37
43
28
33
39
32
36
35
33
38
38
40
At a 5% level of significance, test to see if there is a significant difference in the means of the three
populations. (Please note that the sample sizes are not equal.)
6. In a completely randomized experimental design, 7 experimental units were used for the first
treatment, 9 experimental units for the second treatment, and 14 experimental units for the third
treatment. Part of the ANOVA table for this experiment is shown below.
Source of Variation
Sum of
Squares
Degrees of
Freedom
Mean
Square
F
Between Treatments
_____?
_____?
_____?
4.5
Within Treatments (Error)
_____?
_____?
4
Total
_____?
_____?
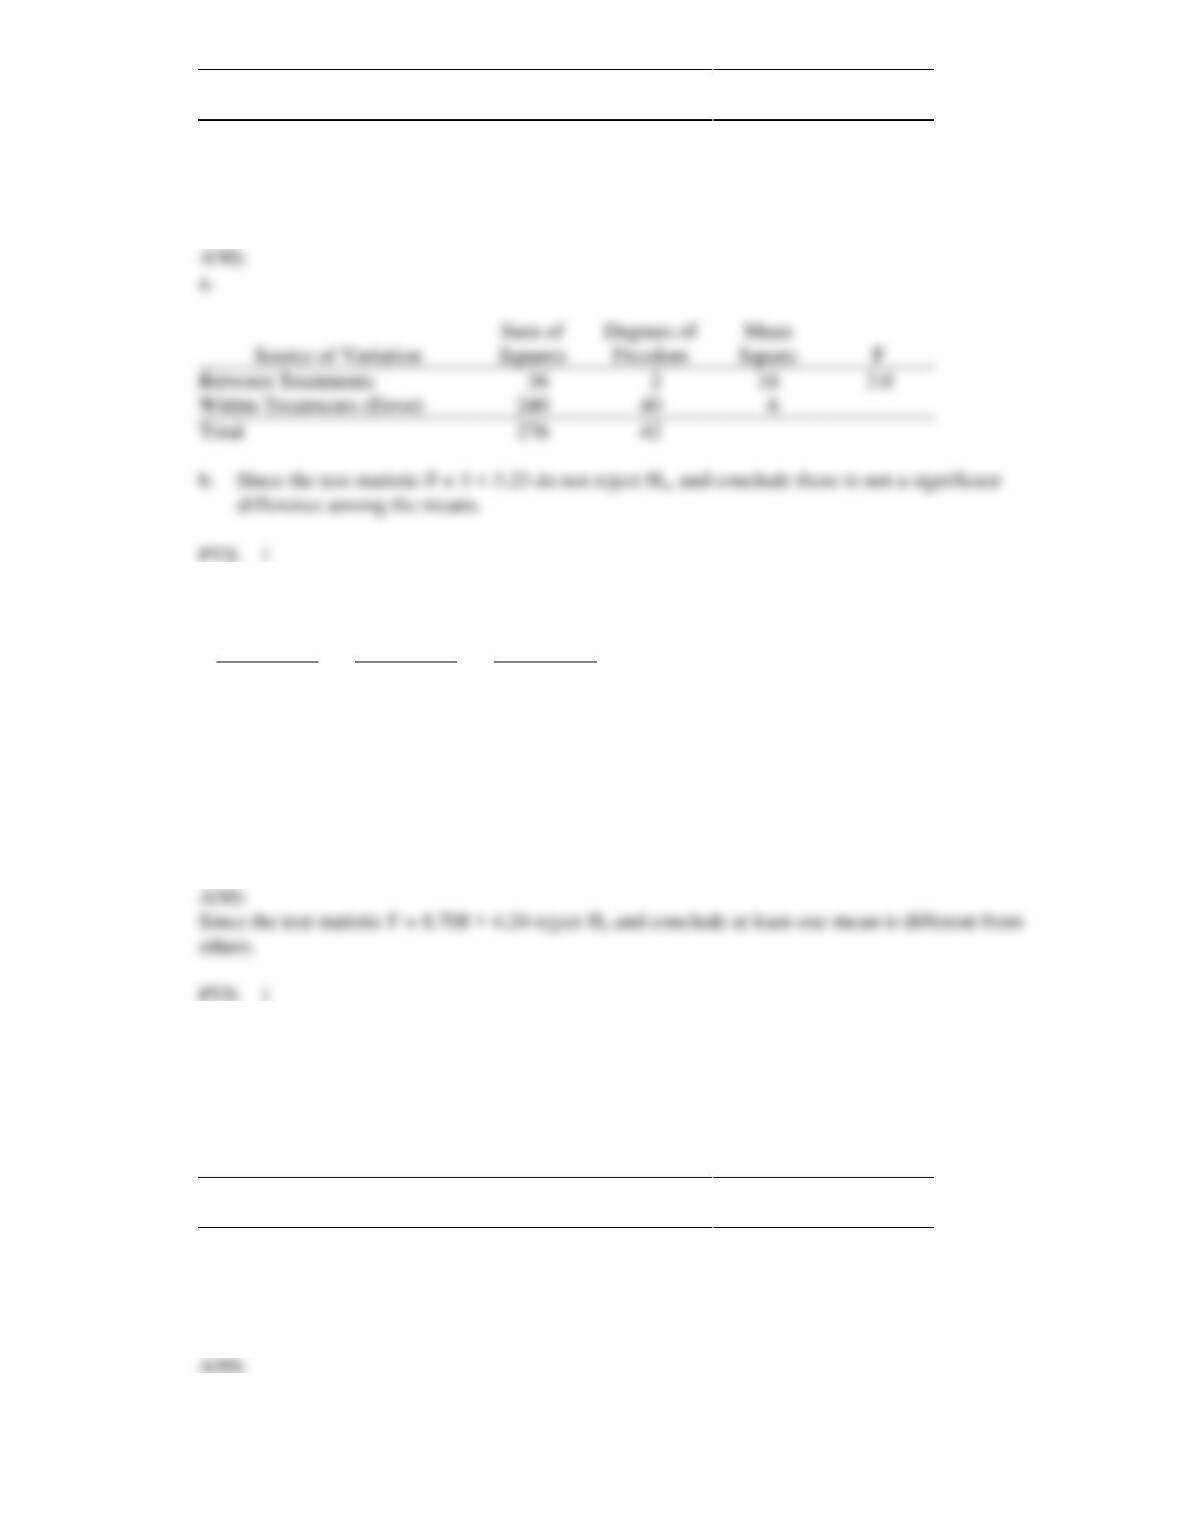
a.
Fill in all the blanks in the above ANOVA table.
b.
At a 5% level of significance, test to see if there is a significant difference among the means.
Source of Variation
Freedom
F
Between Treatments
Within Treatments (Error)
Total
difference among the means.
7. Random samples were selected from three populations. The data obtained are shown below.
Treatment 1
Treatment 2
Treatment 3
45
30
39
41
34
35
37
35
38
40
40
42
At a 5% level of significance, test to see if there is a significant difference in the means of the three
populations. (Please note that the sample sizes are not equal.)
8. The manager of Young Corporation wants to determine whether or not the type of work schedule for
her employees has any effect on their productivity. She has selected 15 production employees at
random and then randomly assigned 5 employees to each of the 3 proposed work schedules. The
following table shows the units of production (per week) under each of the work schedules.
Work Schedule (Treatments)
Work Schedule 1
Work Schedule 2
Work Schedule 3
50
60
70
60
65
75
70
66
55
40
54
40
45
57
55
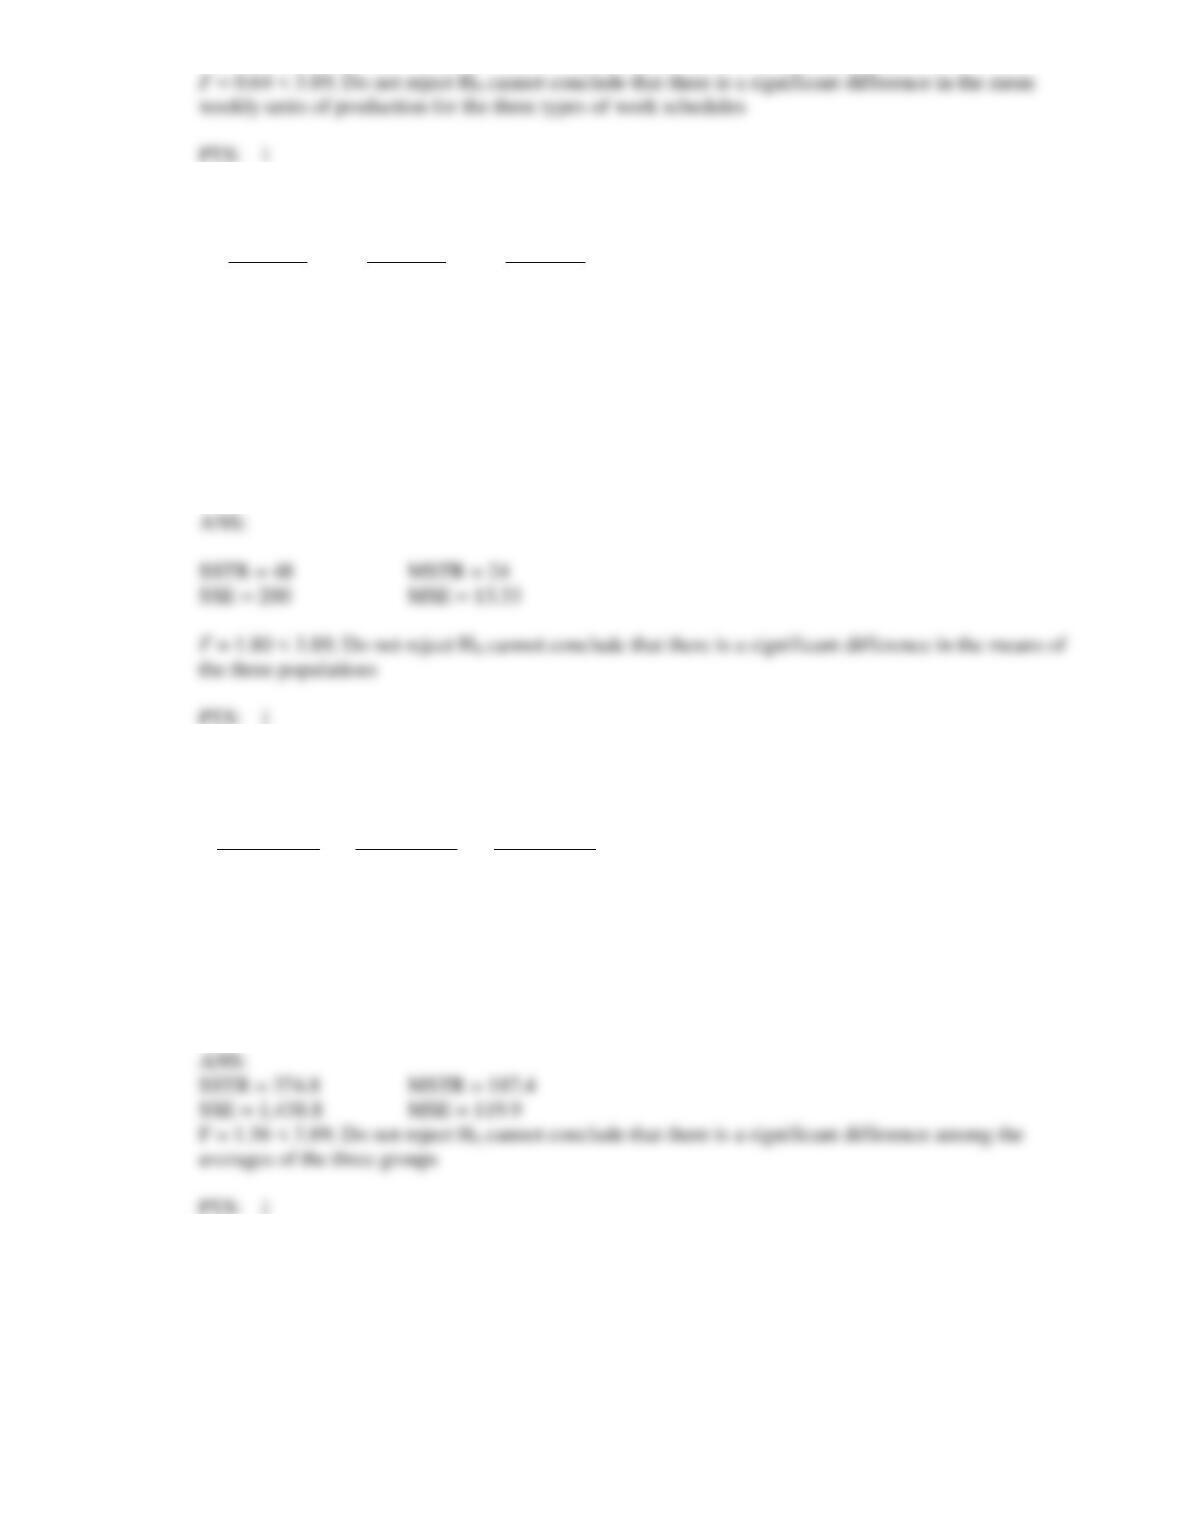
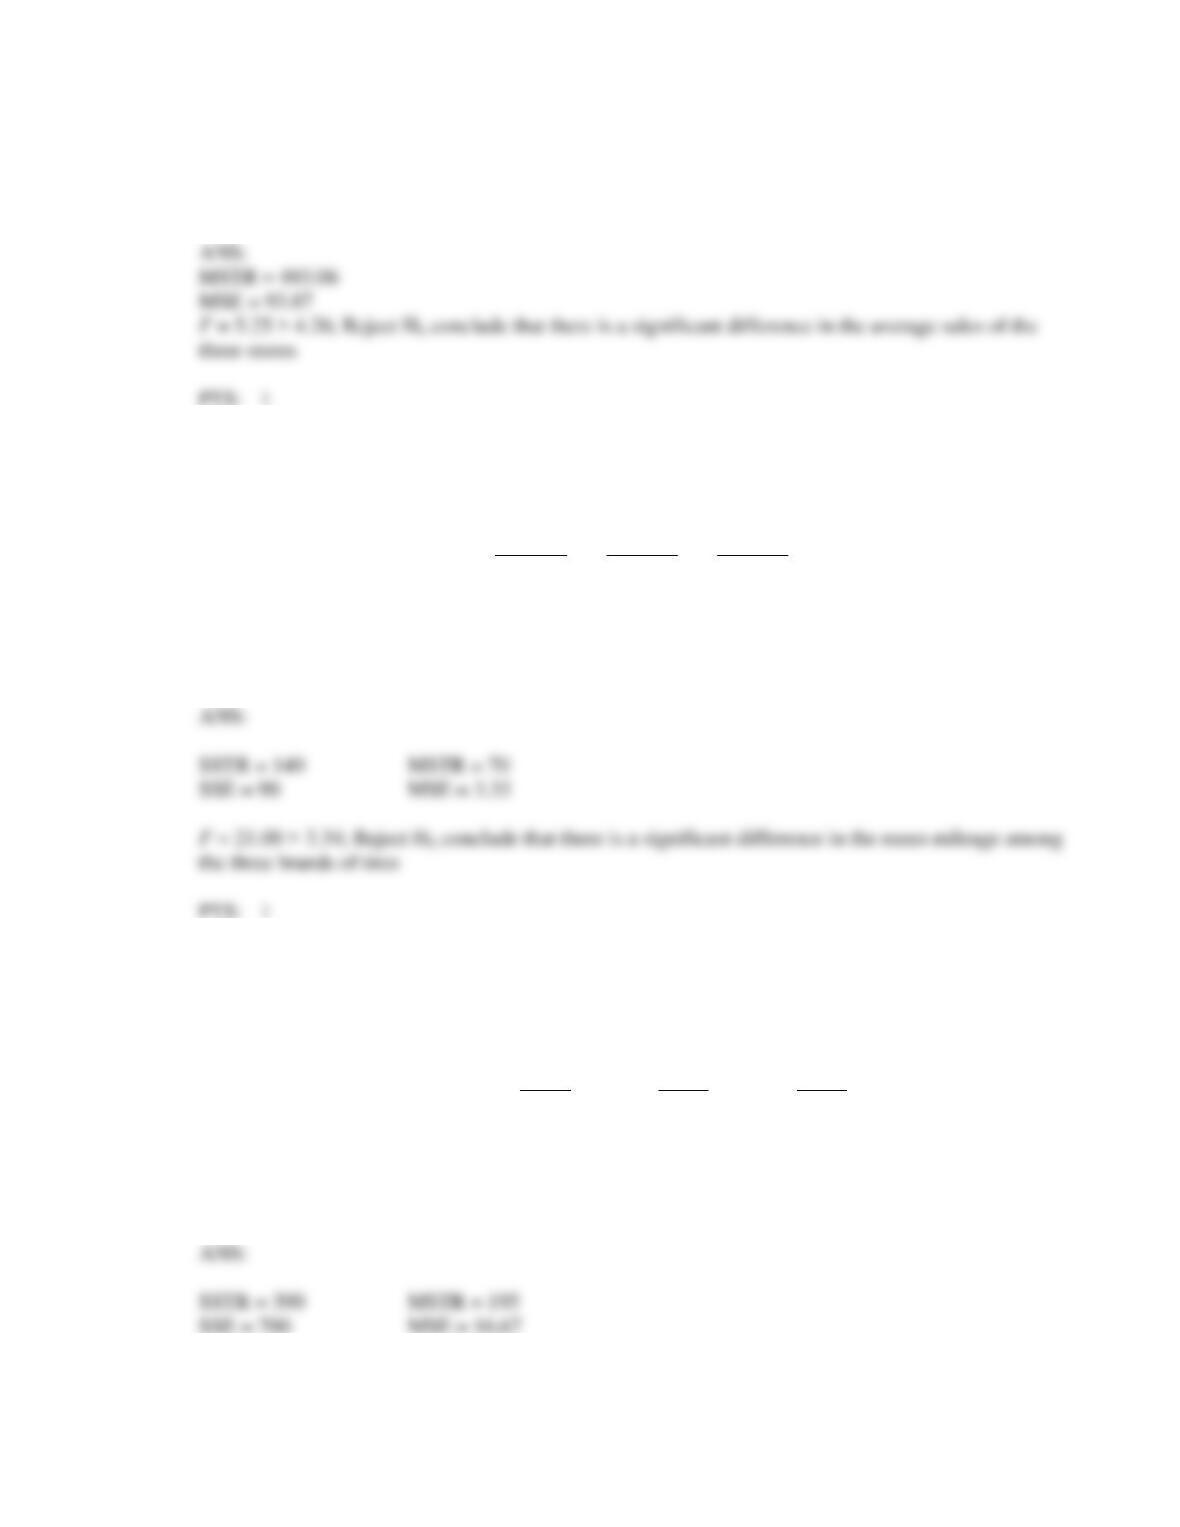
At a 5% level of significance determine if there is a significant difference in the mean weekly units of
production for the three types of work schedules.
9. Six observations were selected from each of three populations. The data obtained is shown below:
Sample 1
Sample 2
Sample 3
31
37
37
28
32
31
34
34
32
32
24
39
26
32
30
29
33
35
Test at = 0.05 level to determine if there is a significant difference in the means of the three
populations.
10. The test scores for selected samples of sociology students who took the course from three different
instructors are shown below.
Instructor A
Instructor B
Instructor C
83
90
85
60
55
90
80
84
90
85
91
95
71
85
80
At = 0.05, test to see if there is a significant difference among the averages of the three groups.
11. Three universities administer the same comprehensive examination to the recipients of MS degrees in
psychology. From each institution, a random sample of MS recipients was selected, and these
recipients were then given the exam. The following table shows the scores of the students from each
university.
University A
University B
University C
89
60
81
95
95
70
75
89
90
92
80
78
99
66
77
At = 0.01, test to see if there is any significant difference in the average scores of the students from
the three universities. (Note that the sample sizes are not equal.)
12. In a completely randomized experimental design, 11 experimental units were used for each of the 3
treatments. Part of the ANOVA table is shown below.
Source of Variation
Sum of
Squares
Degrees of
Freedom
Mean
Square
F
Between Treatments
1,500
_____?
_____?
_____?
Within Treatments (Error)
_____?
_____?
_____?
Total
6,000
_____?
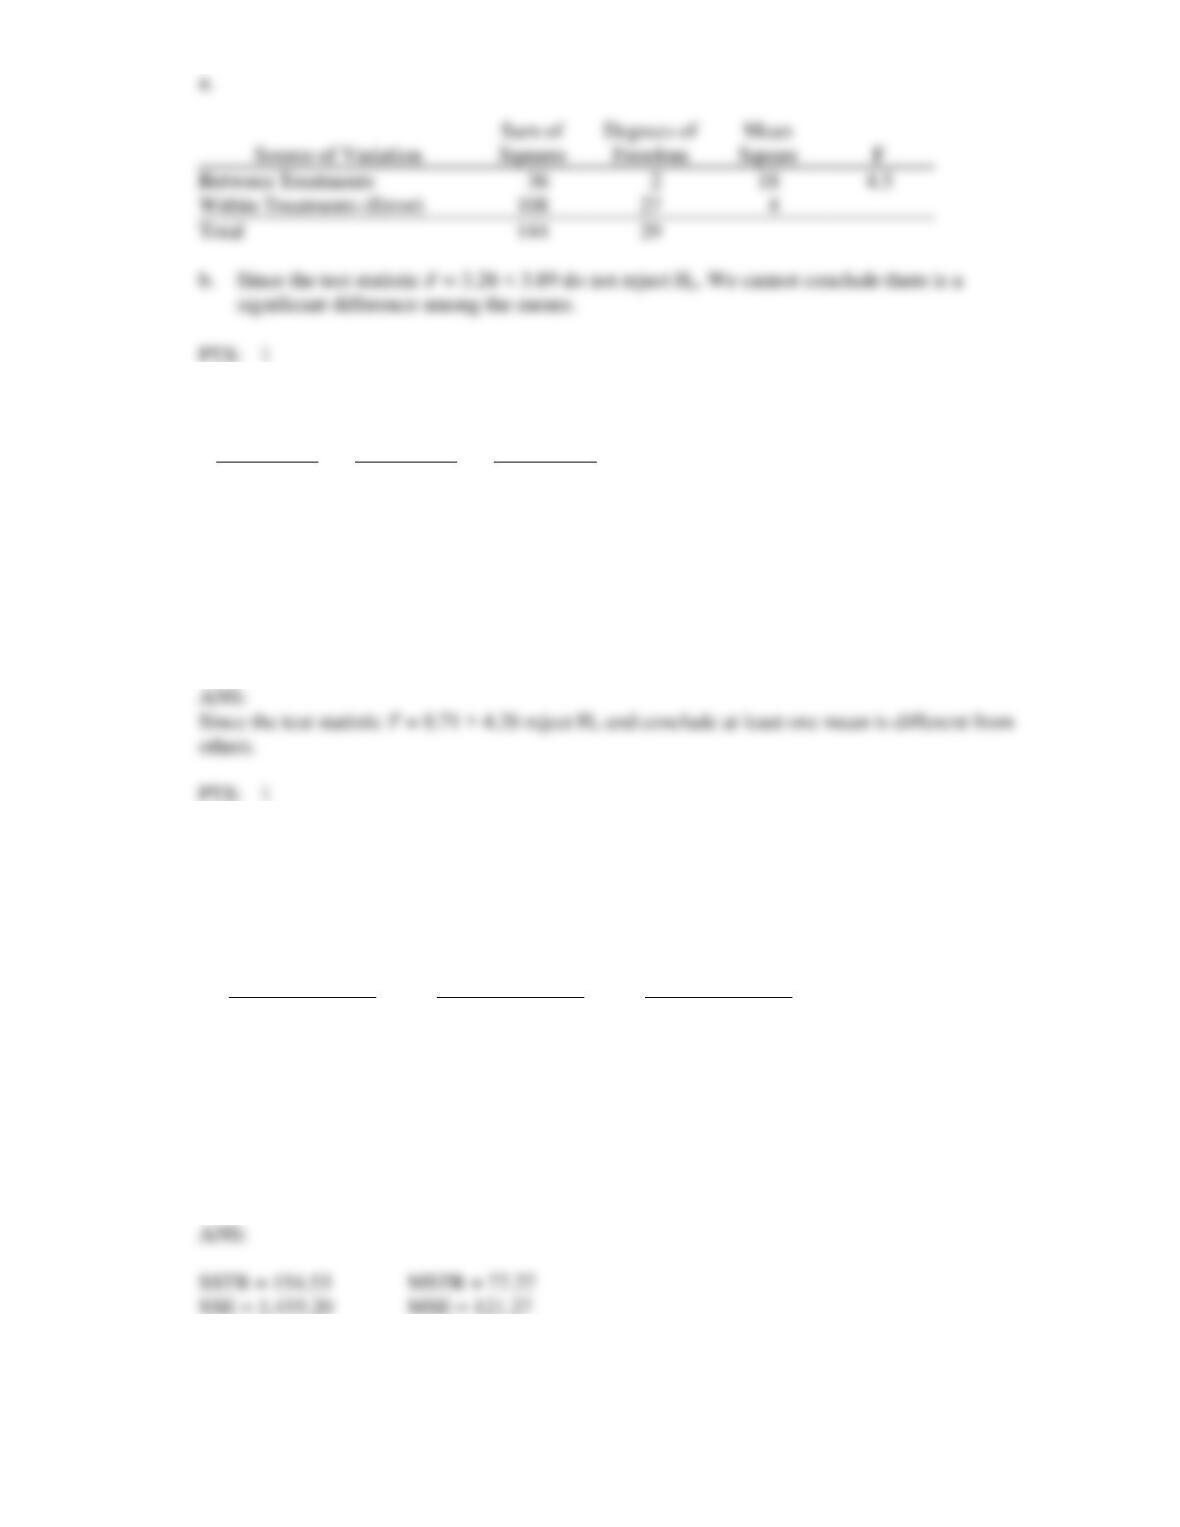
a.
Fill in the blanks in the above ANOVA table.
b.
At a 5% level of significance, test to determine whether or not the means of the 3 populations
are equal.
Sum of
Degrees of
Mean
Between Treatments
1,500
750
Within Treatments (Error)
4,500
150
Total
6,000
13. MNM, Inc. has three stores located in three different areas. Random samples of the sales of the three
stores (in $1,000) are shown below.
Store 1
Store 2
Store 3
88
76
85
84
78
67
88
60
55
82
58
92
At a 5% level of significance, test to see if there is a significant difference in the average sales of the
three stores. Show your complete work and the ANOVA table. (Please note that the sample sizes are
not equal.)
14. Three different brands of tires were compared for wear characteristics. For each brand of tire, ten tires
were randomly selected and subjected to standard wear testing procedures. The average mileage
obtained for each brand of tire and sample standard deviations (both in 1000 miles) are shown below.
Brand A
Brand B
Brand C
Average mileage
37
38
33
Sample variance
3
4
2
Use the above data and test to see if the mean mileage for all three brands of tires is the same. Let
Alpha = 0.05.
SSTR = 140
MSTR = 70
SSE = 90
MSE = 3.33
15. Three different models of automobiles (A, B, and C) were compared for gasoline consumption. For
each model of car, fifteen cars were randomly selected and subjected to standard driving procedures.
The average miles/gallon obtained for each model of car and sample standard deviations are shown
below.
Car A
Car B
Car C
Average Mile Per Gallon
42
49
44
Sample Standard Deviation
4
5
3
Use the above data and test to see if the mean gasoline consumption for all three models of cars is the
same. Let Alpha = 0.05.
SSTR = 390
MSTR = 195
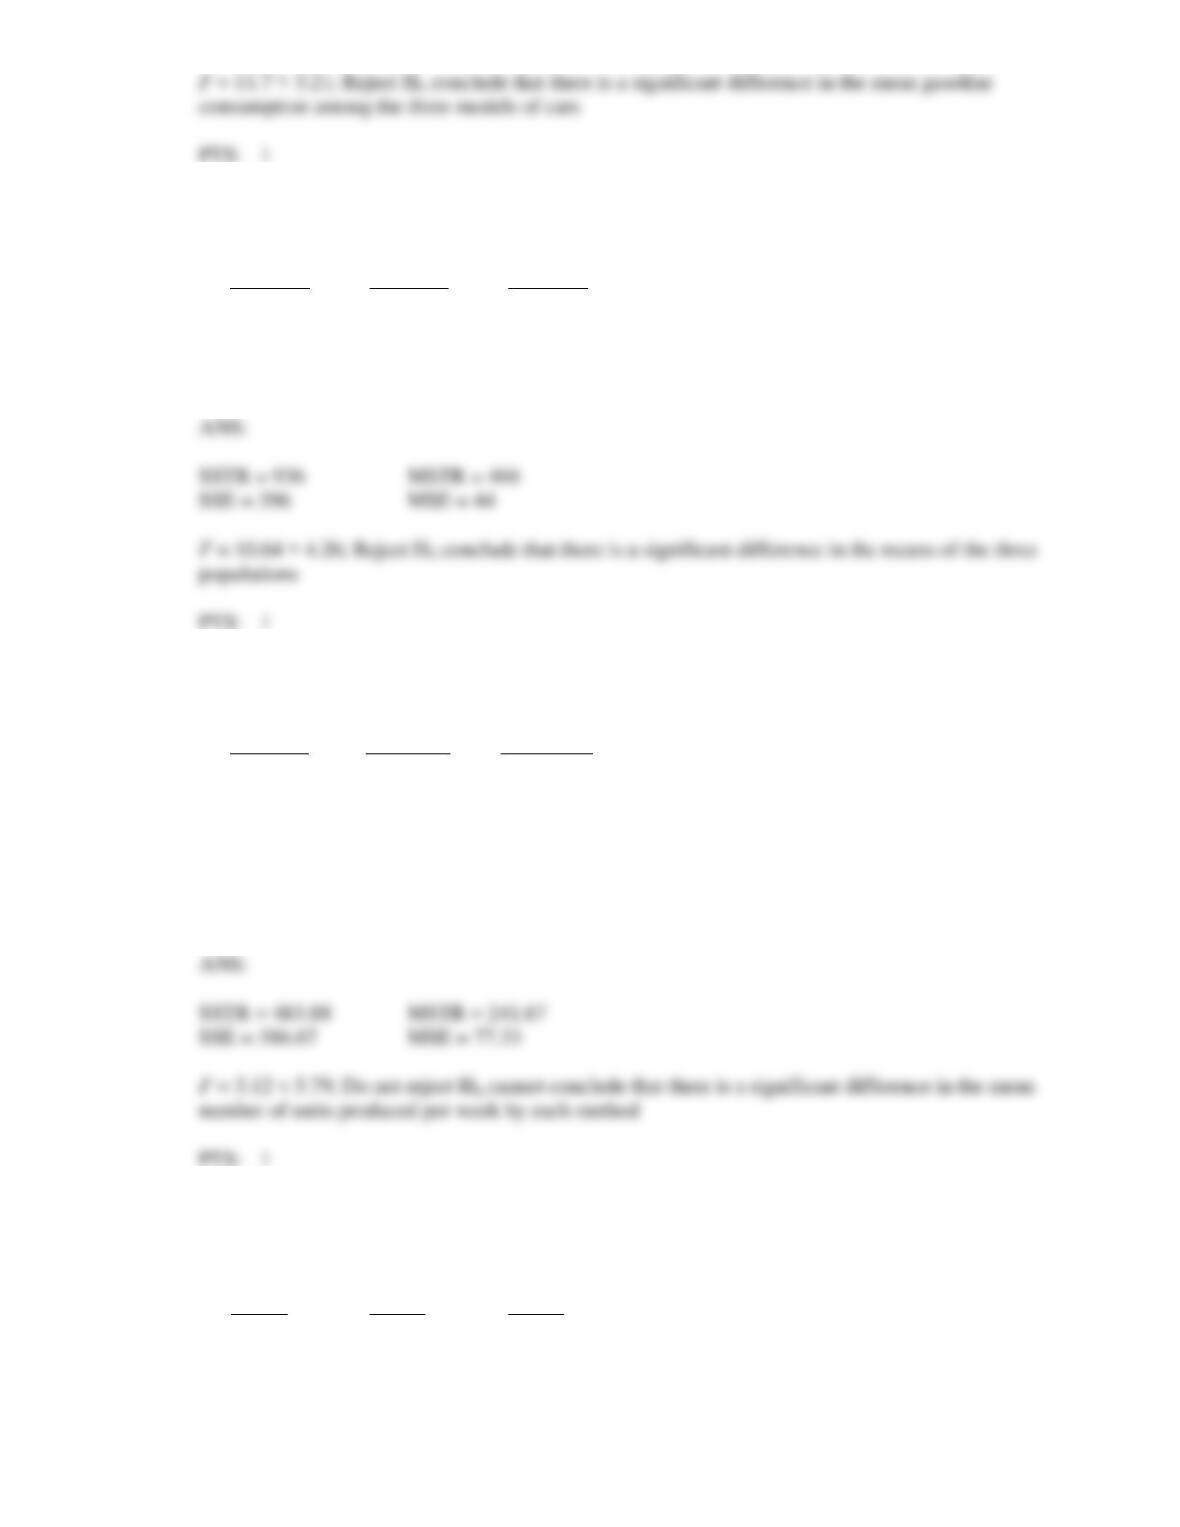
16. At = 0.05, test to determine if the means of the three populations (from which the following samples
are selected) are equal.
Sample 1
Sample 2
Sample 3
60
84
60
78
78
57
72
93
69
66
81
66
17. In order to test to see if there is any significant difference in the mean number of units produced per
week by each of three production methods, the following data were collected:
Method I
Method II
Method III
182
170
162
170
192
166
180
190
At the Alpha = 0.05 level of significance, is there any difference in the mean number of units produced
per week by each method? Show the complete ANOVA table. (Please note that the sample sizes are
not equal.)
18. A dietician wants to see if there is any difference in the effectiveness of three diets. Eighteen people,
comprising a sample, were randomly assigned to the three diets. Below you are given the total amount
of weight lost in a month by each person.
Diet A
Diet B
Diet C
14
12
25
18
10
32