An auto manufacturer wants to estimate the annual income of owners of a particular
model of automobile. A random sample of 200 current owners is taken. The population
standard deviation is known. Which Excel function would not be appropriate to use to
construct a confidence interval estimate?
a. NORM.S.INV
b. COUNTIF
c. AVERAGE
d. STDEV.S
We want to test whether or not the addition of 3 variables to a model will be statistically
significant. You are given the following information based on a sample of 25
observations.
= 62.42 – 1.836x1 + 25.62x2
SSE = 725 SSR = 526
The equation was also estimated including the 3 variables. The results are
= 59.23 – 1.762x1 + 25.638x2 + 16.237x3 + 15.297x4 – 18.723x5
SSE = 520 SSR = 731
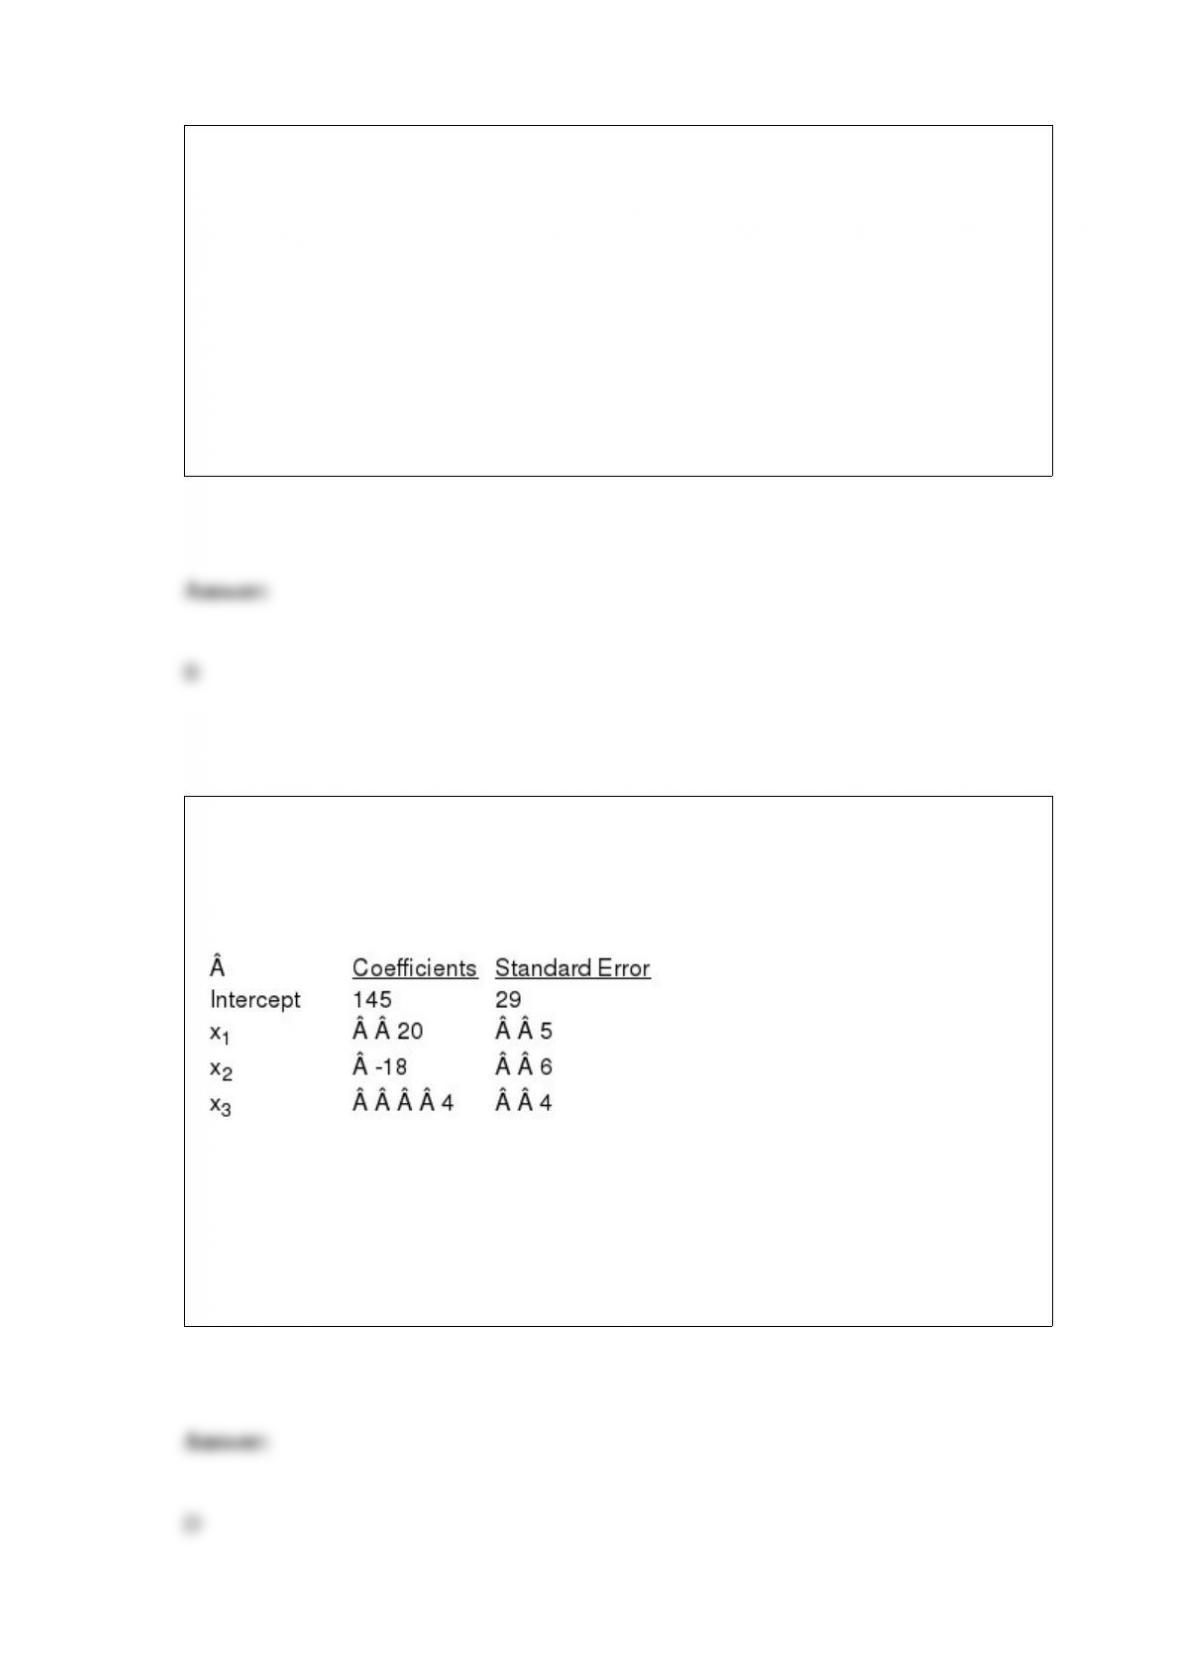
Exhibit 13-4
In a completely randomized experimental design involving five treatments, thirteen
observations were recorded for each of the five treatments. The following information
is provided.
SSTR = 200 (Sum Square Between Treatments)
SST = 800 (Total Sum Square)
Refer to Exhibit 13-4. The mean square within treatments (MSE) is
a. 50
b. 10
c. 200
d. 600
Exhibit 16-3
Below you are given a partial Excel output based on a sample of 25 observations.
Refer to Exhibit 16-3. The critical t value obtained from the table to test an individual
parameter at the 5% level is
a. 2.06
b. 2.069
c. 2.074
d. 2.080

A two-tailed test is a
a. hypothesis test in which rejection region is in both tails of the sampling distribution
b. hypothesis test in which rejection region is in one tail of the sampling distribution
c. hypothesis test in which rejection region is only in the lower tail of the sampling
distribution
d. hypothesis test in which rejection region is only in the upper tail of the sampling
distribution
The result obtained when a decision alternative is chosen and a chance event occurs is
known as
a. happenstance
b. consequence
c. alternative probability
d. conditional probability
If the value of c in a single-stage acceptance sampling plan is increased, with n
remaining constant, the probability of accepting the lot
a. increases
b. decreases

c. remains the same
d. might increase or decrease, depending on the percent defective in the lot
The assembly time for a product is uniformly distributed between 6 to 10 minutes. The
standard deviation of assembly time (in minutes) is approximately
a. 0.3333
b. 0.1334
c. 16
d. None of the alternative answers is correct.
A probability sampling method in which we randomly select one of the first k elements
and then select every kth element thereafter is
a. stratified random sampling
b. cluster sampling
c. systematic sampling
d. convenience sampling
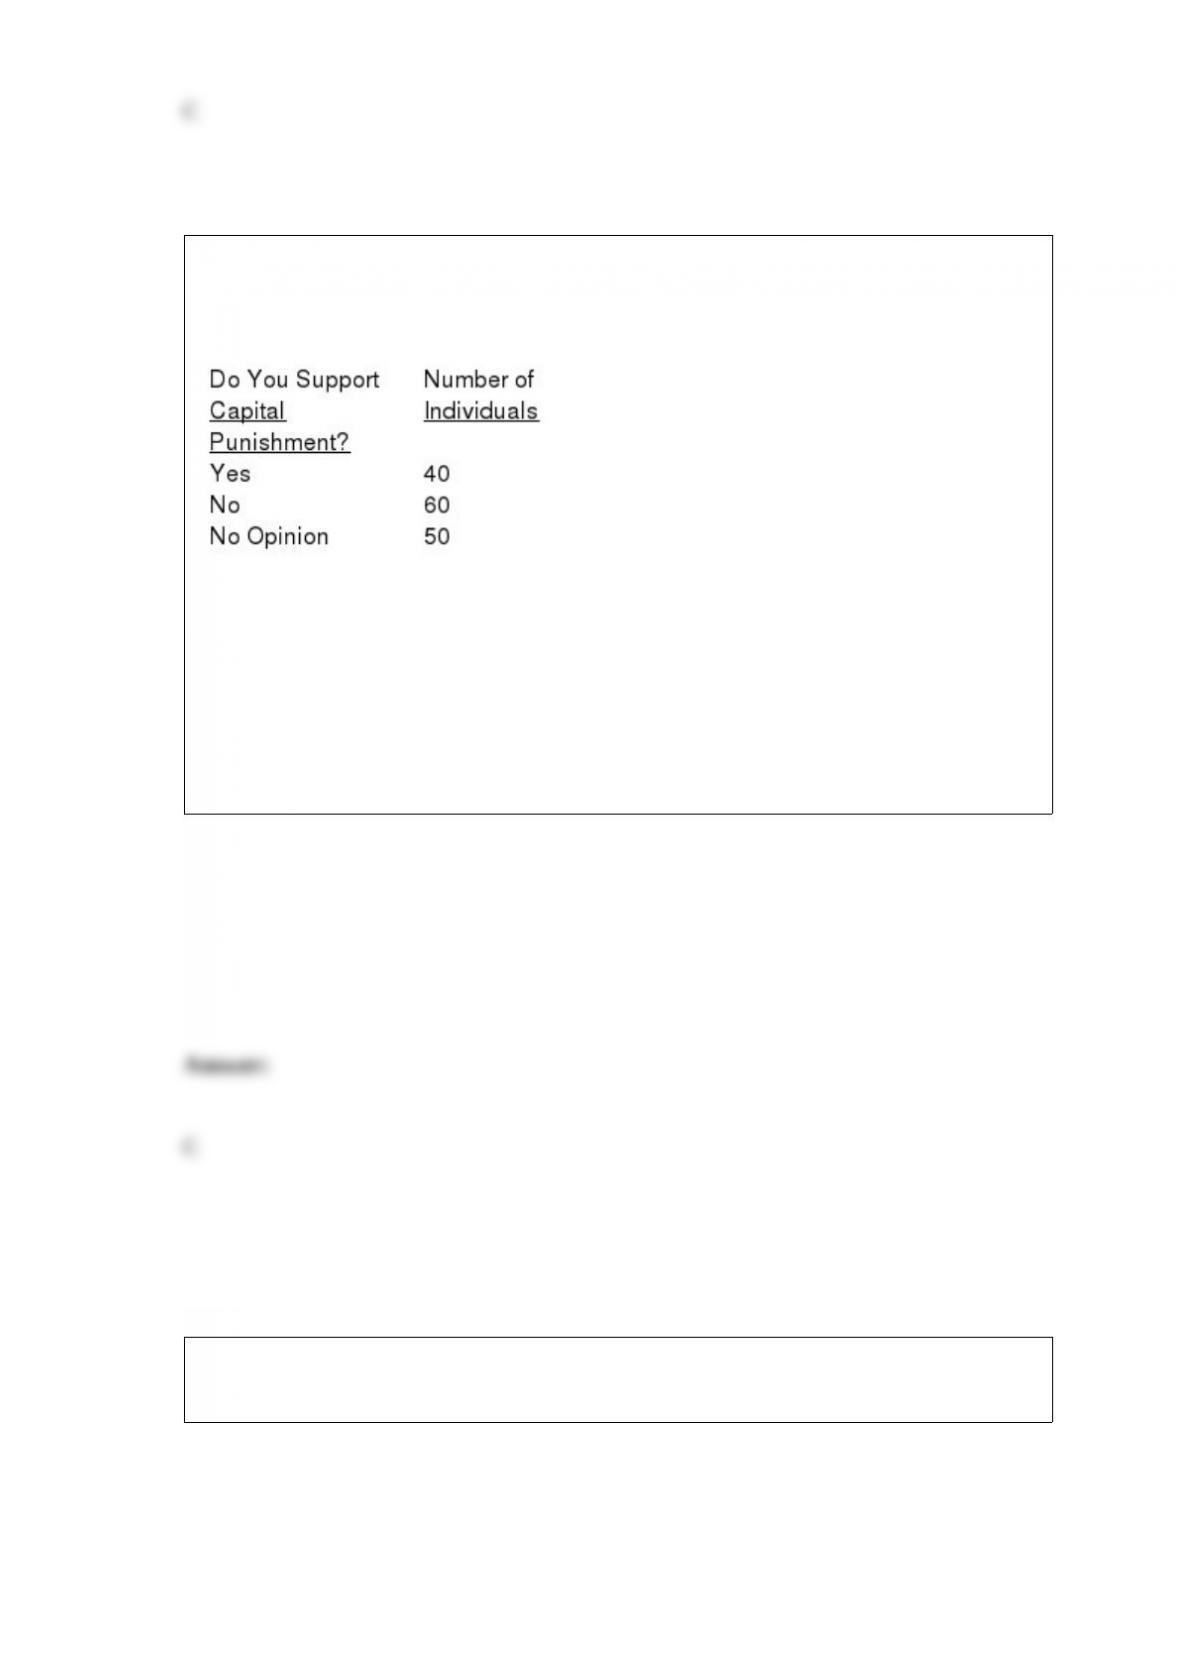
Exhibit 12-1
When individuals in a sample of 150 were asked whether or not they supported capital
punishment, the following information was obtained.
We are interested in determining whether or not the opinions of the individuals (as to
Yes, No, and No Opinion) are uniformly distributed.
Refer to Exhibit 12-1. The number of degrees of freedom associated with this problem
is
a. 150
b. 149
c. 2
d. 3
Exhibit 2-1
The numbers of hours worked (per week) by 400 statistics students are shown below.
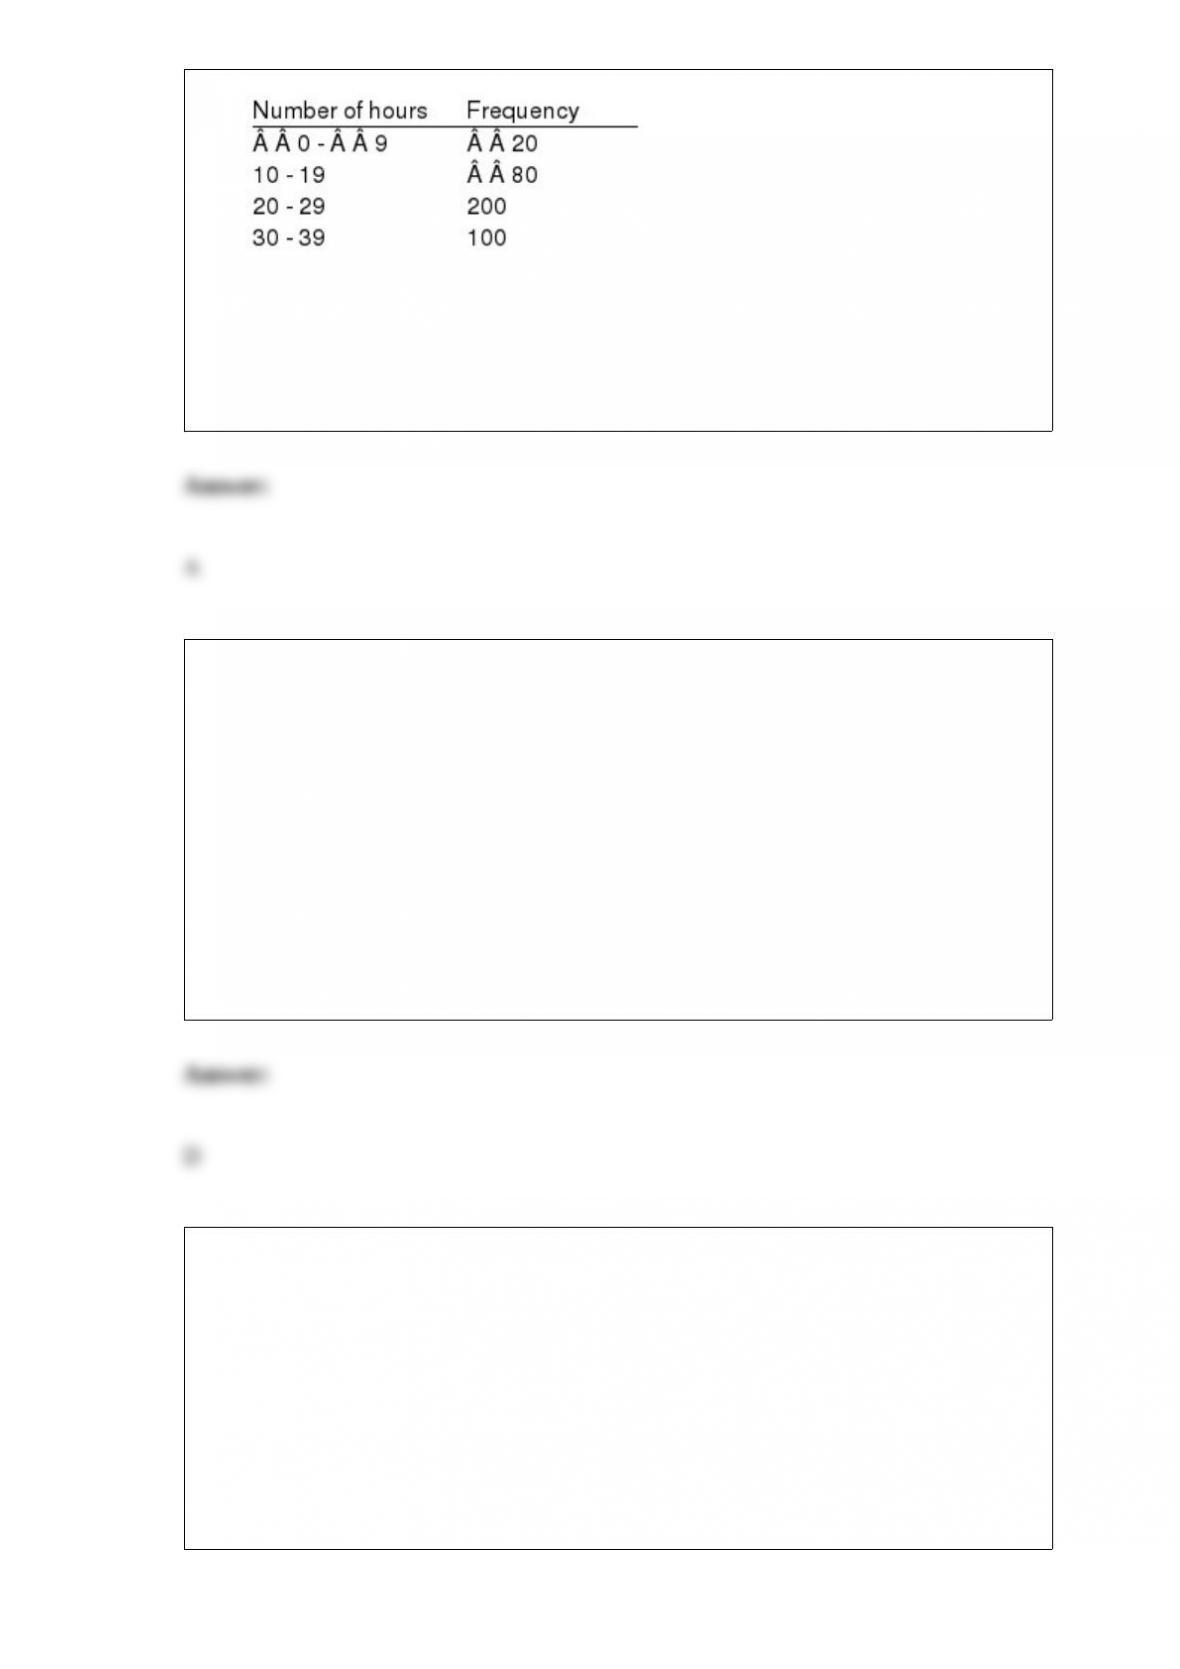
Refer to Exhibit 2-1. The percentage of students working 10 19 hours is
a. 20%
b. 25%
c. 75%
d. 80%
A company wants to identify which of two production methods has the smaller
completion time. One sample of workers is selected and each worker first uses one
method and then uses the other method. The sampling procedure being used to collect
completion time data is based on
a. cross samples
b. pooled samples
c. independent samples
d. matched samples
A regression model in which more than one independent variable is used to predict the
dependent variable is called
a. a simple linear regression model
b. a multiple regression model
c. an independent model
d. None of these alternatives is correct.
Scores for a standardized test are normally distributed with a mean of 1200 and a
standard deviation of 60. A sample of 36 scores is selected.
a. What is the probability that the sample mean will be larger than 1224?
b. What is the probability that the sample mean will be less than 1230?
c. What is the probability that the sample mean will be between 1200 and 1214?
d. What is the probability that the sample mean will be greater than 1200?
e. What is the probability that the sample mean will be larger than 73.46?
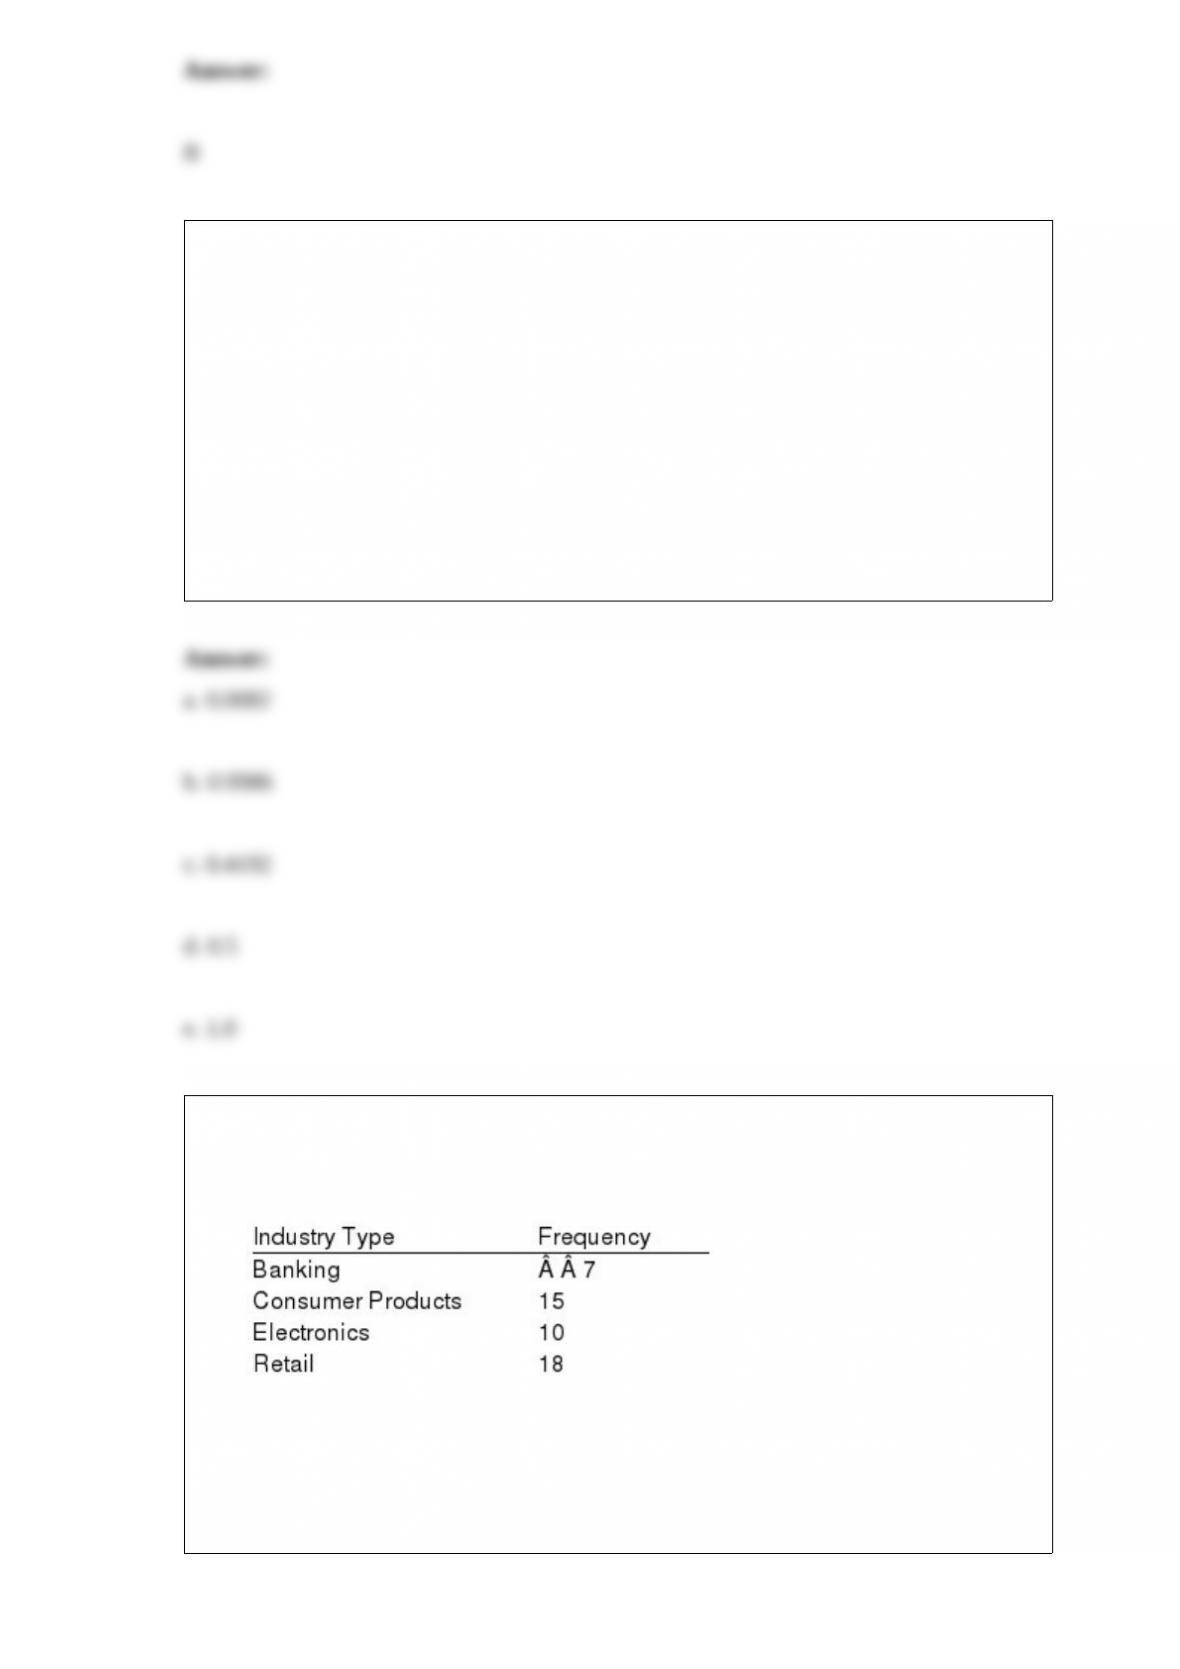
Exhibit 2-2
Information on the type of industry is provided for a sample of 50 Fortune 500
companies.
Refer to Exhibit 2-2. The number of industries that are classified as retail is
a. 32
b. 18
c. 0.36
d. 36%
A random sample of 36 students at a community college showed an average age of 25
years. Assume the ages of all students at the college are normally distributed with a
standard deviation of 1.8 years. The 98% confidence interval for the average age of all
students at this college is
a. 24.301 to 25.699
b. 24.385 to 25.615
c. 23.200 to 26.800
d. 23.236 to 26.764
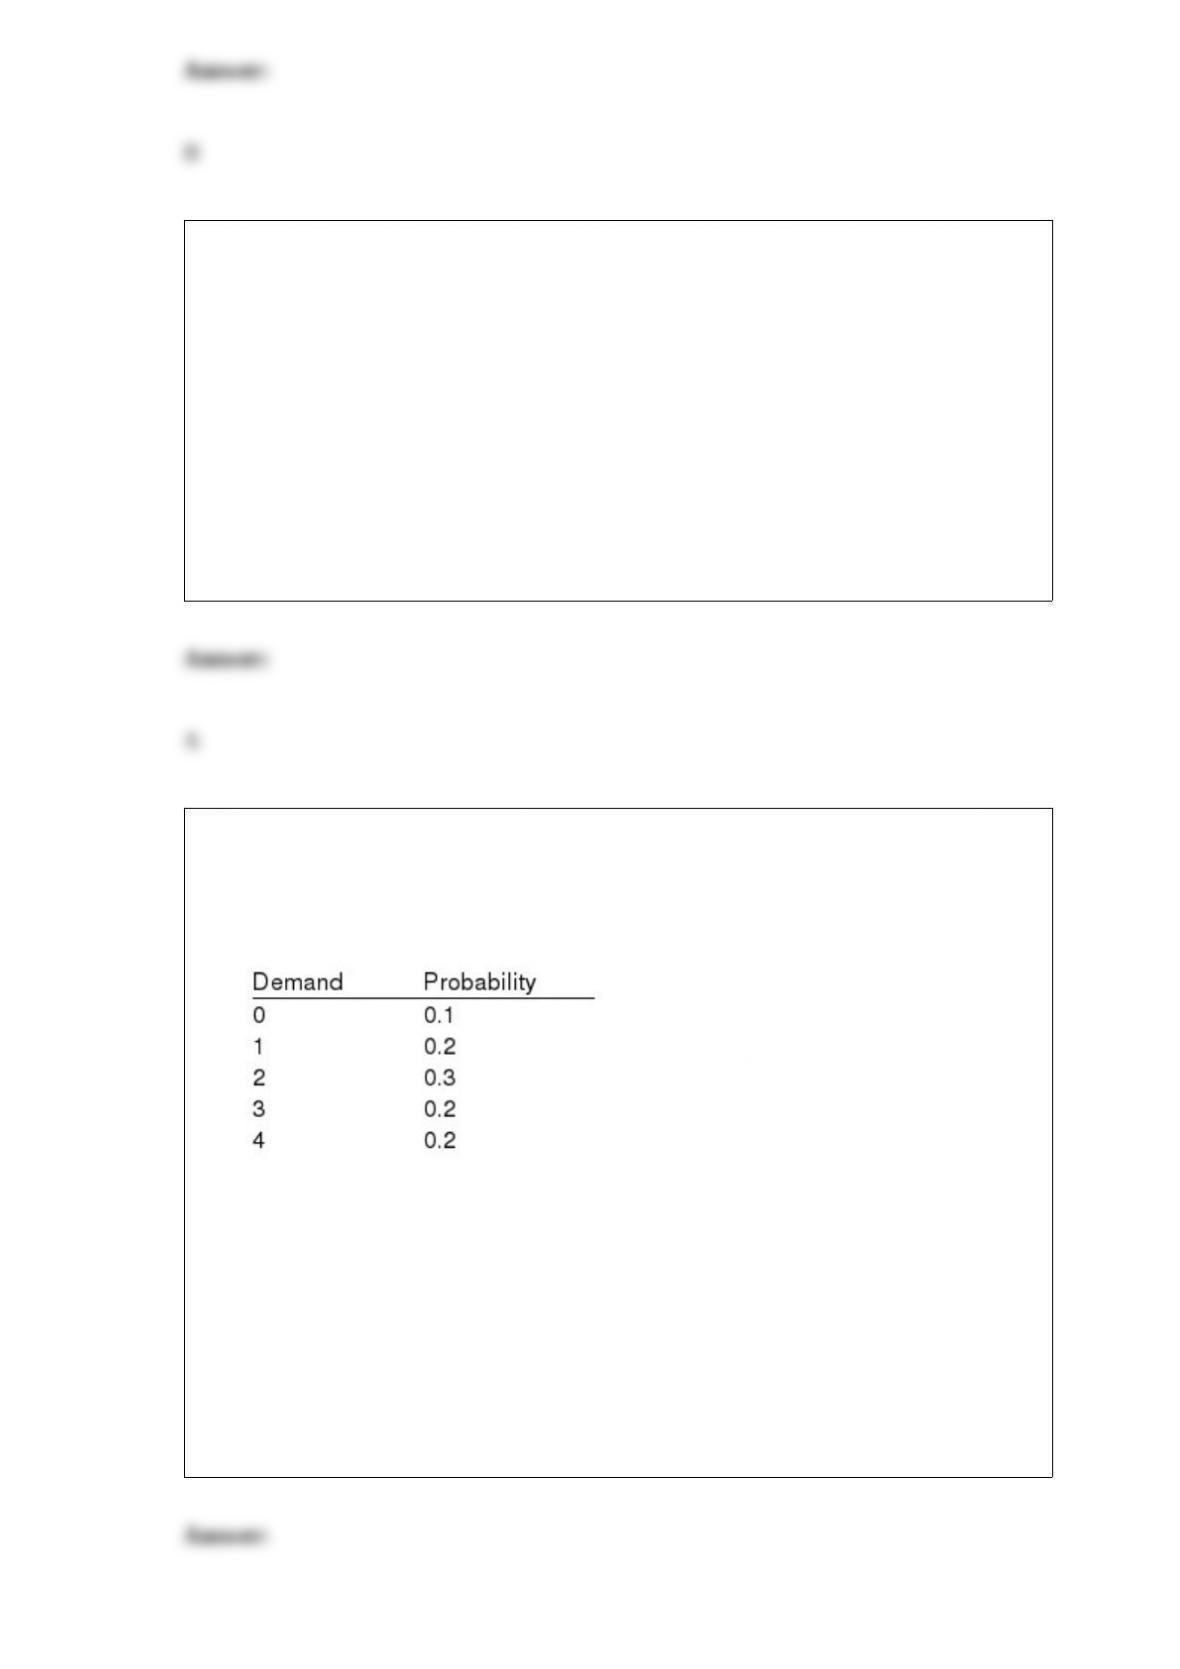
Exhibit 5-1
The following represents the probability distribution for the daily demand of
microcomputers at a local store.
Refer to Exhibit 5-1. The expected daily demand is
a. 1.0
b. 2.2
c. 2
d. 4
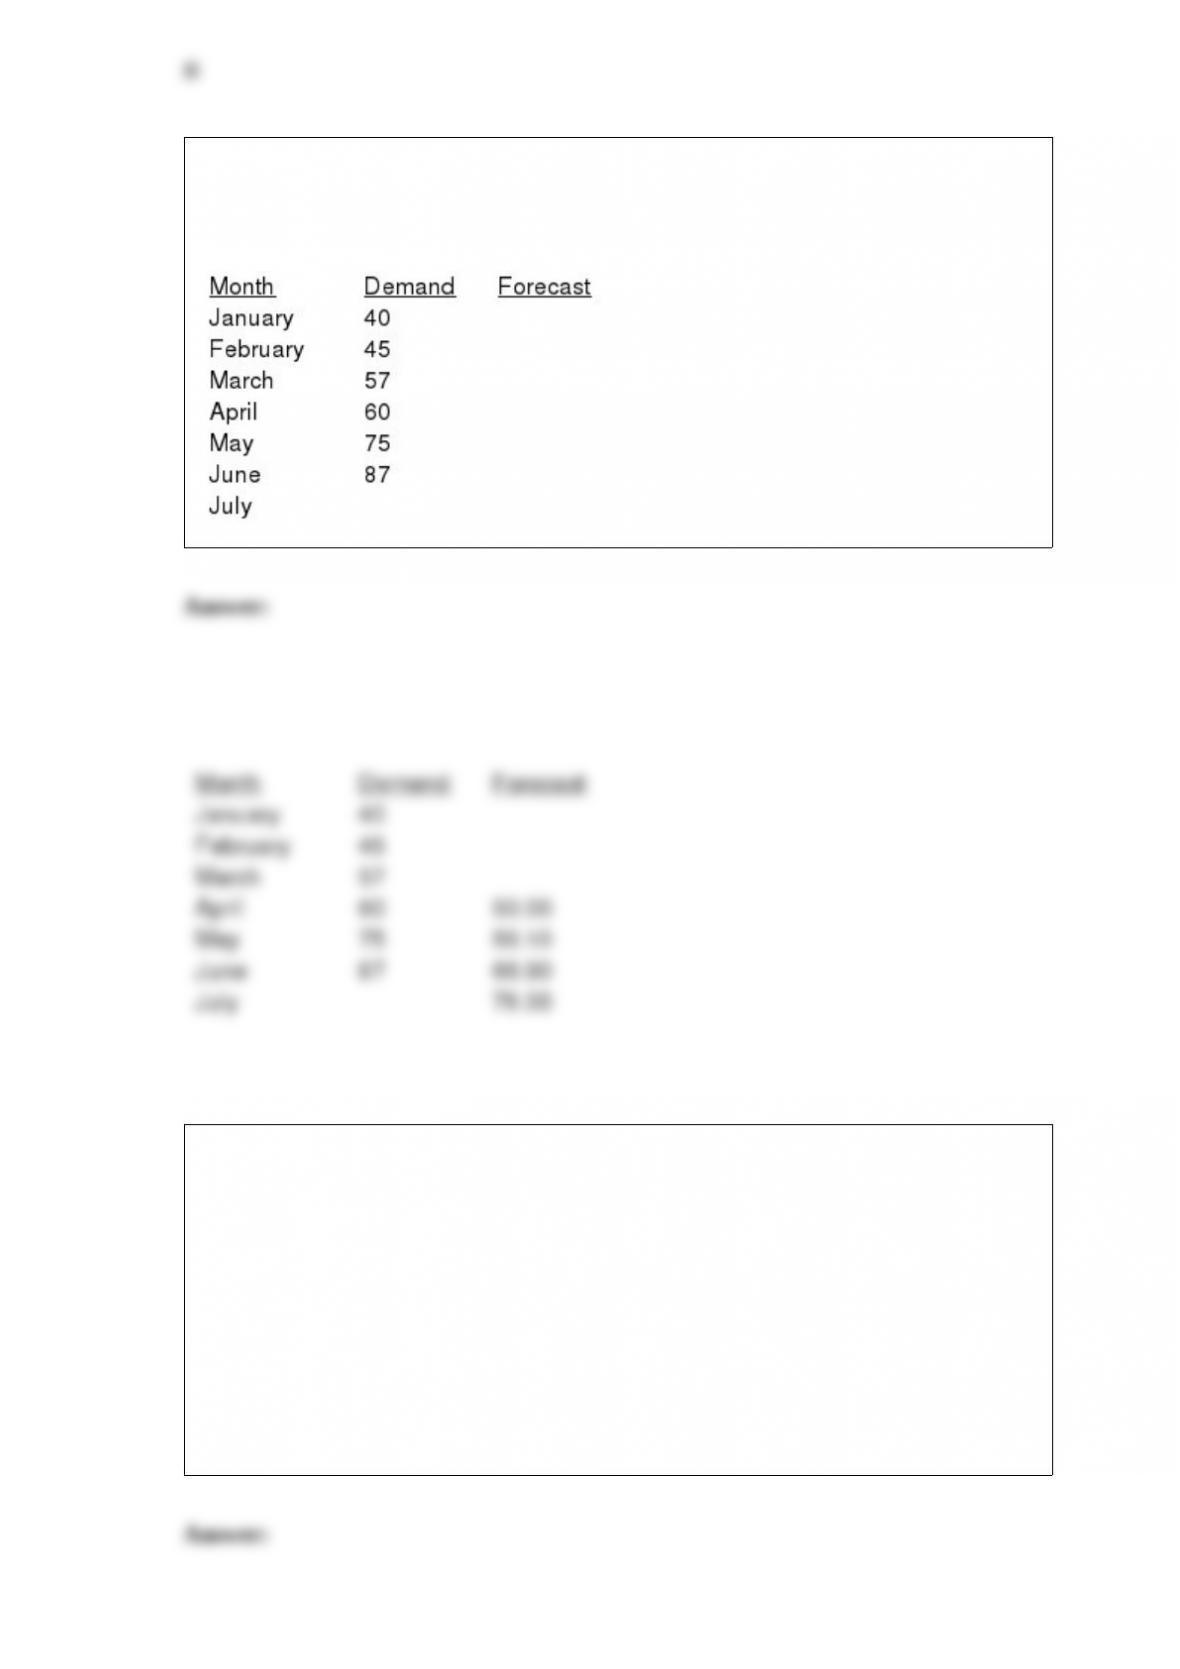
What is the forecast for July based on a three-month weighted moving average applied
to the following past demand data and using the weights: 5, 3,and 2 (largest weight is
for most recent data)? Show all of your computations for April through July.
Random samples of size 49 are taken from a population that has 200 elements, a mean
of 180, and a variance of 196. The distribution of the population is unknown. The mean
and the standard error of the distribution of sample means are
a. 180 and 24.39
b. 180 and 28
c. 180 and 1.74
d. 180 and 2
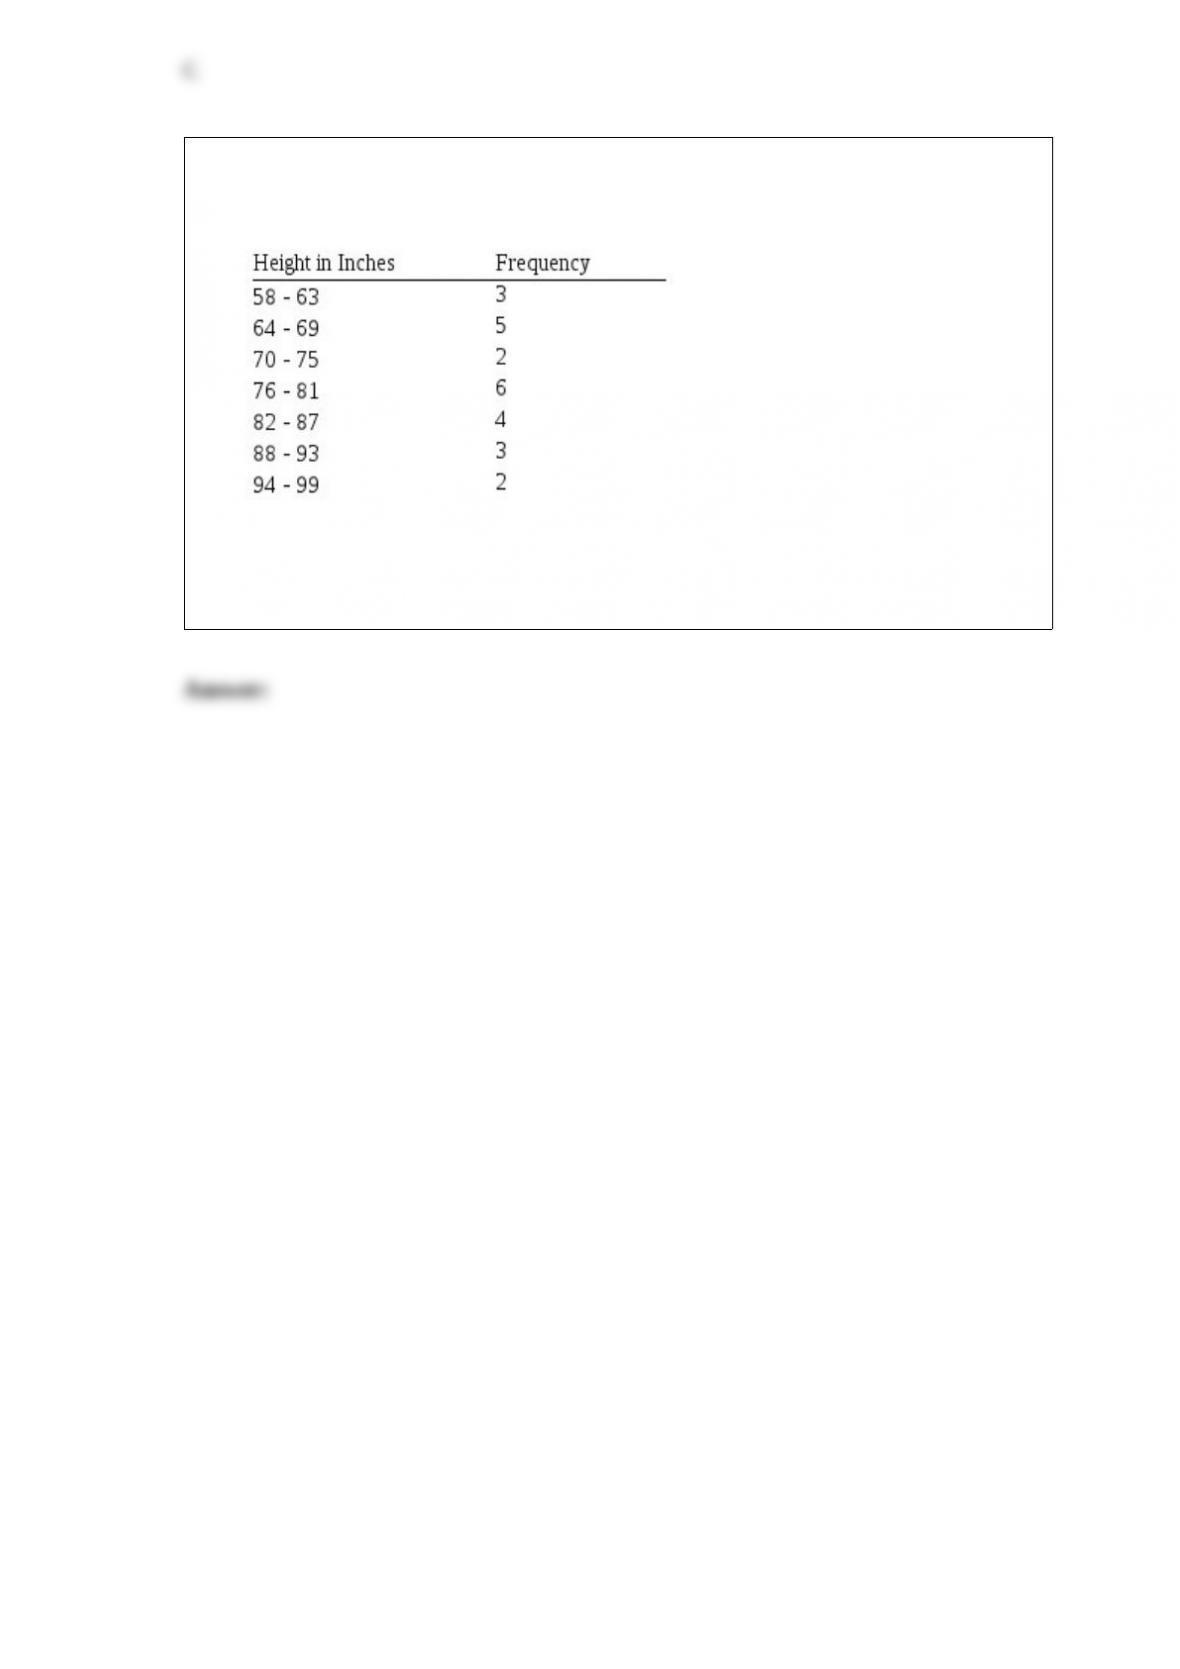
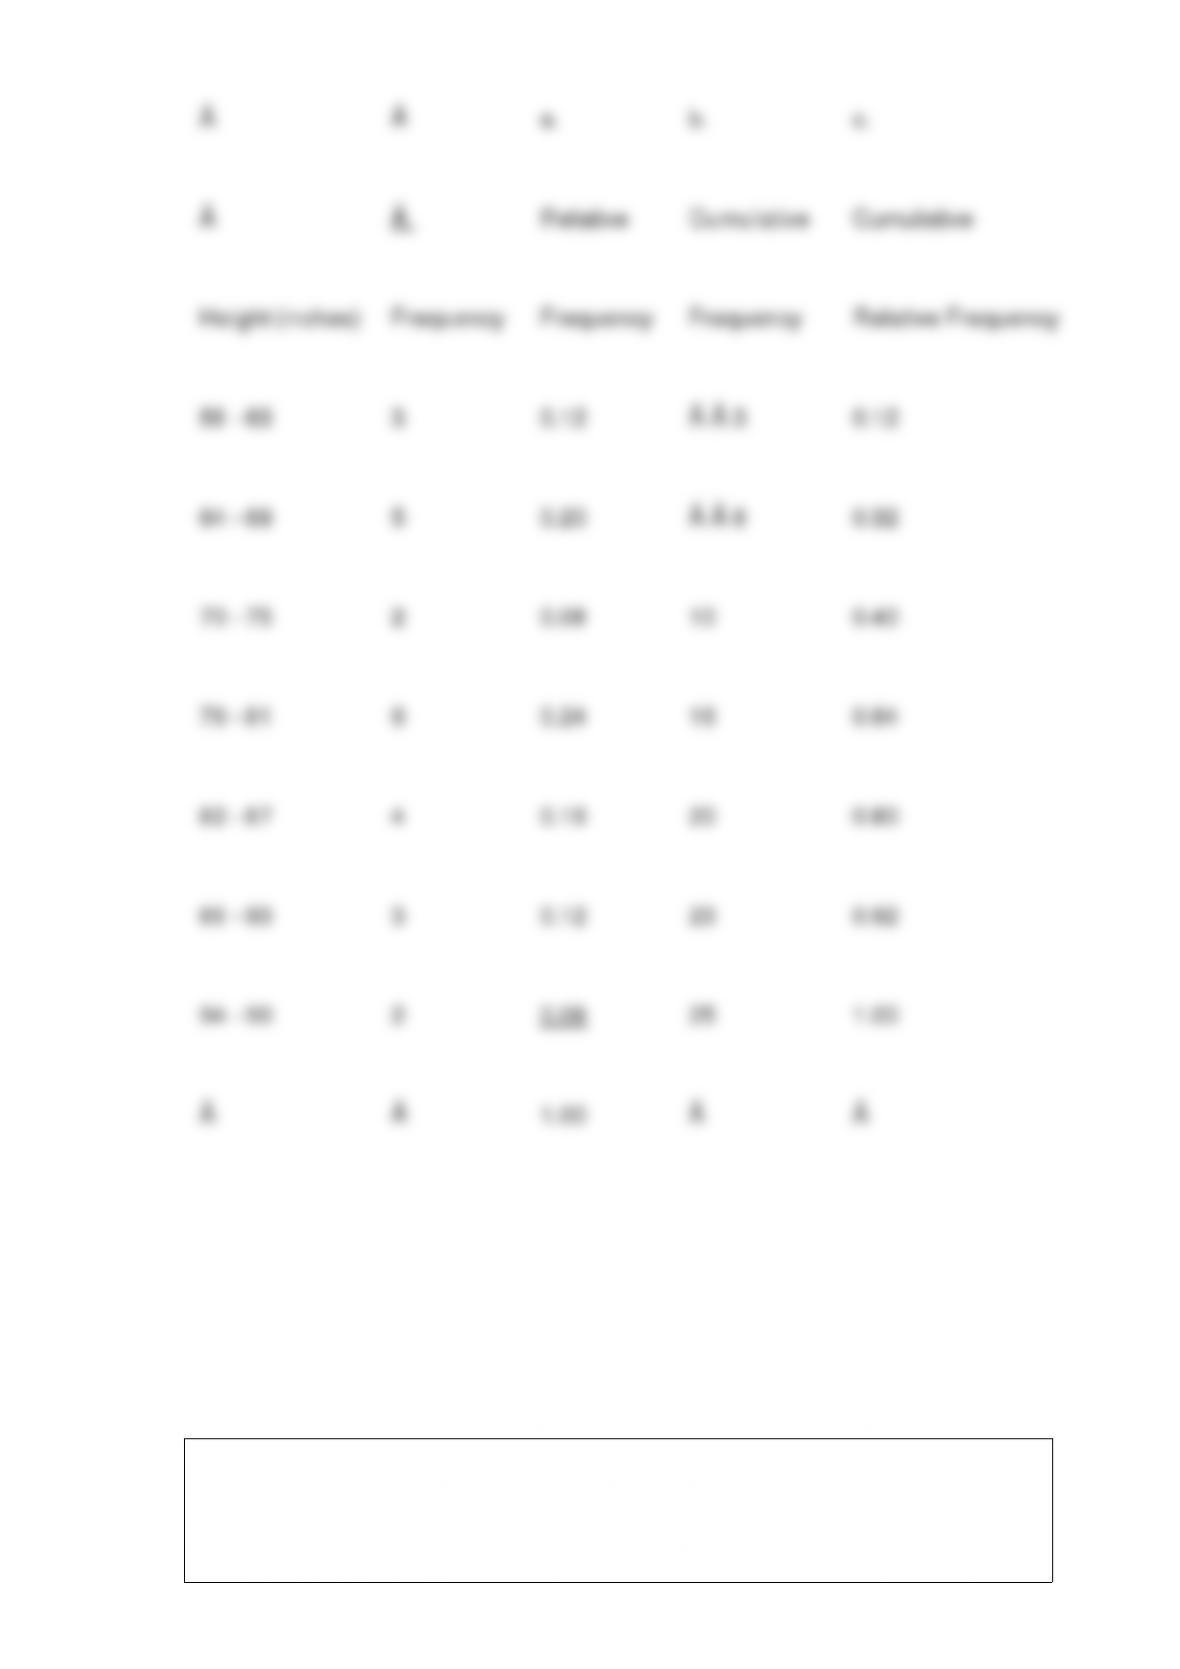
The frequency distribution below was constructed from data collected from
a group of 25 students.
a. Construct a relative frequency distribution.
b. Construct a cumulative frequency distribution.
c. Construct a cumulative relative frequency distribution.
The process of analyzing sample data in order to draw conclusions about the
characteristics of a population is called
a. descriptive statistics
b. statistical inference
c. data analysis
d. data summarization
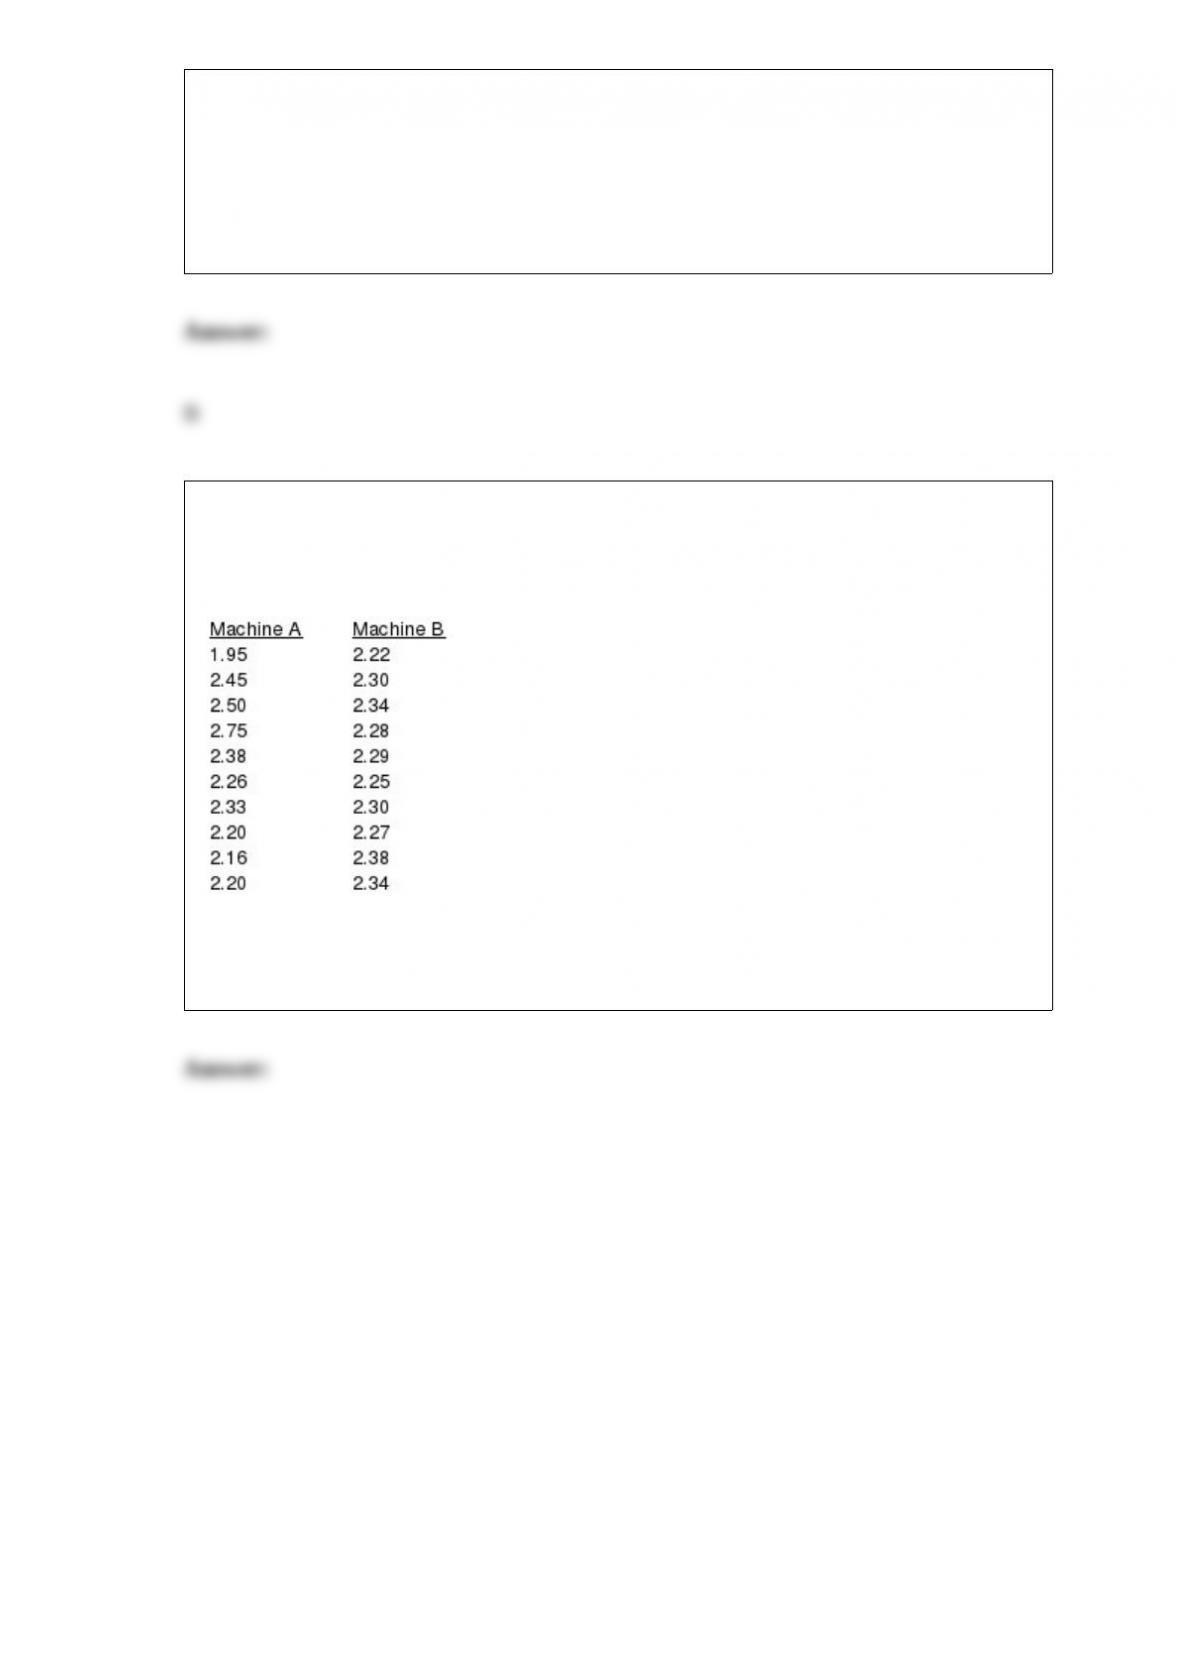
In a manufacturing production process, two machines are being compared. The data
below shows the diameters, measured in millimeters, of a sample of ball bearings
produced by each machine.
Use Excel to determine whether the variance in diameters differs between the two
machines? Use a .05 level of significance.
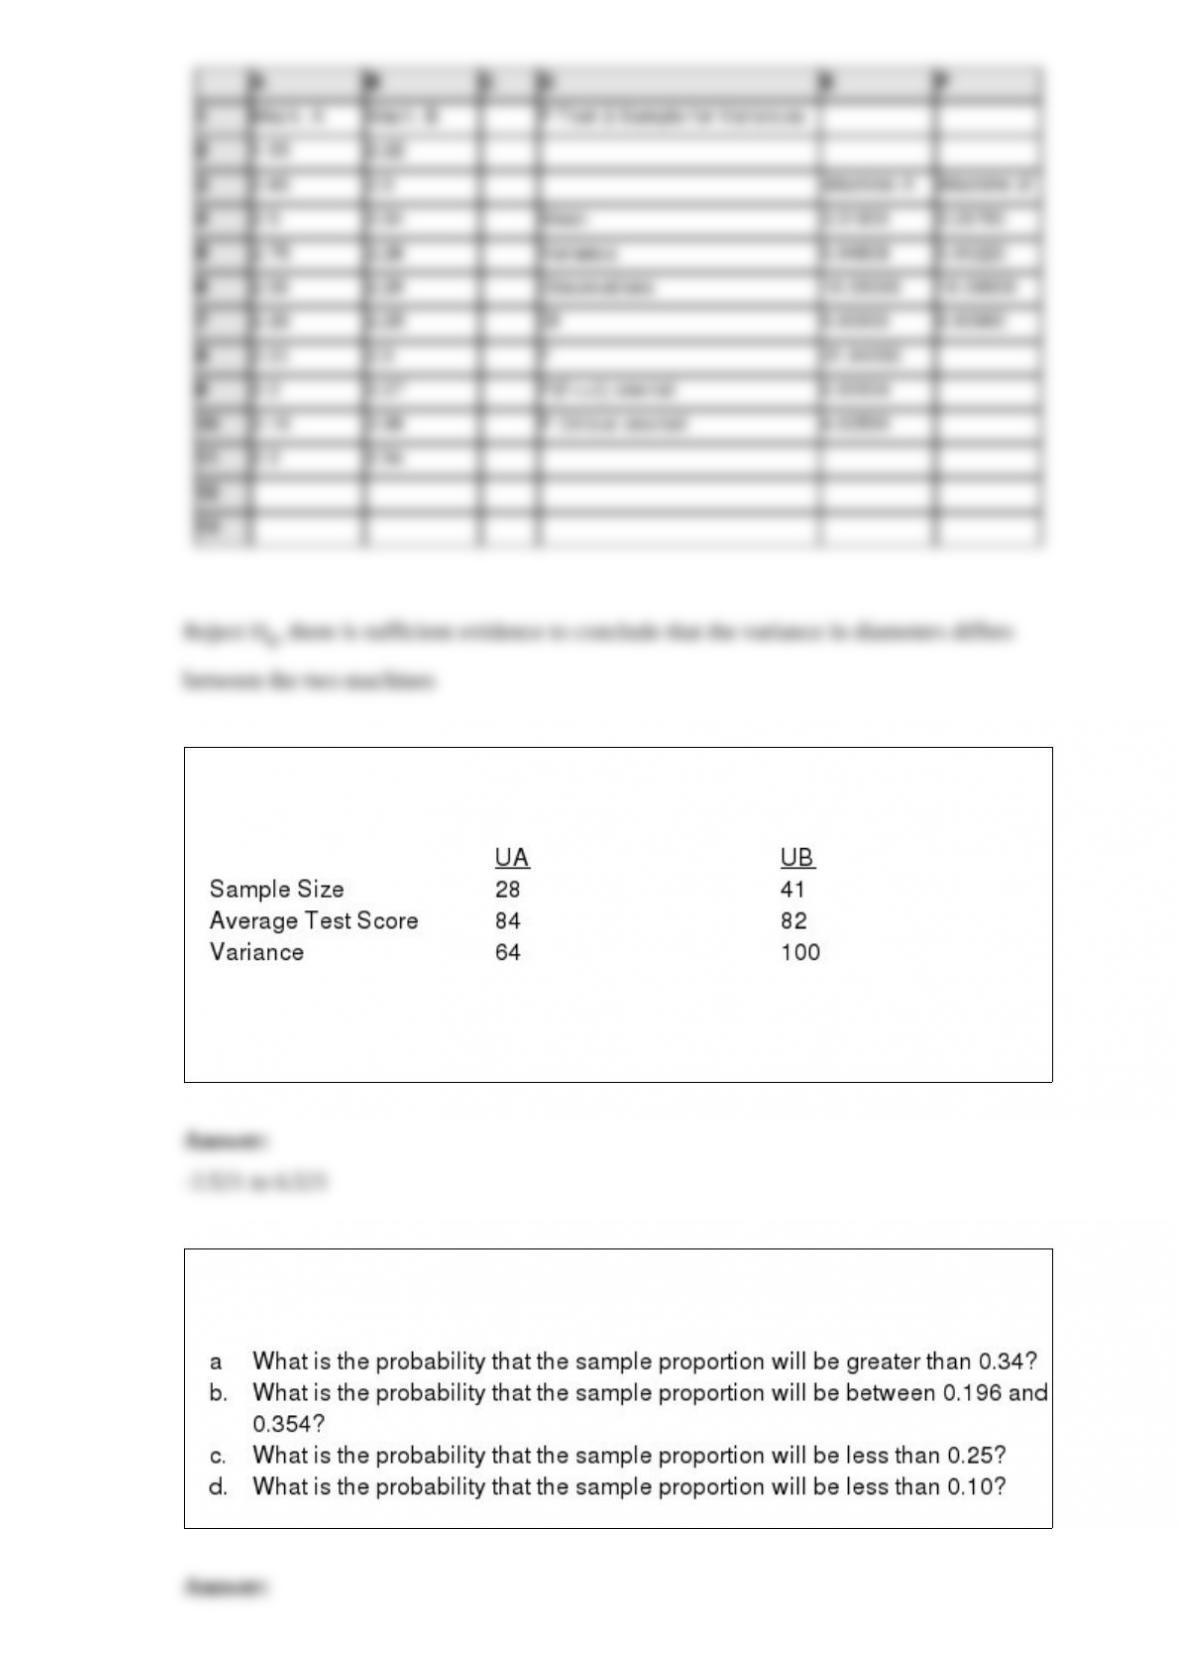
Test scores on a standardized test from samples of students from two universities are
given below.
Provide a 98% confidence interval estimate for the difference between the test scores of
the two universities.
A department store has determined that 25% of all their sales are credit sales. A random
sample of 75 sales is selected.

Below you are given ages that were obtained by taking a random sample of 9
undergraduate students.
Use Excel to determine an interval estimate for the mean of the population at a 99%
confidence level. Interpret your results.
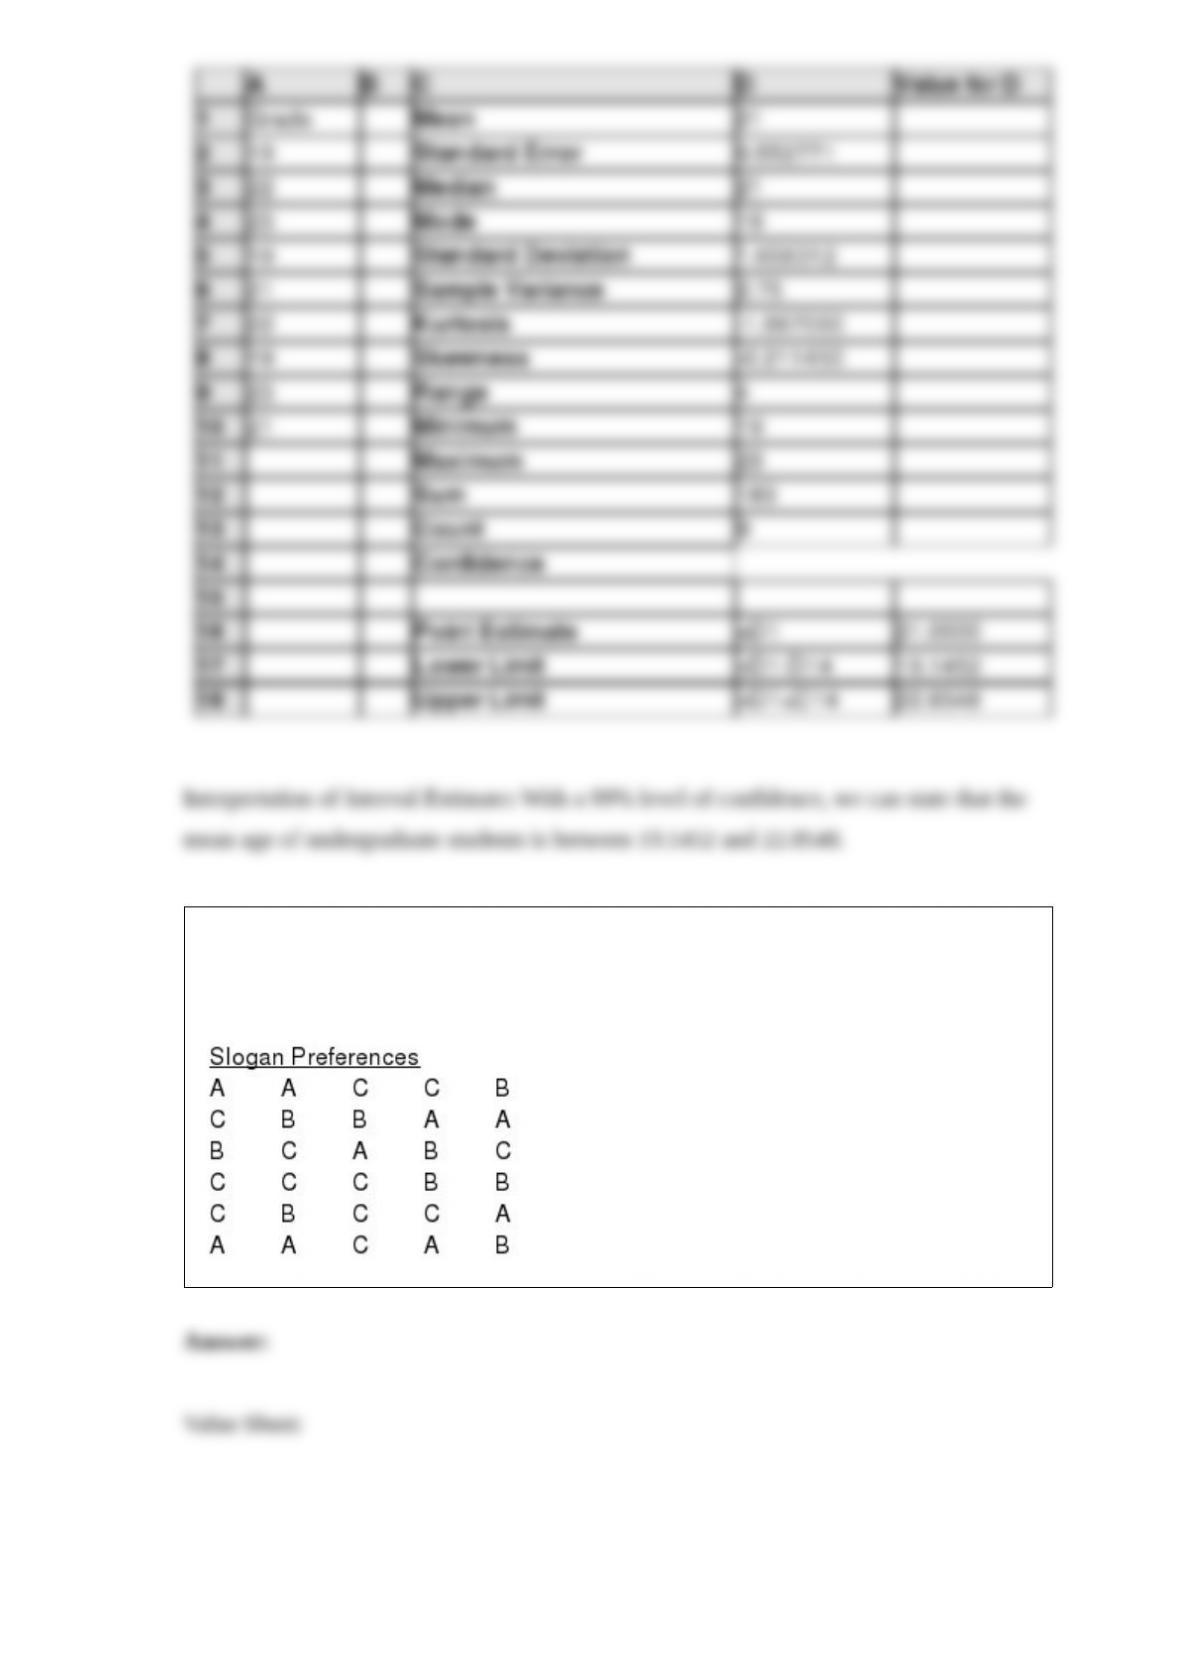
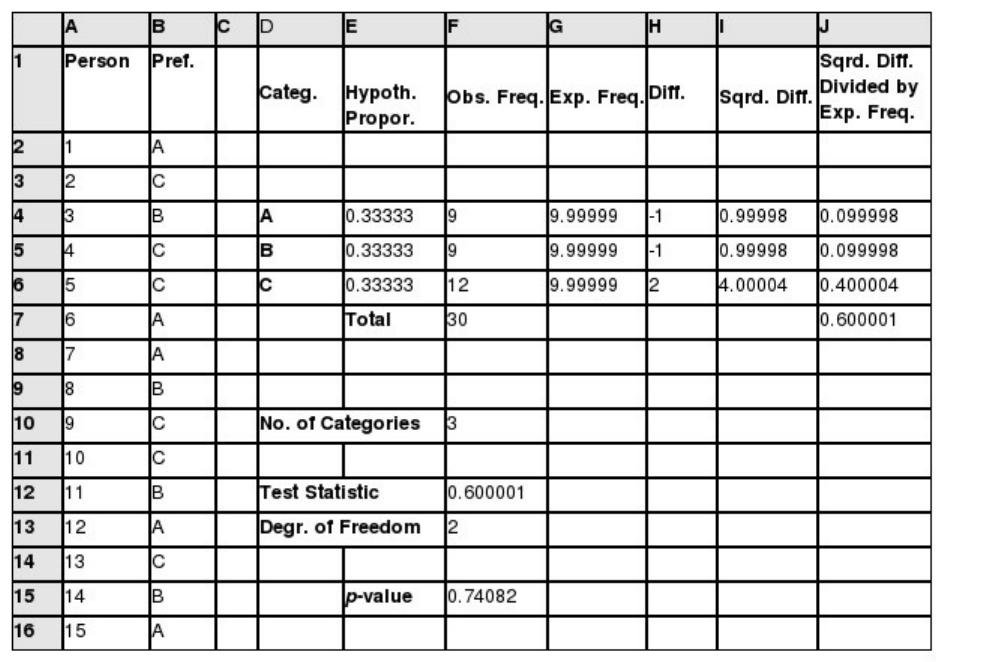
Members of a focus group stated their preferences between three possible slogans. The
results follow. Use Excel to test at = .05 to determine any difference in preference
among the three slogans.
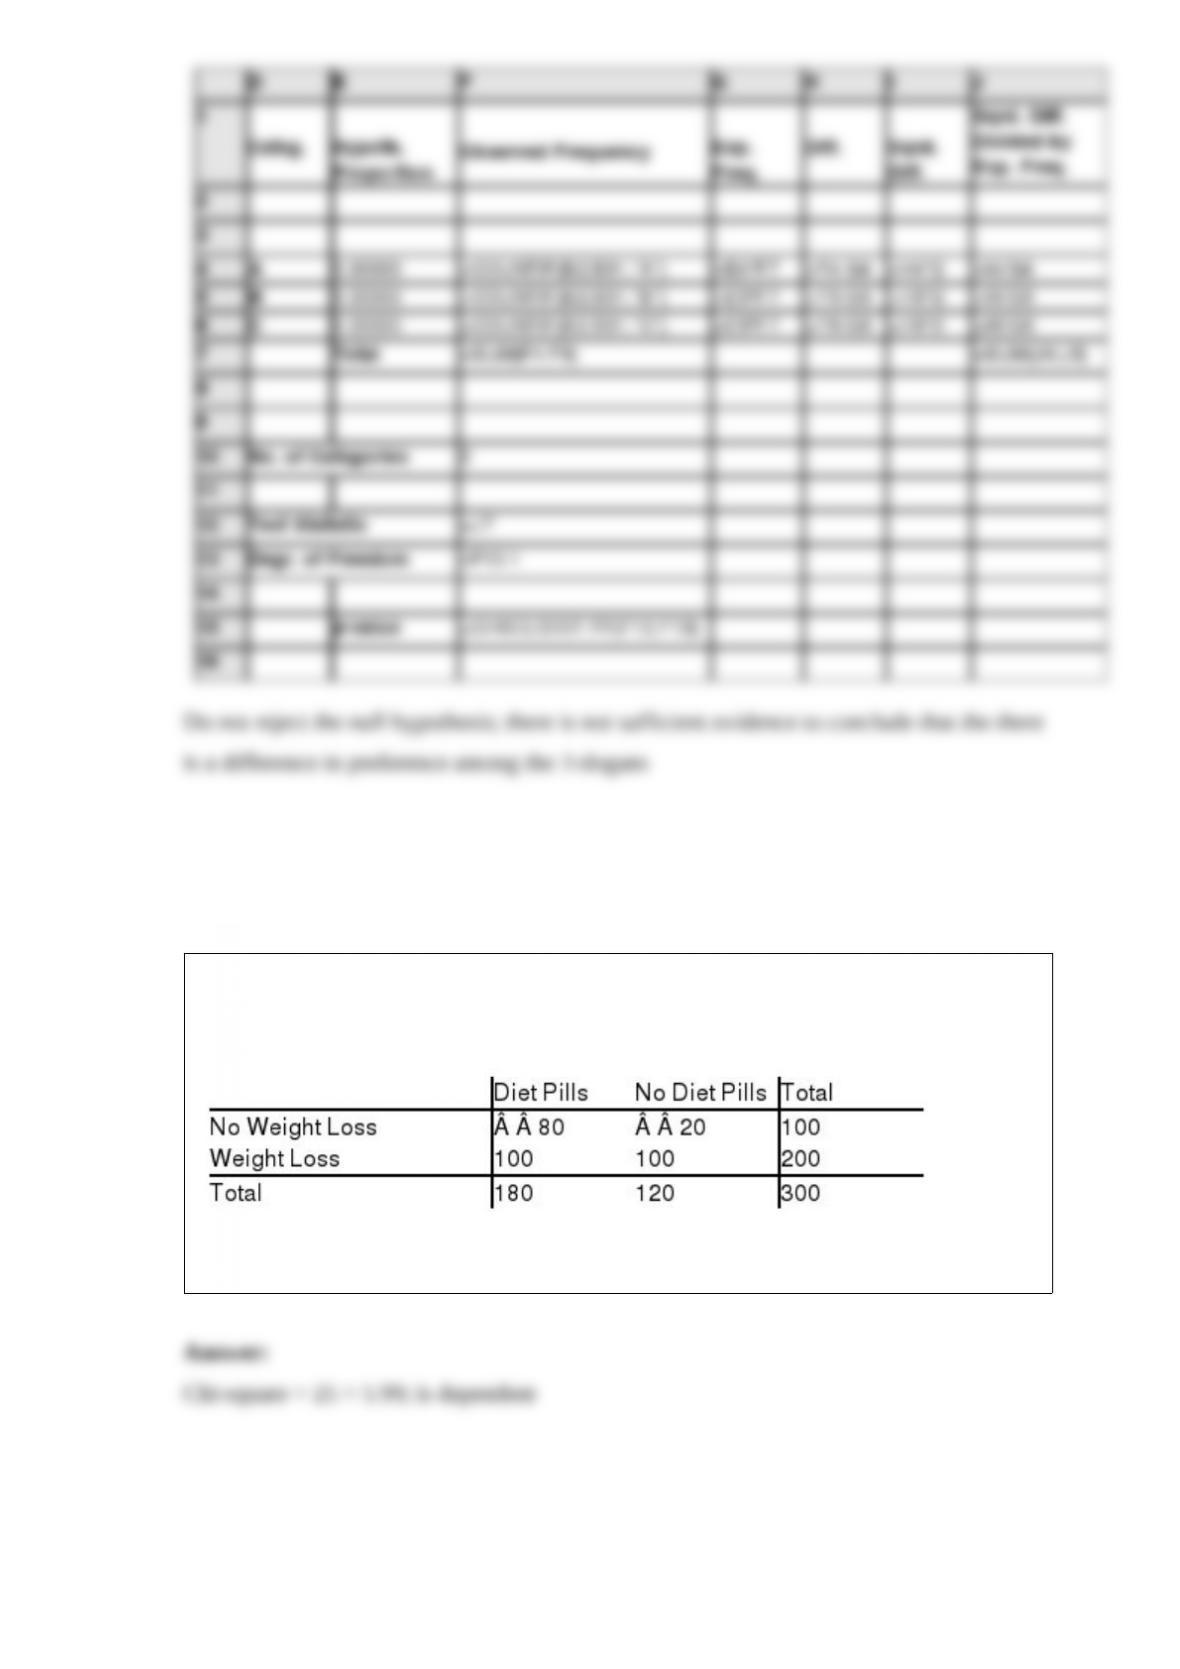
Dr. Ross’ diet pills are supposed to cause significant weight loss. The following table
shows the results of a recent study where some individuals took the diet pills and some
did not.
With 95% confidence, test to see if losing weight is dependent on taking the diet pills.