
Exhibit 20-5
Below you are given a payoff table involving three states of nature and three decision
alternatives.
The probability of occurrence of S1 is 0.2 and the probability of occurrence of S2 is 0.3.
Refer to Exhibit 20-5. The expected value of the best alternative is
a. 5.0
b. 6.5
c. 7.5
d. 9.0
If several frequency distributions are constructed from the same data set, the
distribution with the widest class width will have the
a. fewest classes
b. most classes
c. same number of classes as the other distributions since all are constructed from the
same data
d. None of the other answers are correct.

The numerical value of the standard deviation can never be
a. larger than the variance
b. zero
c. negative
d. all of these statements are correct
Generally, which one of the following is the least appropriate measure of central
tendency for a data set that contains outliers?
a. mean
b. median
c. 2nd quartile
d. 50th percentile
Exhibit 18-5
Forty-one individuals from a sample of 60 indicated they oppose legalized abortion. We
are interested in determining whether or not there is a significant difference between the
proportions of opponents and proponents of legalized abortion.
Refer to Exhibit 18-5. The null hypothesis that is being tested is
a. H0: = 5
b. H0: = 0.5
c. H0: p = 5

d. H0: p = 0.5
Compared to the confidence interval estimate for a particular value of y (in a linear
regression model), the interval estimate for an average value of y will be
a. narrower
b. wider
c. the same
d. Not enough information is given.
A newspaper wants to estimate the proportion of Americans who will vote for
Candidate A. A random sample of 1000 voters is taken. Of the 1000 respondents, 526
say that they will vote for Candidate A. Which Excel function would be used to
construct a confidence interval estimate?
a. NORM.S.INV
b. NORM.INV
c. T.INV
d. INT
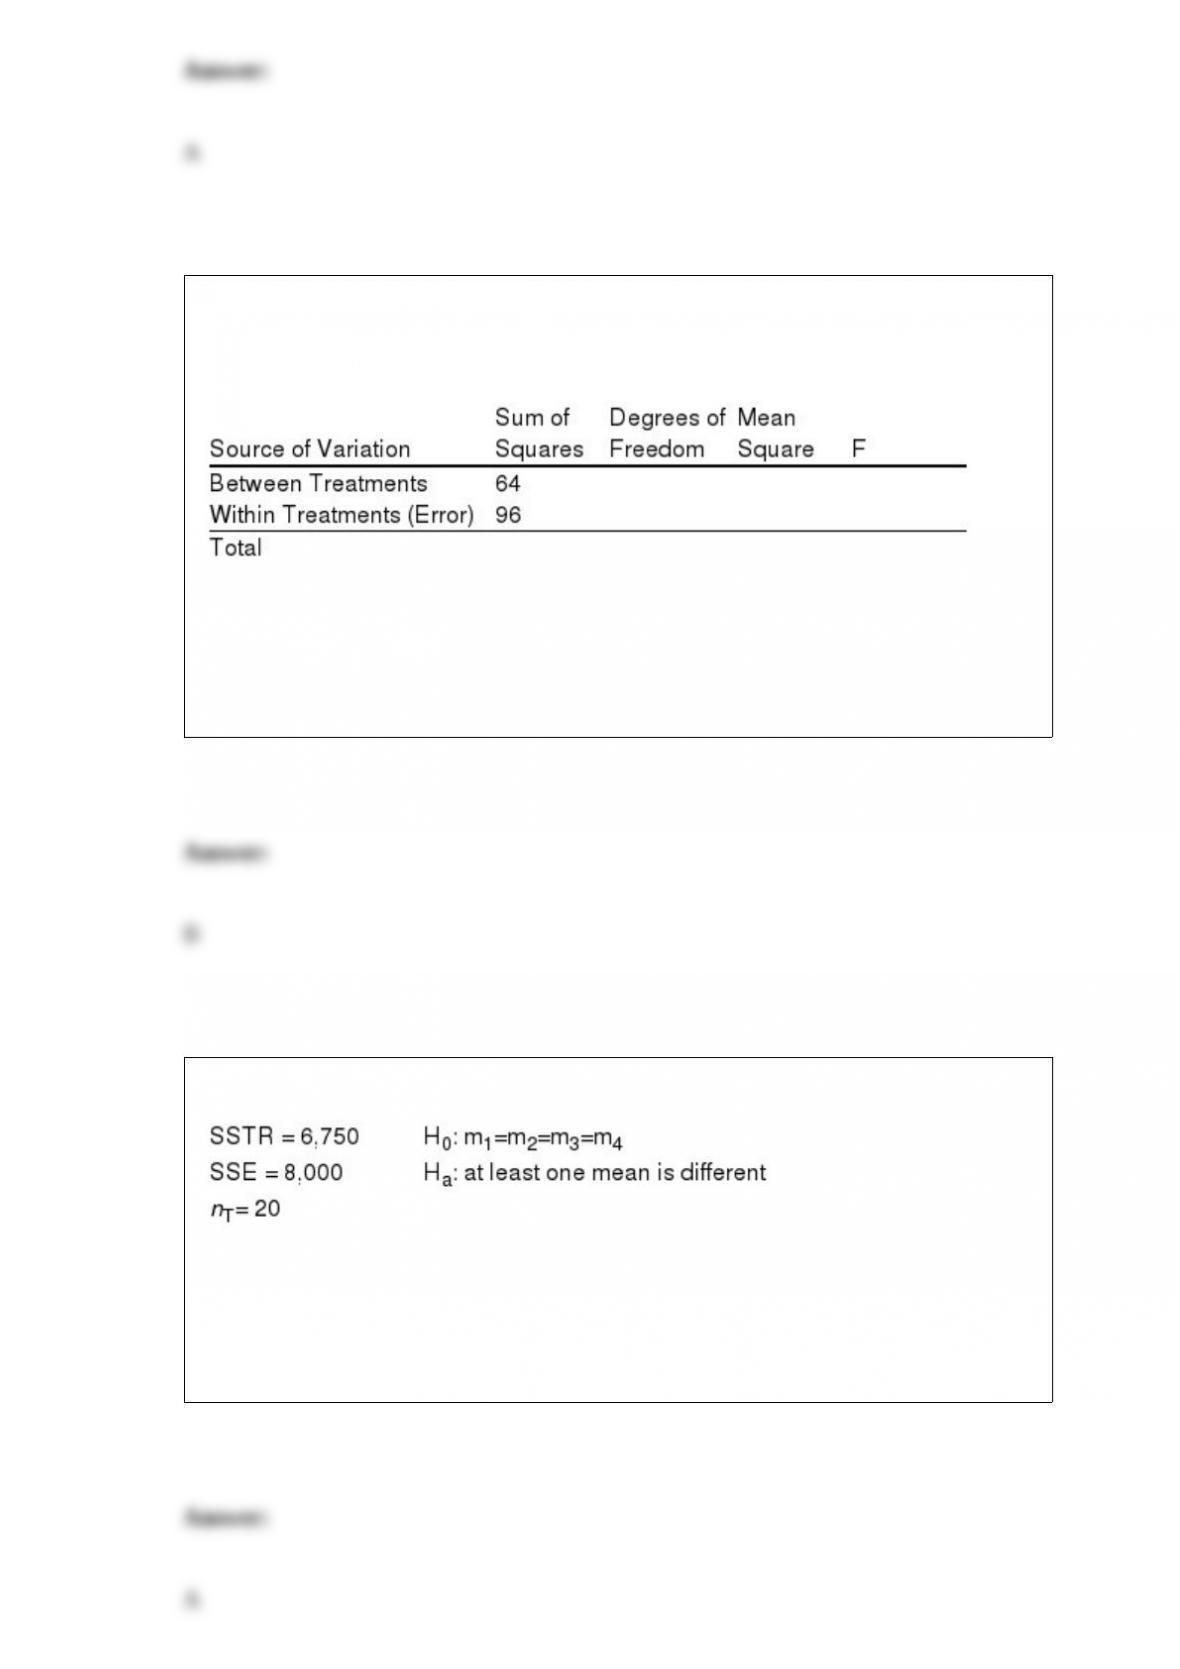
Exhibit 13-7
The following is part of an ANOVA table, which was the results of three treatments and
a total of 15 observations.
Refer to Exhibit 13-7. The conclusion of the test is that the means
a. are equal
b. may be equal
c. are not equal
d. None of these alternatives is correct.
Exhibit 13-1
Refer to Exhibit 13-1. The null hypothesis
a. should be rejected
b. should not be rejected
c. was designed incorrectly
d. None of these alternatives is correct.

The 90% confidence interval estimate for a population standard deviation when a
sample variance of 50 is obtained from a sample of 15 items is
a. 4.18 to 15.07
b. 5.18 to 11.15
c. 5.44 to 10.32
d. 29.55 to 106.53
Exhibit 12-4
In the past, 35% of the students at ABC University were in the Business College, 35%
of the students were in the Liberal Arts College, and 30% of the students were in the
Education College. To see whether or not the proportions have changed, a sample of
300 students was taken. Ninety of the sample students are in the Business College, 120
are in the Liberal Arts College, and 90 are in the Education College.
Refer to Exhibit 12-4. The calculated value for the test statistic equals
a. 0.01
b. 0.75
c. 4.29
d. 4.38
In simple linear regression, r2 is the
a. estimated regression equation
b. coefficient of correlation
c. sum of the squared residuals
d. coefficient of determination
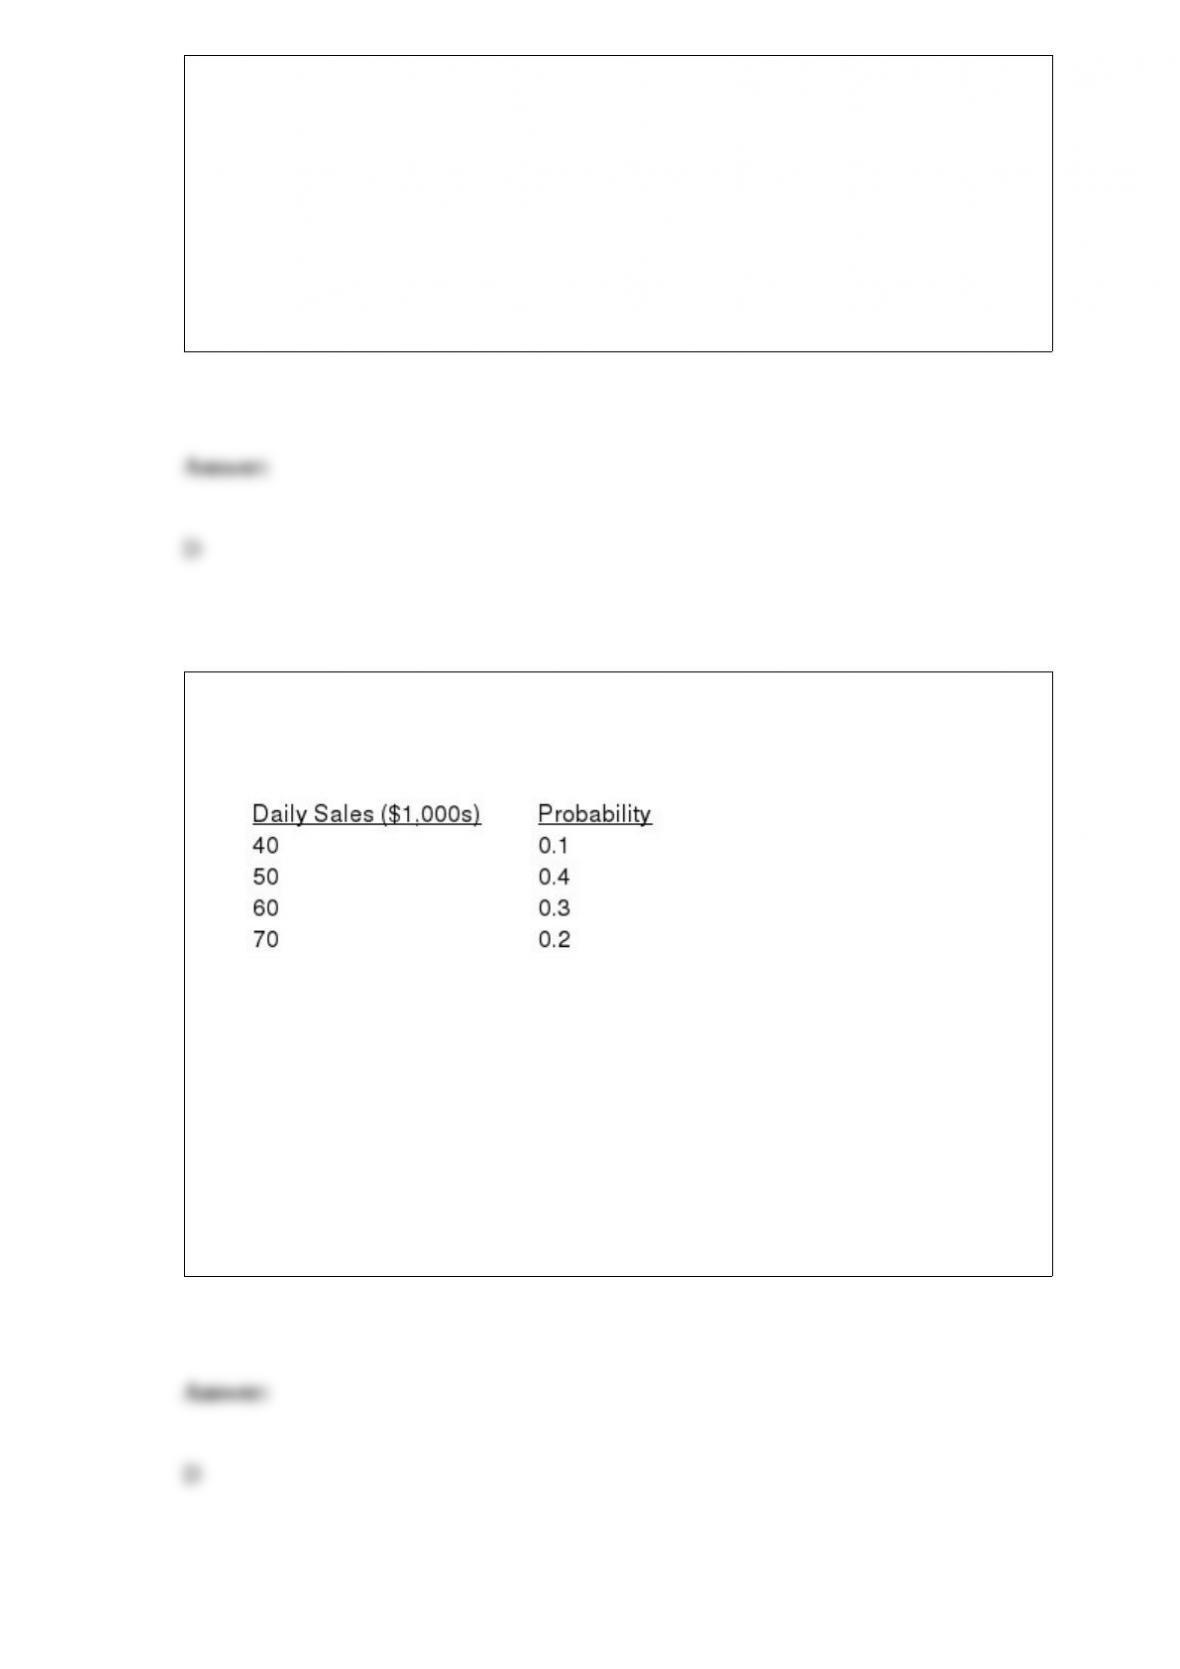
Exhibit 5-2
The probability distribution for the daily sales at Michael’s Co. is given below.
Refer to Exhibit 5-2. The probability of having sales of at least $50,000 is
a. 0.5
b. 0.10
c. 0.30
d. 0.90
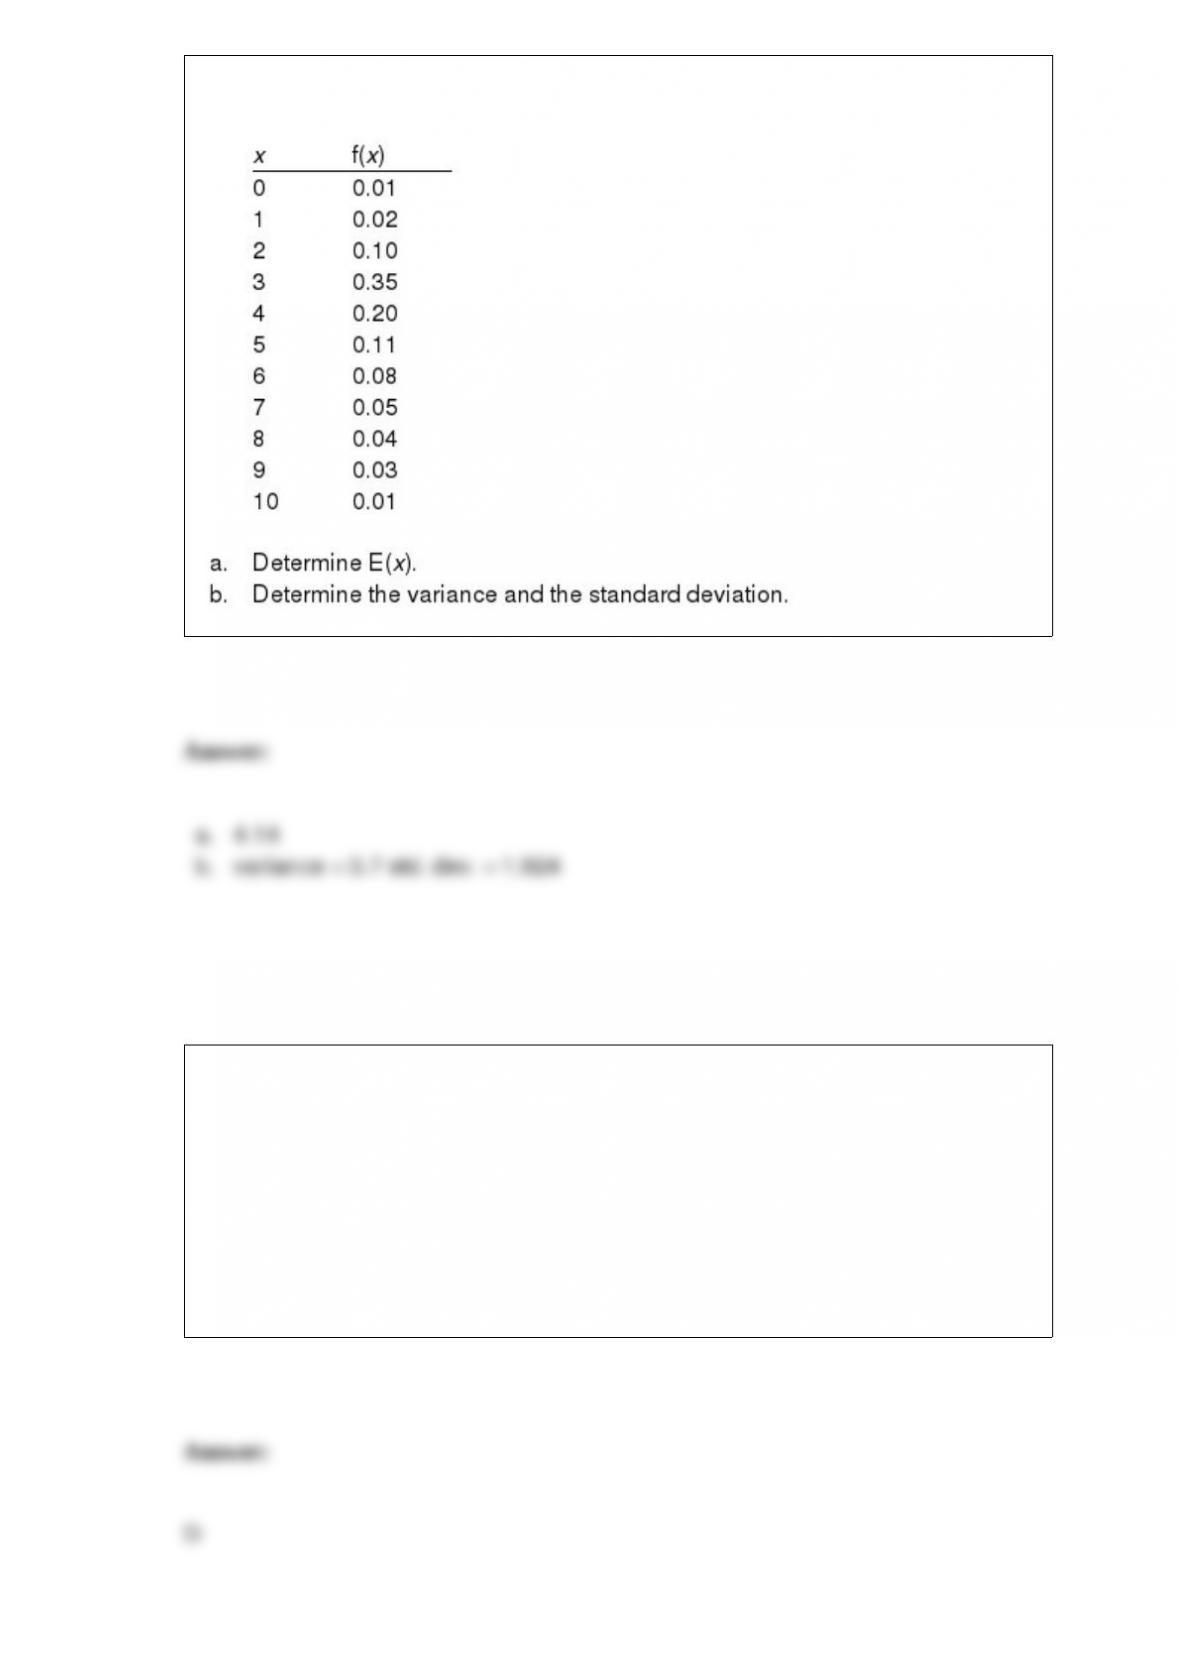
For the following probability distribution:
A variable that cannot be measured in numerical terms is called
a. a nonmeasurable random variable
b. a constant variable
c. a dependent variable
d. a qualitative variable
In a questionnaire, respondents are asked to record their age in years. Age is an example
of a
a. categorical variable
b. quantitative variable
c. categorical or quantitative variable, depending on how the respondents answered the
question
d. ratio variable
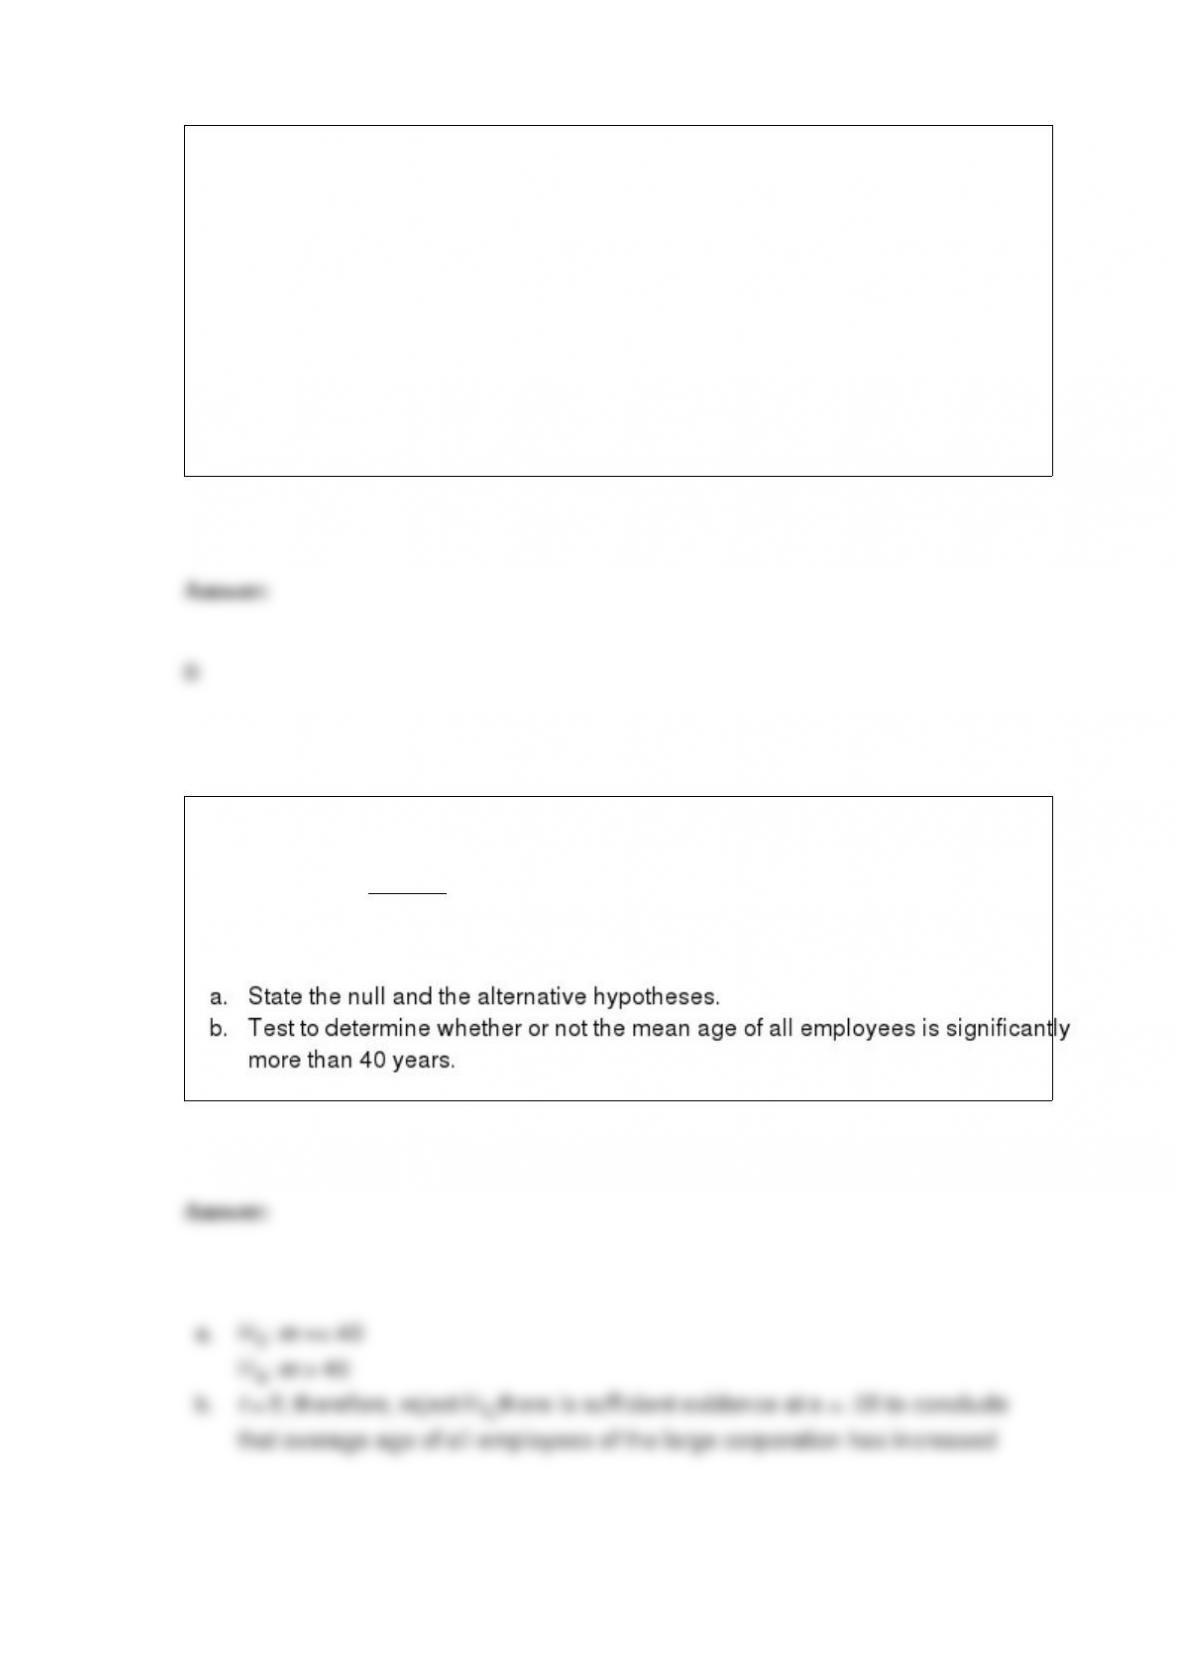
In the past the average age of employees of a large corporation has been 40 years.
Recently, the company has been hiring older individuals. In order to determine whether
there has been an increase in the average age of all the employees, a sample of 25
employees was selected. The average age in the sample was 45 years with a standard
deviation of 5 years. Assume the distribution of the population is normal. Let .05.
Assume you are taking two courses this semester (A and B). Based on your opinion,
you believe the probability that you will pass course A is 0.835; the probability that you
will pass both courses is 0.276. You further believe the probability that you will pass at
least one of the courses is 0.981.
a. What is the probability that you will pass course B?
b. Is the passing of the two courses independent events? Use probability information to
justify your answer.
c. Are the events of passing the courses mutually exclusive? Explain.
d. What method of assigning probabilities did you use?
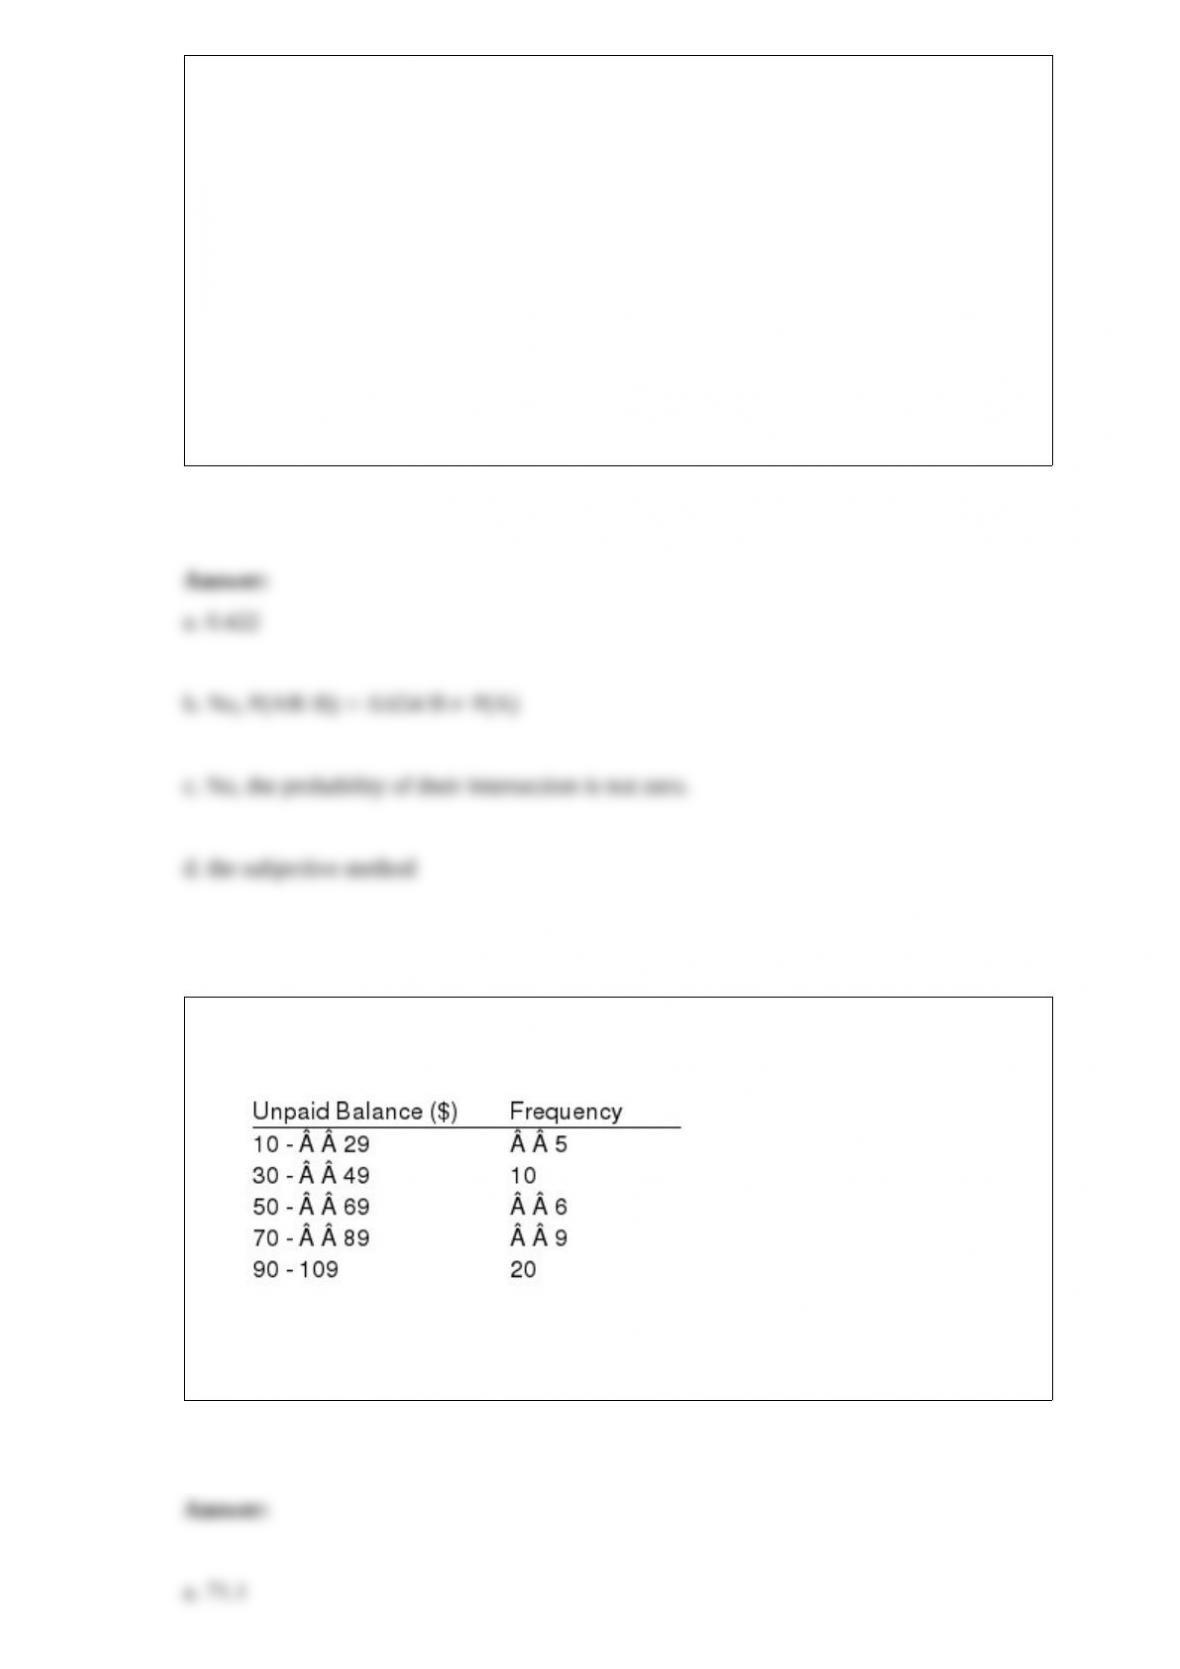
A sample of charge accounts at a local drug store revealed the following frequency
distribution of unpaid balances.
a. Determine the mean unpaid balance.
b. Determine the standard deviation.
c. Compute the coefficient of variation.

In testing the null hypothesis H0:
1 ‘“
2 = 0, the computed test statistic is z = -1.66.
The corresponding p-value is
a. .0485
b. .0970
c. .9515
d. .9030
June’s Specialty Shop sells designer original dresses. On 10% of her dresses, June
makes a profit of $10, on 20% of her dresses she makes a profit of $20, on 30% of her
dresses she makes a profit of $30, and on 40% of her dresses she makes a profit of $40.
On a given day, the probability of June having no customers is .05, of one customer is .
10, of two customers is .20, of three customers is .35, of four customers is .20, and of
five customers is .10.
a. What is the expected profit June earns on the sale of a dress?
b. June’s daily operating cost is $40 per day. Find the expected net profit June earns per
day. (Hint: To find the expected daily gross profit, multiply the expected profit per dress
by the expected number of customers per day.)
c. June is considering moving to a larger store. She estimates that doing so will double
the expected number of customers. If the larger store will increase her operating costs to
$100 per day, should she make the move?

A data point (observation) that does not fit the trend shown by the remaining data is
called a (an)
a. residual
b. outlier
c. point estimate
d. None of the other answers is correct.
In a crosstabulation
a. both variables must be categorical
b. both variables must be quantitative
c. one variable must be categorical and the other must be quantitative
d. either or both variables can be categorical or quantitative
Z is a standard normal random variable. Compute the following probabilities.

a. P(-1.23 z 2.58)
b. P(1.83 z 1.96)
c. P(z 1.32)
d. P(z 2.52)
e. P(z -1.63)
f. P(z -1.38)
g. P(-2.37 z -1.54)
h. P(z 2.56)