
Exhibit 15-1
In a regression model involving 44 observations, the following estimated regression
equation was obtained.
= 29 + 18x1 +43x2 + 87x3
For this model SSR = 600 and SSE = 400.
Refer to Exhibit 15-1. The computed F statistics for testing the significance of the
above model is
a. 1.500
b. 20.00
c. 0.600
d. 0.6667
A variable that takes on the values of 0 or 1 and is used to incorporate the effect of
qualitative variables in a regression model is called
a. an interaction
b. a constant variable
c. a dummy variable
d. None of these alternatives is correct.
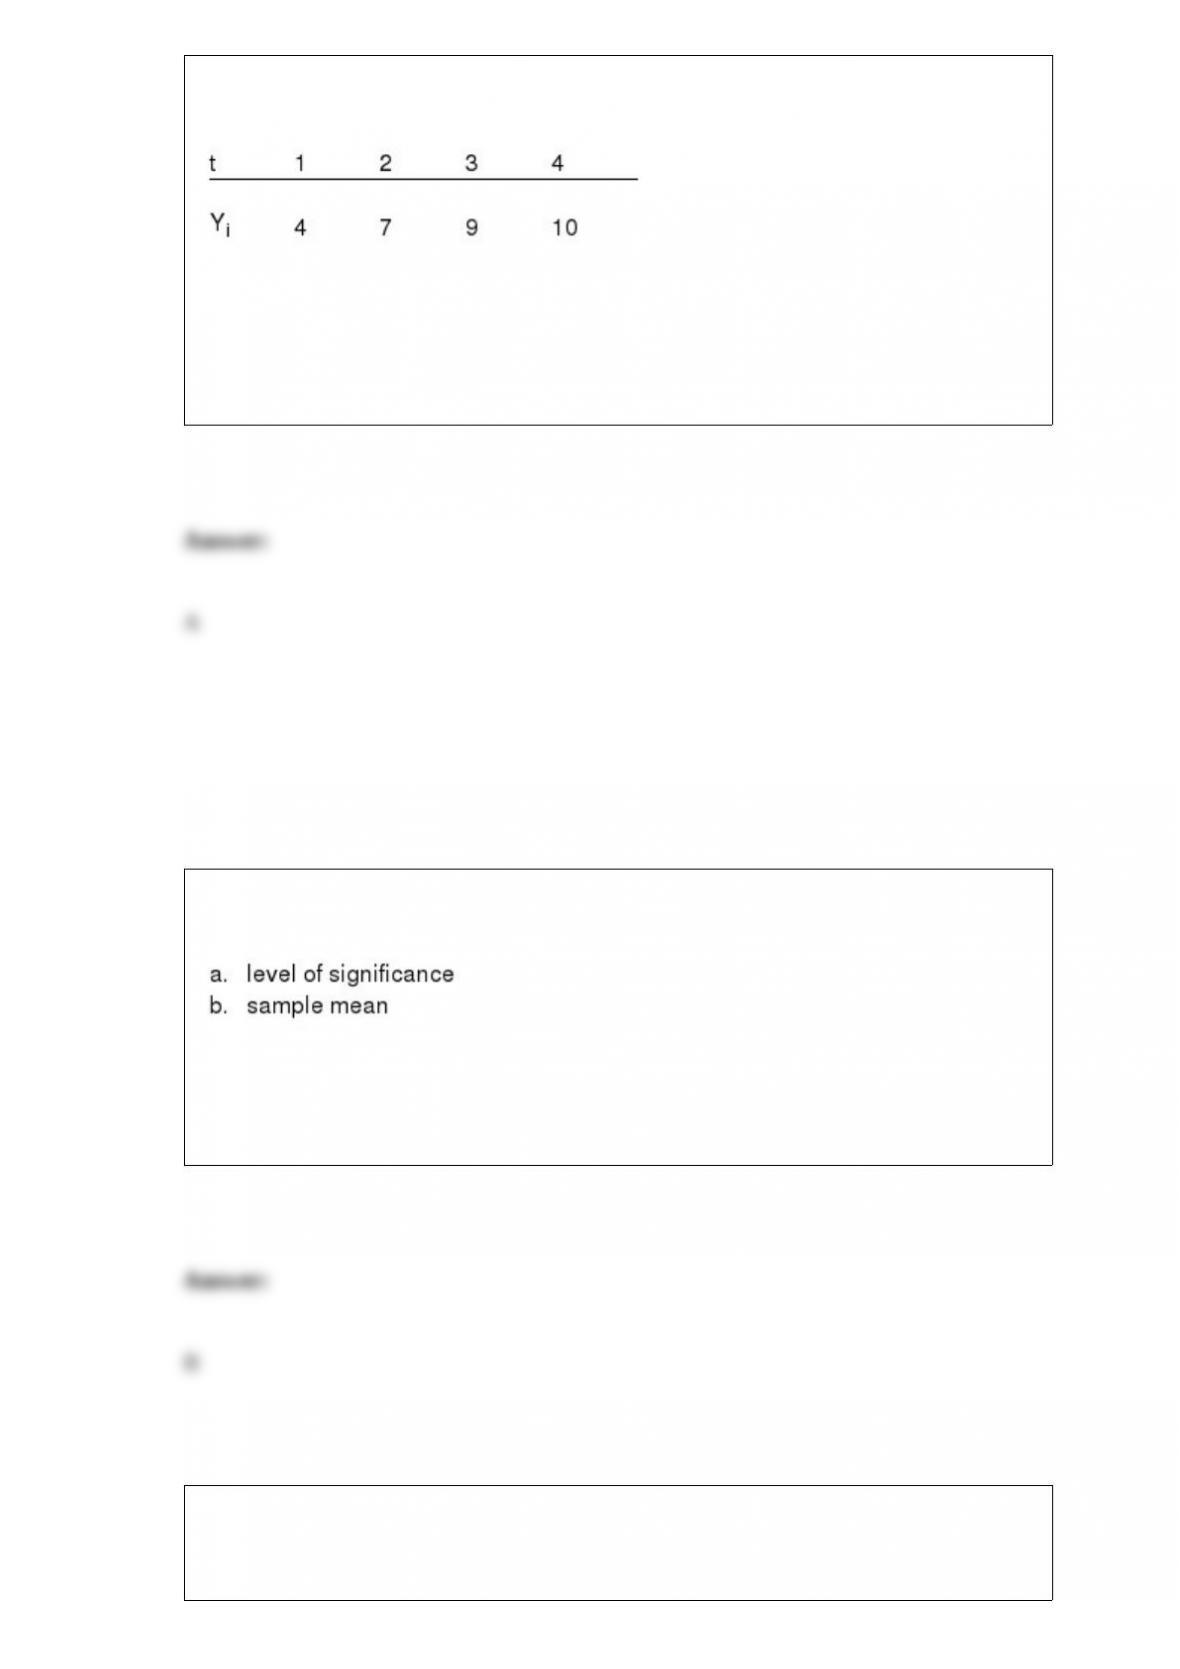
Exhibit 17-2
Consider the following time series.
Refer to Exhibit 17-2. The intercept, b0, is
a. 2.5
b. 2.0
c. 1.0
d. 1.25
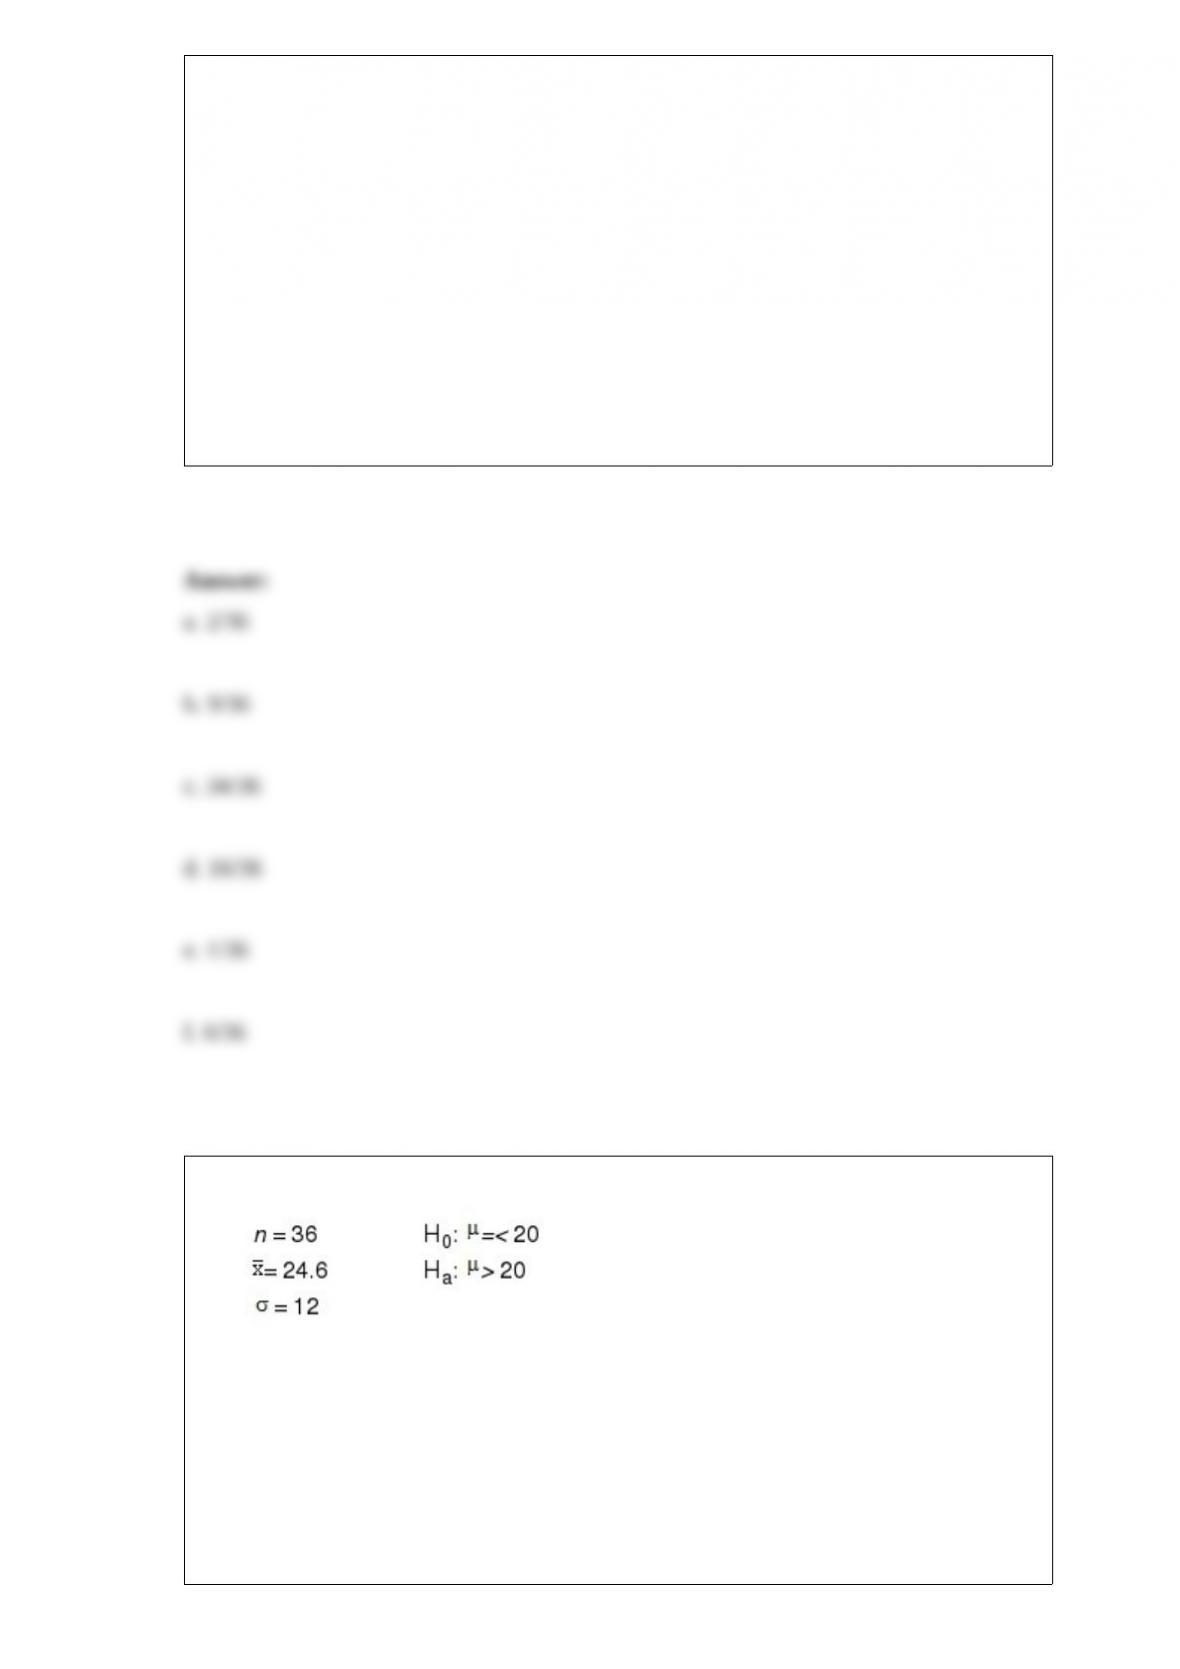
The margin of error in an interval estimate of the population mean is a function of all of
the following except
c. sample size
d. variability of the population
A version of cluster sampling in which the elements are formed into clusters on the
basis of their geographic proximity is

a. stratified simple random sampling
b. random sampling
c. judgment sampling
d. area sampling
Exhibit 11-2
We are interested in determining whether or not the variances of the sales at two music
stores (A and B) are equal. A sample of 25 days of sales at store A has a sample
standard deviation of 30 while a sample of 16 days of sales from store B has a sample
standard deviation of 20.
Refer to Exhibit 11-2. At 95% confidence the null hypothesis
a. should be rejected
b. should not be rejected
c. should be revised
d. None of these alternatives is correct.
A polling organization conducts a telephone poll of 850 registered voters and asks
which candidate they will vote for in the upcoming presidential election. Forty-three
percent of the respondents prefer candidate A and 45% prefer candidate B.
a. What is the population being studied?

b. What is the sample being studied?
c. Based on the sample, what percentage of the population do you think would vote for
candidate B?
A mean computed in such a way that each data value is given a weight reflecting its
importance is referred to as
a. an important mean
b. a trimmed mean
c. a weighted mean
d. a heavy mean
The purpose of statistical inference is to provide information about the
a. sample based upon information contained in the population
b. population based upon information contained in the sample
c. population based upon information contained in the population
d. mean of the sample based upon the mean of the population
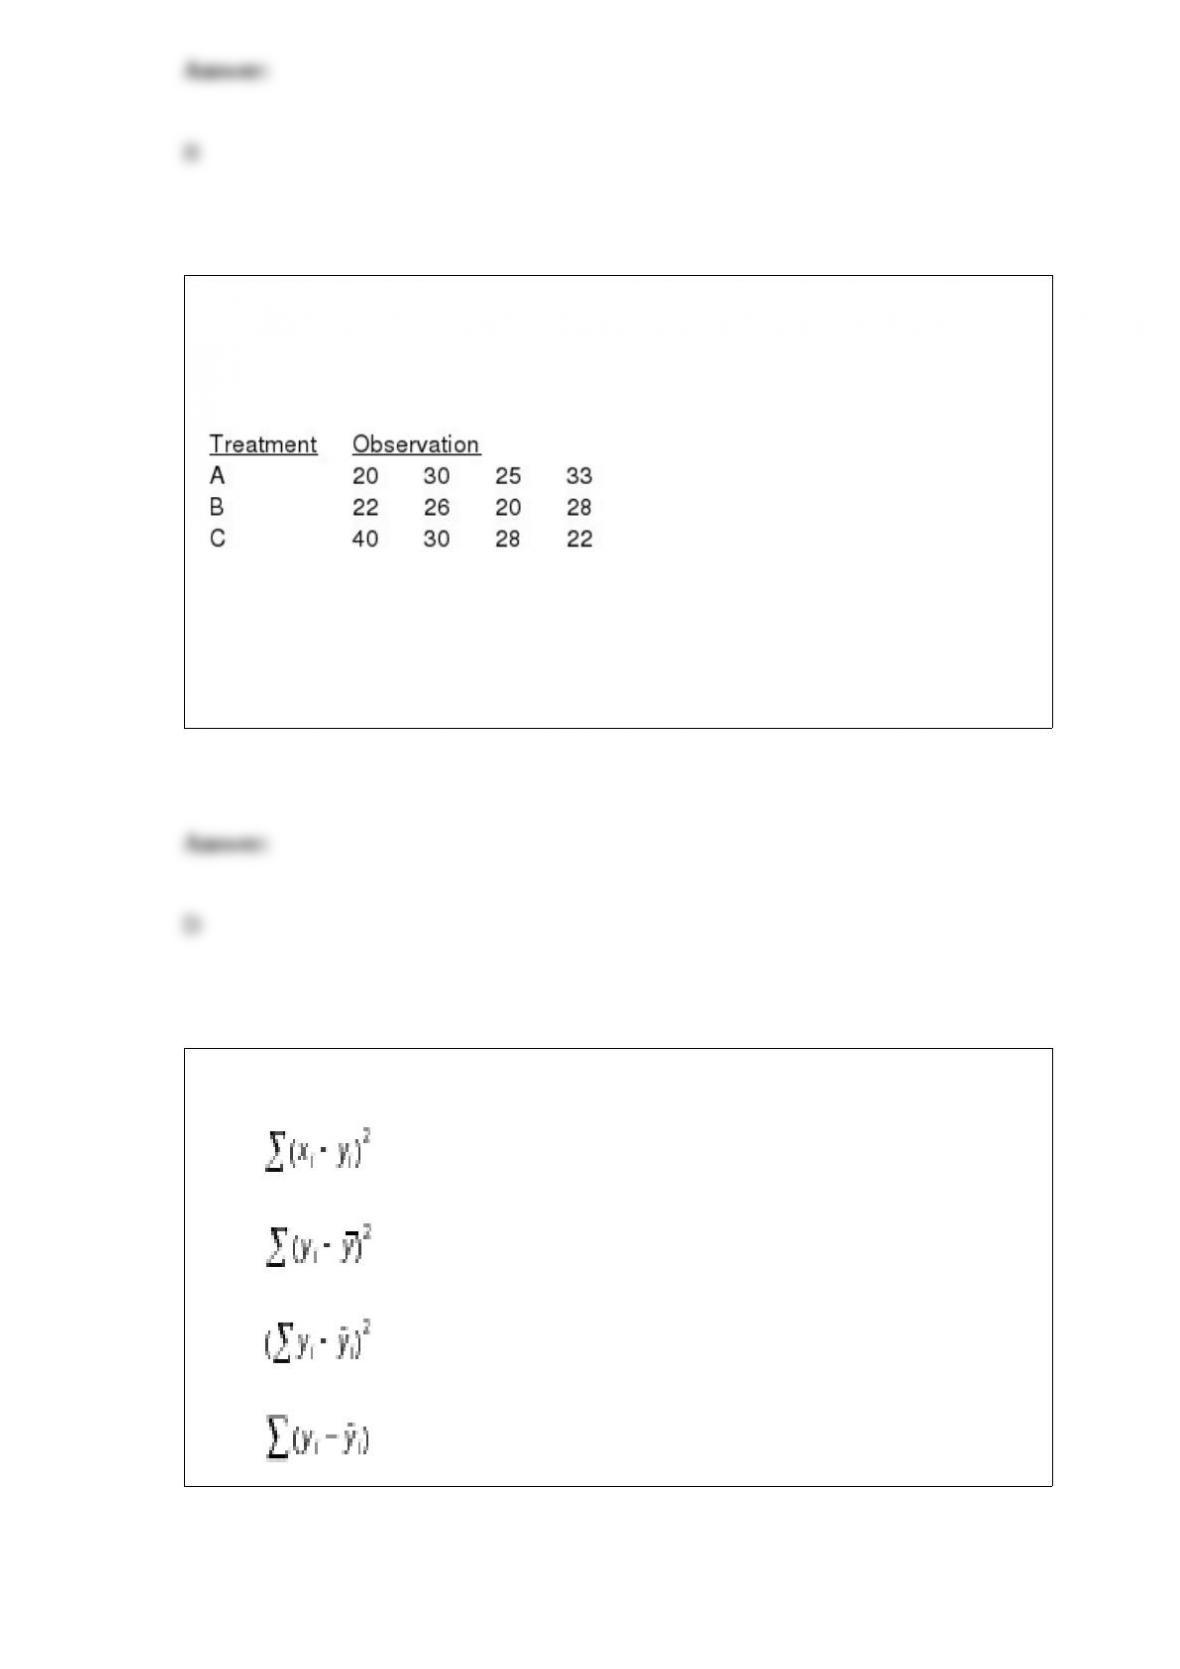
Exhibit 13-3
To test whether or not there is a difference between treatments A, B, and C, a sample of
12 observations has been randomly assigned to the 3 treatments. You are given the
results below.
Refer to Exhibit 13-3. The mean square between treatments (MSTR) equals
a. 1.872
b. 5.86
c. 34
d. 36
The least squares criterion is
a. min
b. min
c. min
d. min

The value of F.05 with 8 numerator and 19 denominator degrees of freedom is
a. 2.48
b. 2.58
c. 3.63
d. 2.96
An applicant has applied for positions at Company A and Company B. The probability
of getting an offer from Company A is 0.4, and the probability of getting an offer from
Company B is 0.3. Assuming that the two job offers are independent of each other, what
is the probability that
a. the applicant gets an offer from both companies?
b. the applicant will get at least one offer?
c. the applicant will not be given an offer from either company?
d. Company A does not offer the applicant a job, but Company B does?
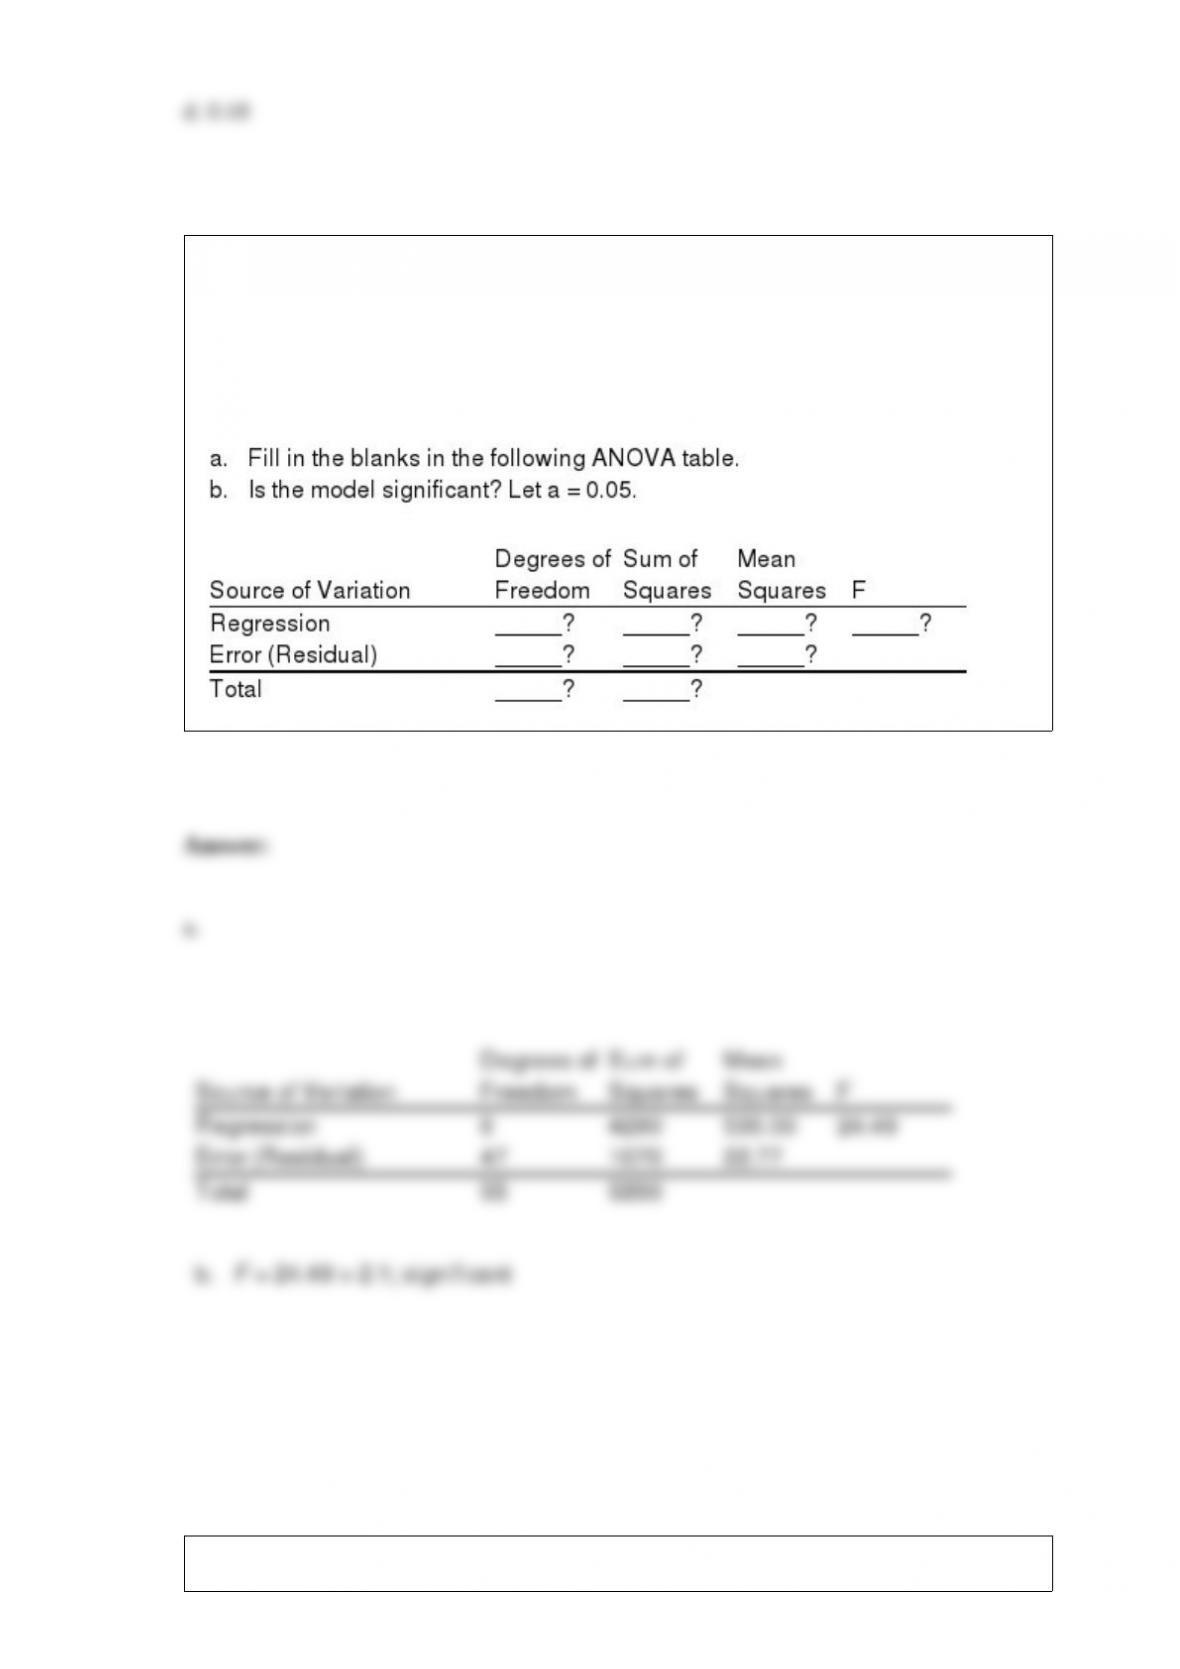
A regression analysis was applied in order to determine the relationship between a
dependent variable and 8 independent variables. The following information was
obtained from the regression analysis.
R Square = 0.80
SSR = 4,280
Total number of observations n = 56
An experiment consists of throwing two six-sided dice and observing the number of
spots on the upper faces. Determine the probability that
a. the sum of the spots is 3
b. each die shows four or more spots.
c. the sum of the spots is not 3
d. neither a one nor a six appear on each die.
e. a pair of sixes appears.
f. the sum of the spots is 7
Exhibit 9-1
Refer to Exhibit 9-1. If the test is done at a .05 level of significance, the null hypothesis
should
a. not be rejected
b. be rejected

c. Not enough information is given to answer this question.
d. None of the other answers are correct.
Exhibit 7-4
A random sample of 121 bottles of cologne showed an average content of 4 ounces. It is
known that the standard deviation of the contents (i.e., of the population) is 0.22
ounces.
Refer to Exhibit 7-4. The standard error of the mean equals
a. 0.3636
b. 0.0331
c. 0.0200
d. 4.000
Juran proposed a simple definition of quality:
a. customer satisfaction
b. conformance to specifications
c. fitness for use
d. commitment to excellence
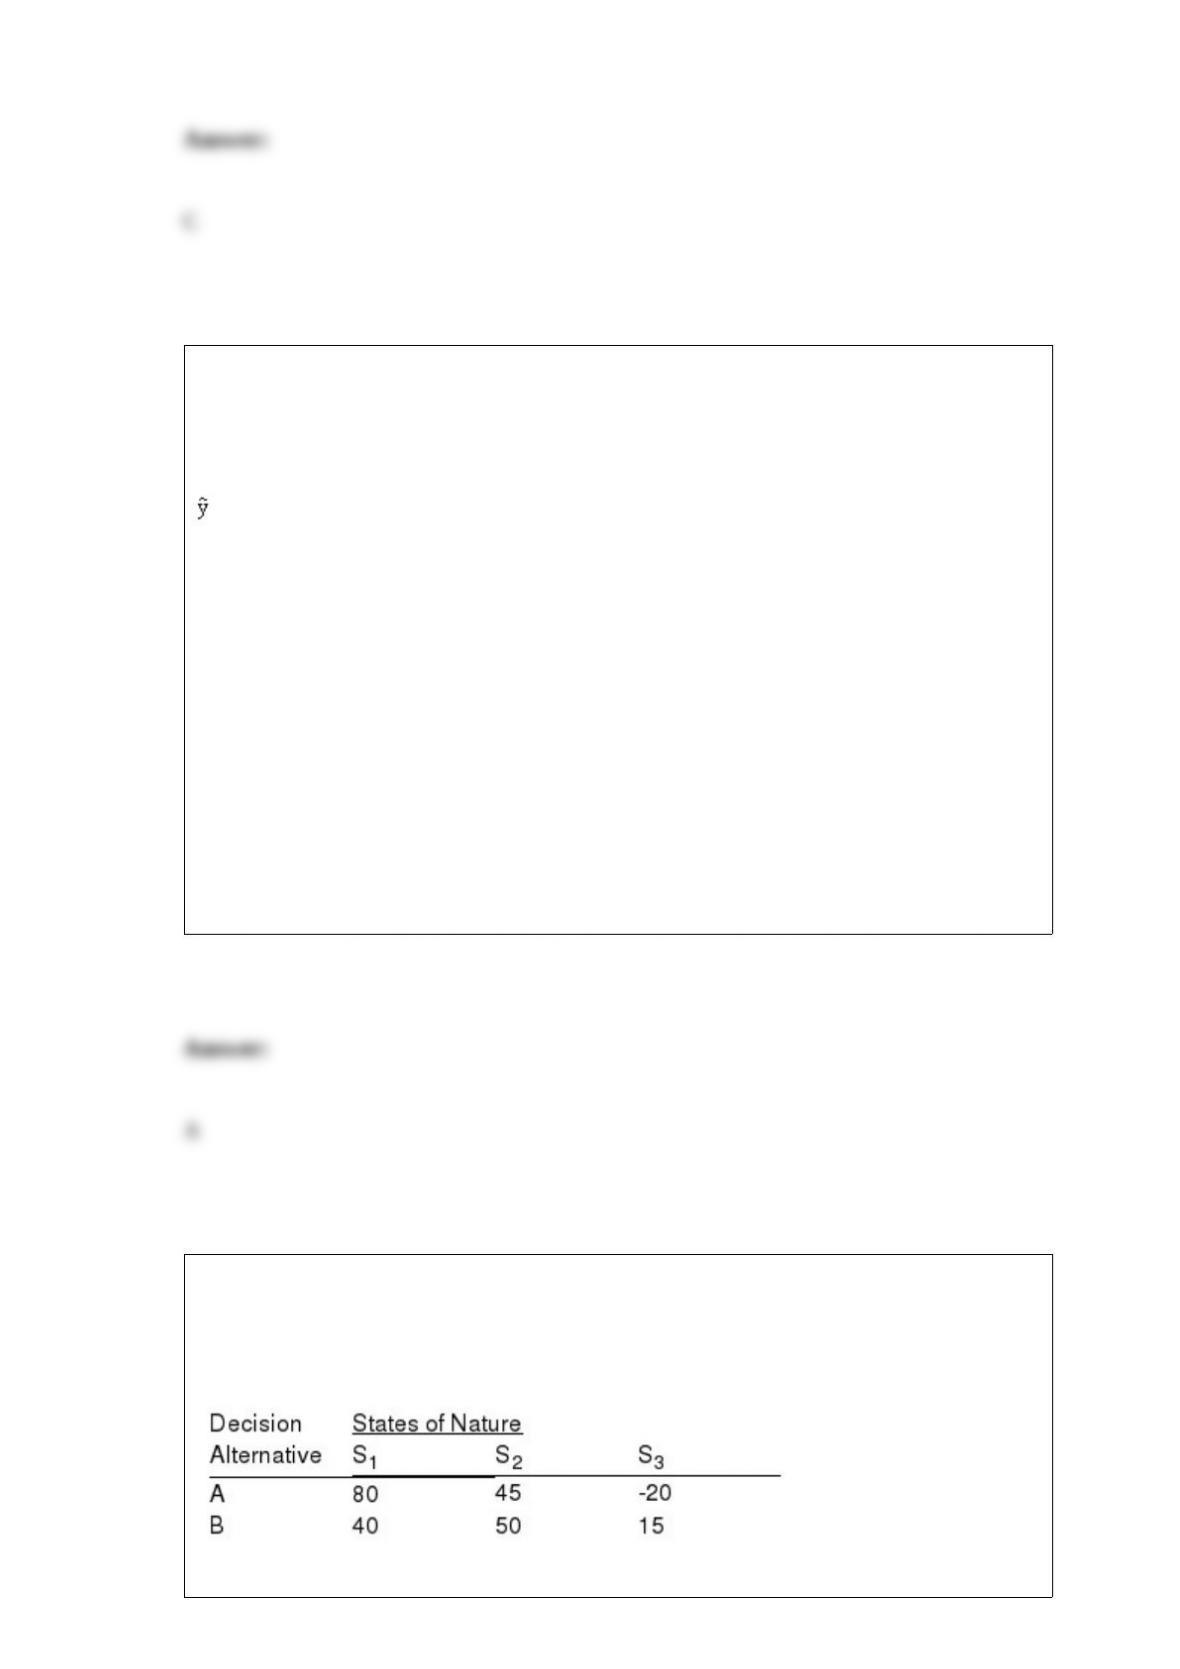
Exhibit 15-2
A regression model between sales (y in $1,000), unit price (x1 in dollars) and television
advertisement (x2 in dollars) resulted in the following function:
= 7 – 3x1 + 5x2
For this model SSR = 3500, SSE = 1500, and the sample size is 18.
Refer to Exhibit 15-2. If we want to test for the significance of the regression model,
the critical value of F at 95% confidence is
a. 3.68
b. 3.29
c. 3.24
d. 4.54
Exhibit 20-2
Below you are given a payoff table involving three states of nature and two decision
alternatives.

The probability that S1 will occur is 0.1; the probability that S2 will occur is 0.6; and
the probability that S3 will occur is 0.3.
Refer to Exhibit 20-2. The expected value of the best alternative equals
a. 29
b. 105
c. 12
d. 38.5
The assembly time for a product is uniformly distributed between 6 to 10 minutes. The
probability of assembling the product in less than 6 minutes is
a. zero
b. 0.50
c. 0.15
d. 1
Statistical studies in which researchers control variables of interest are
a. experimental studies
b. control observational studies

c. non experimental studies
d. observational studies
Exhibit 7-2
Four hundred registered voters were randomly selected asked whether gun laws should
be changed. Three hundred said “yes,” and one hundred said “no.”
Refer to Exhibit 7-2. The point estimate of the proportion in the population who will
respond “no” is
a. 75
b. 0.25
c. 0.75
d. 0.50
Z is a standard normal random variable. The P(-1.5 z 1.09) equals
a. 0.4322
b. 0.3621
c. 0.7953
d. 0.0711