
An intersection or junction point of a decision tree is called a (n)
a. junction
b. intersection
c. intersection point
d. node
A movie based on a best-selling novel was recently released. Six hundred viewers of the
movie, 235 of whom had previously read the novel, were asked to rate the quality of the
movie. The survey showed that 141 of the novel readers gave the movie a rating of
excellent, while 248 of the non-readers gave the movie an excellent rating.
a. Develop an interval estimate of the difference between the proportions of the two
populations, using a .05 level of significance, as the basis for your decision.
b. Can we conclude, on the basis of a hypothesis test about p1 ‘“ p2, that the proportion
of the non-readers of the novel who thought the movie was excellent is greater than the
proportion of readers of the novel who thought the movie was excellent? Use a .05 level
of significance. (Hint: this is a one-tailed test.)
Assume you have a sum of money available that you would like to invest in one of the
three available investment plans: stocks, bonds, or money market. The conditional
payoffs of each plan under two possible economic conditions are shown below. The
probability of the occurrence of economic condition I is 0.28.
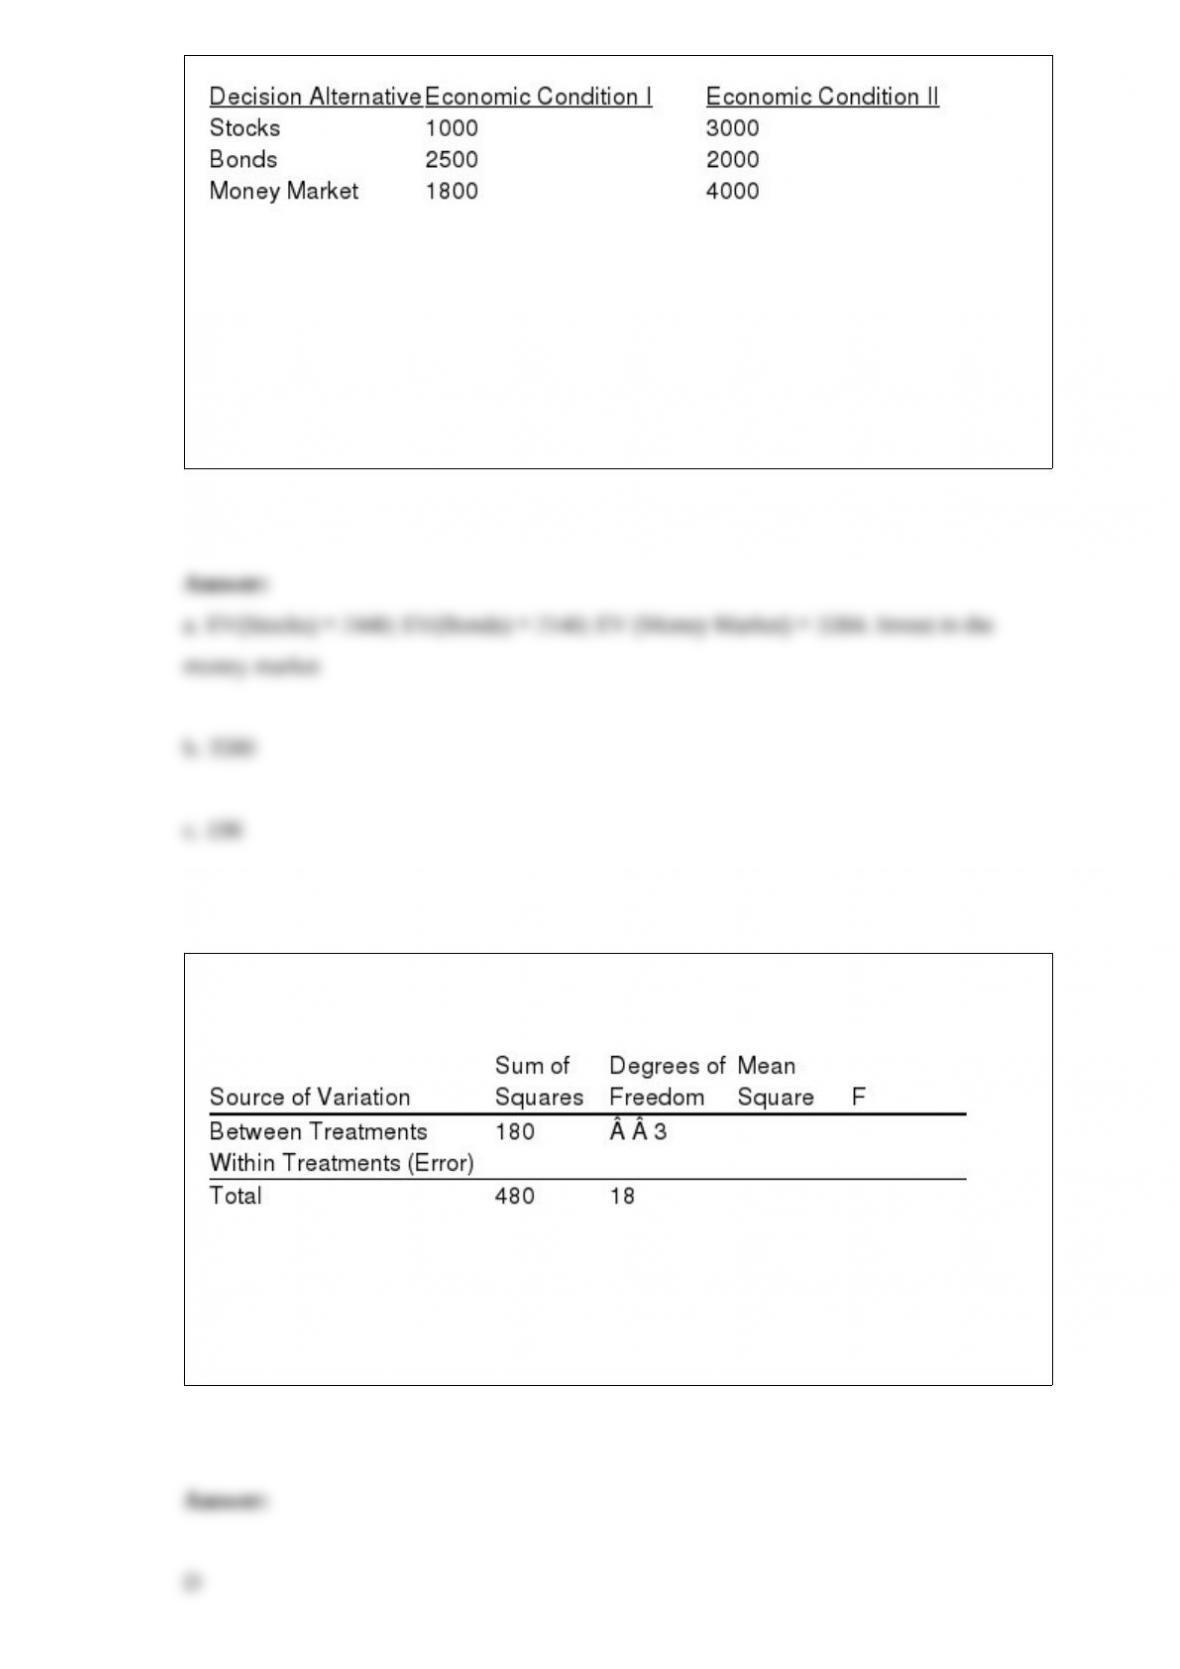
a. Compute the expected value of the three investment options. Which investment
option would you select, based on the expected values?
b. Compute the expected value with perfect information (i.e., expected value under
certainty).
c. Compute the expected value of perfect information (EVPI).
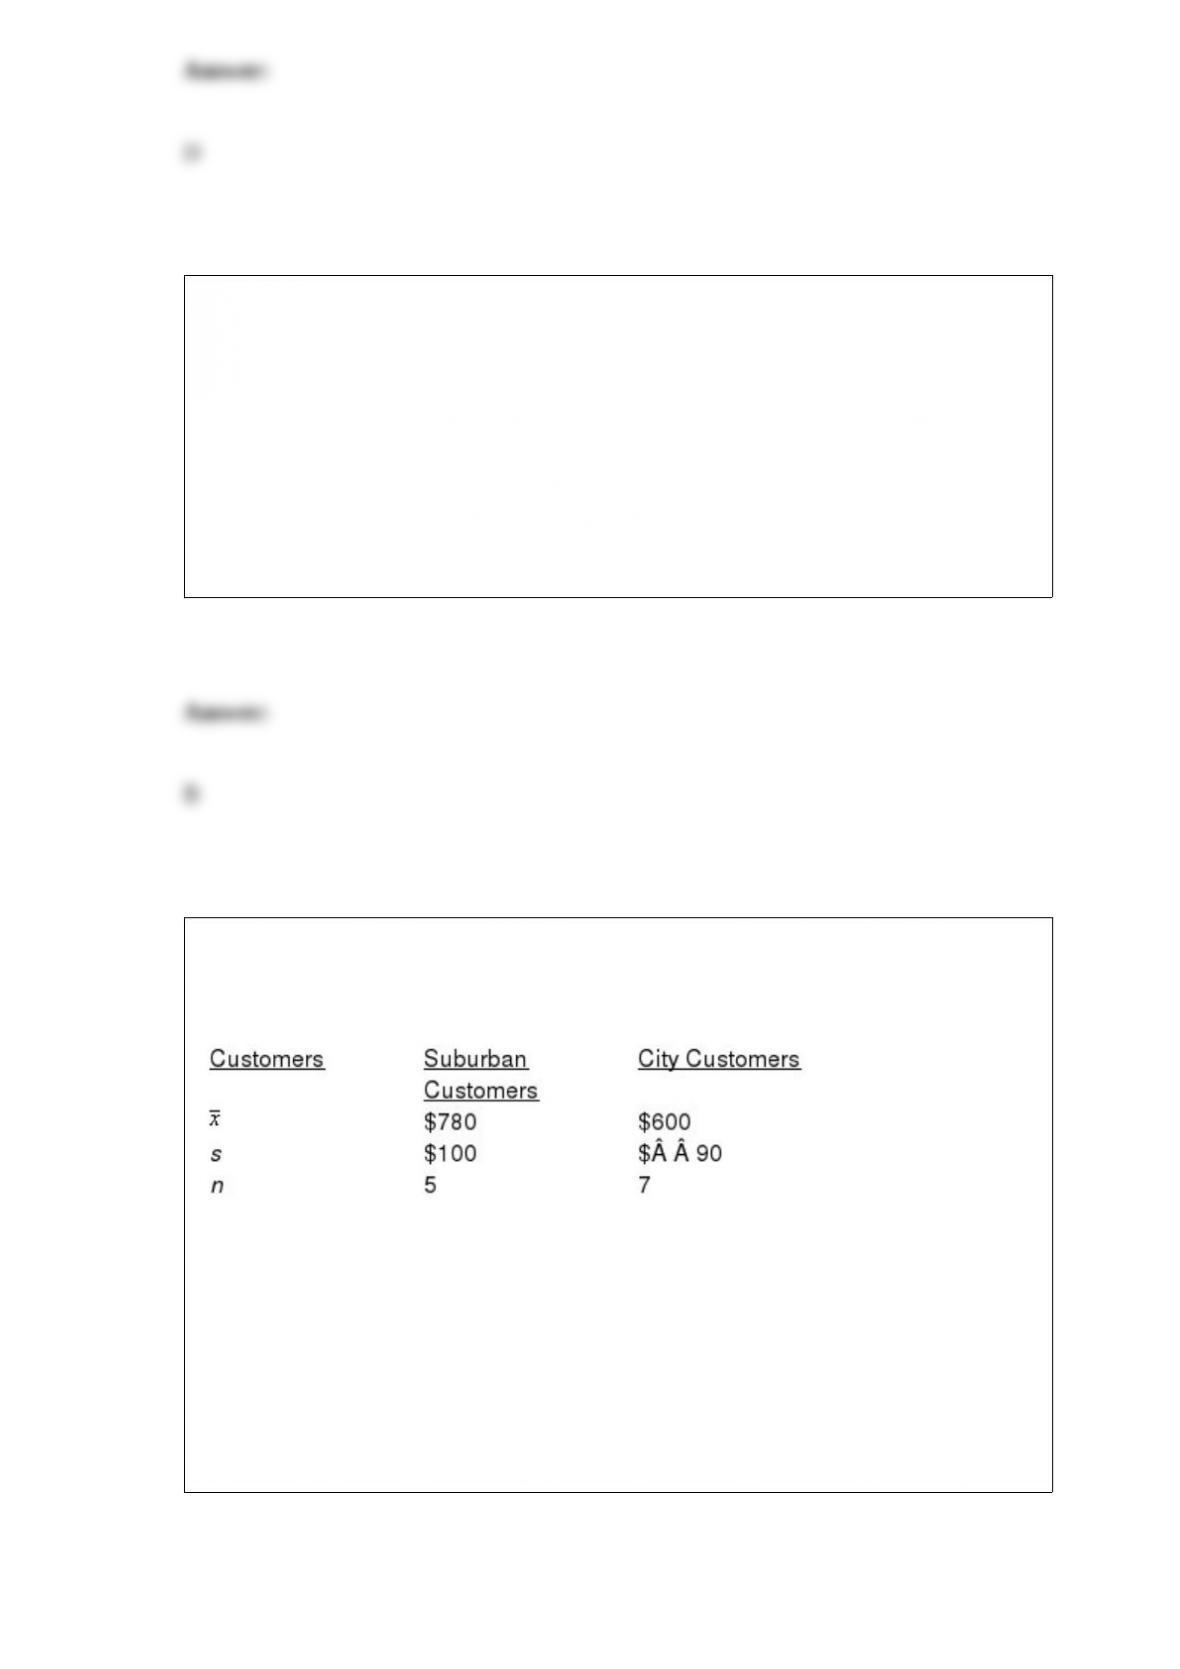
Exhibit 13-5
Part of an ANOVA table is shown below.
Refer to Exhibit 13-5. The mean square within treatments (MSE) is
a. 60
b. 15
c. 300
d. 20

The standard error of the proportion will become larger as
a. n increases
b. p approaches 0
c. p approaches .5
d. p approaches 1
A sample of 400 observations will be taken from a process (an infinite population). The
population proportion equals 0.8. The probability that the sample proportion will be
greater than 0.83 is
a. 0.4332
b. 0.9332
c. 0.0668
d. 0.5668
For the Wilcoxon signed-rank test, differences of 0 are
a. discarded
b. assigned a rank of n/2

c. assigned a rank of n
d. assigned a rank of n + 1
Quality assurance consists of
a. quality control
b. quality engineering
c. quality assurance
d. Both quality control and quality engineering are correct.
Random samples of size 81 are taken from a process (an infinite population) whose
mean and standard deviation are 200 and 18, respectively. The distribution of the
population is unknown. The mean and the standard error of the distribution of sample
means are
a. 200 and 18
b. 81 and 18
c. 9 and 2
d. 200 and 2
Given that z is a standard normal random variable, what is the value of z if the area to
the right of z is 0.1112?
a. 0.3888
b. 1.22
c. 2.22
d. 3.22
The president of a bank believes that the variance of the deposits of suburban customers
is less than the variance of city customers. Below you are given the results of samples
taken from suburban and city customers.
a. State the null and alternative hypotheses to be tested.
b. Compute the test statistic.
c. The null hypothesis is to be tested at the 5% level of significance. State the decision
rule for the test.
d. What do you conclude?
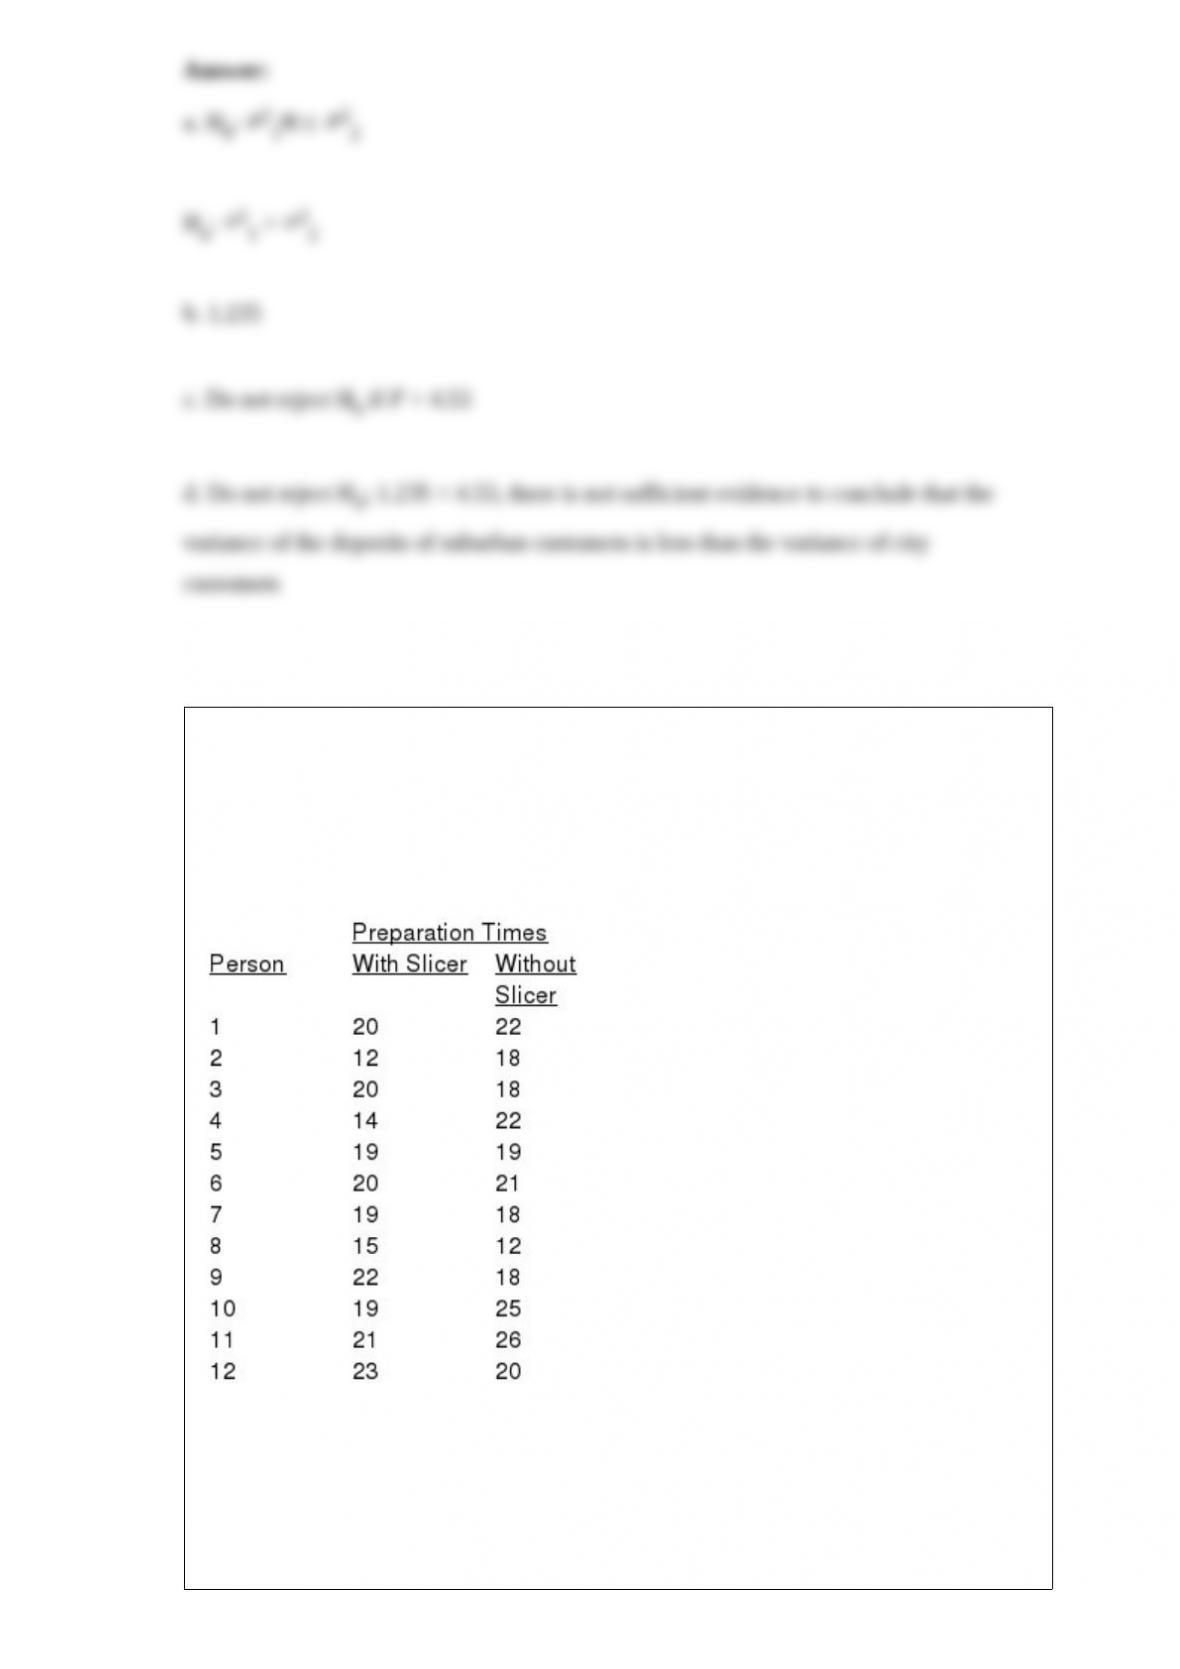
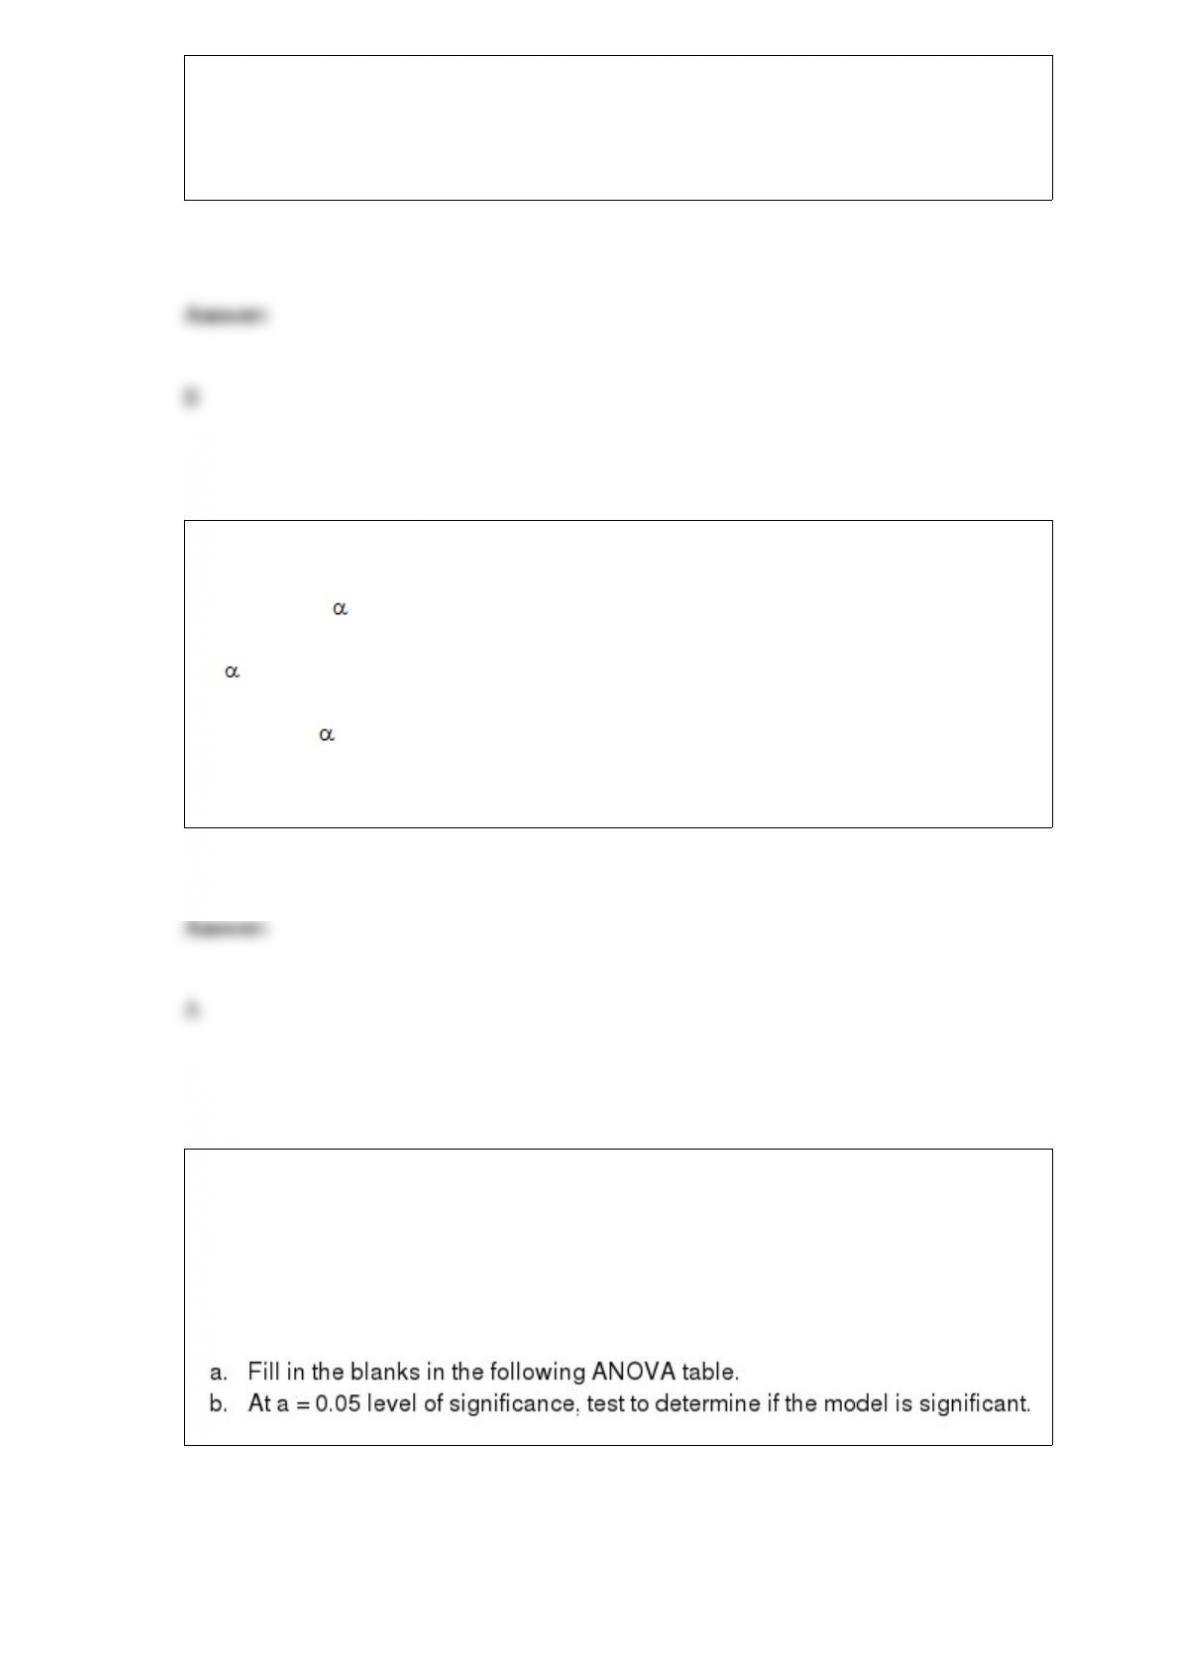
Exhibit 18-3
A company advertises that food preparation time can be significantly reduced with the
Handy Dandy Slicer. A sample of 12 individuals prepared the ingredients for a meal
with and without the slicer. You are given the preparation times below.
Refer to Exhibit 18-3. The null hypothesis should be
a. rejected
b. not rejected
c. revised
d. None of these alternatives is correct.
When the p-value is used for hypothesis testing, the null hypothesis is rejected if
a. p-value
b. p-value
c. p-value
d. p-value z
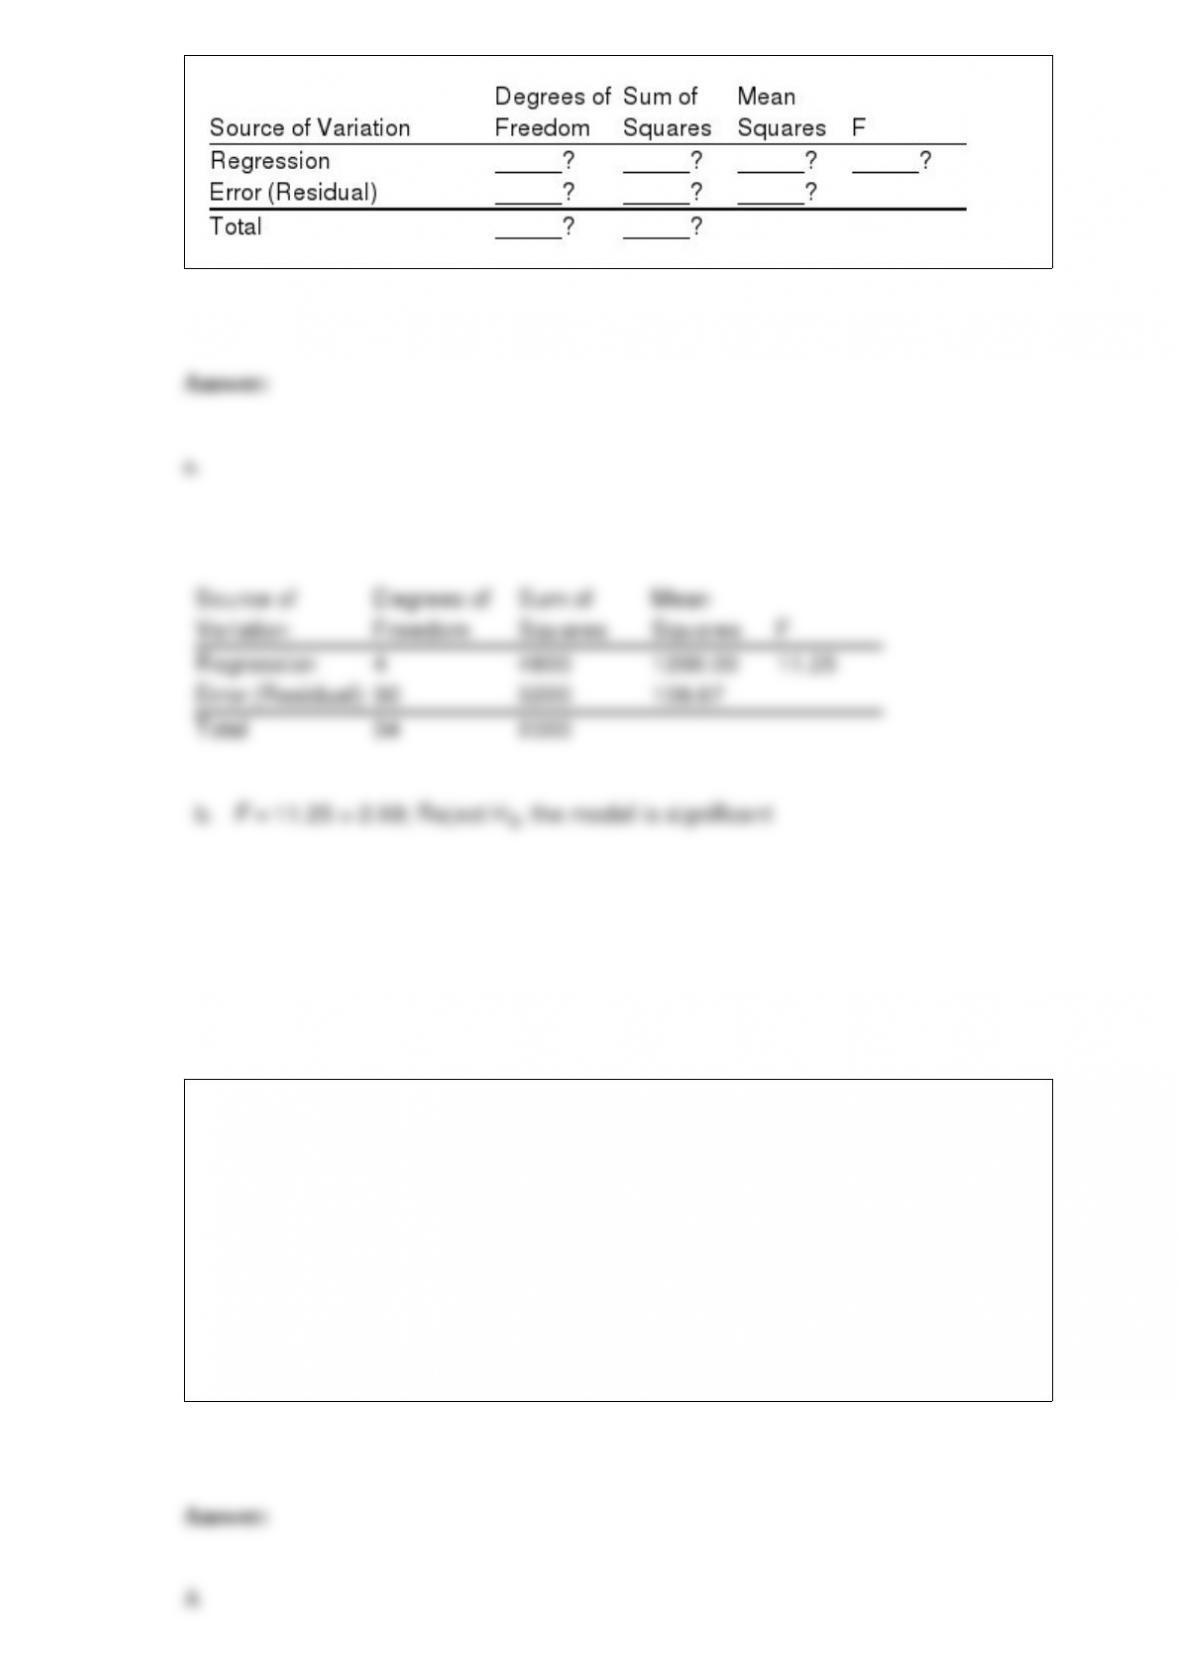
A regression analysis was applied in order to determine the relationship between a
dependent variable and 4 independent variables. The following information was
obtained from the regression analysis.
R Square = 0.60
SSR = 4,800
Total number of observations n = 35
X is a normally distributed random variable with a mean of 5 and a variance of 4. The
probability that x is greater than 10.52 is
a. 0.0029
b. 0.0838
c. 0.4971
d. 0.9971

The coefficient of variation indicates how large the standard deviation is relative to the
a. mean
b. median
c. range
d. variance
In computing the standard error of the mean, the finite population correction factor is
not used when
a. n/N 0.05
b. N/n 0.05
c. n/N 0.05
d. n 30