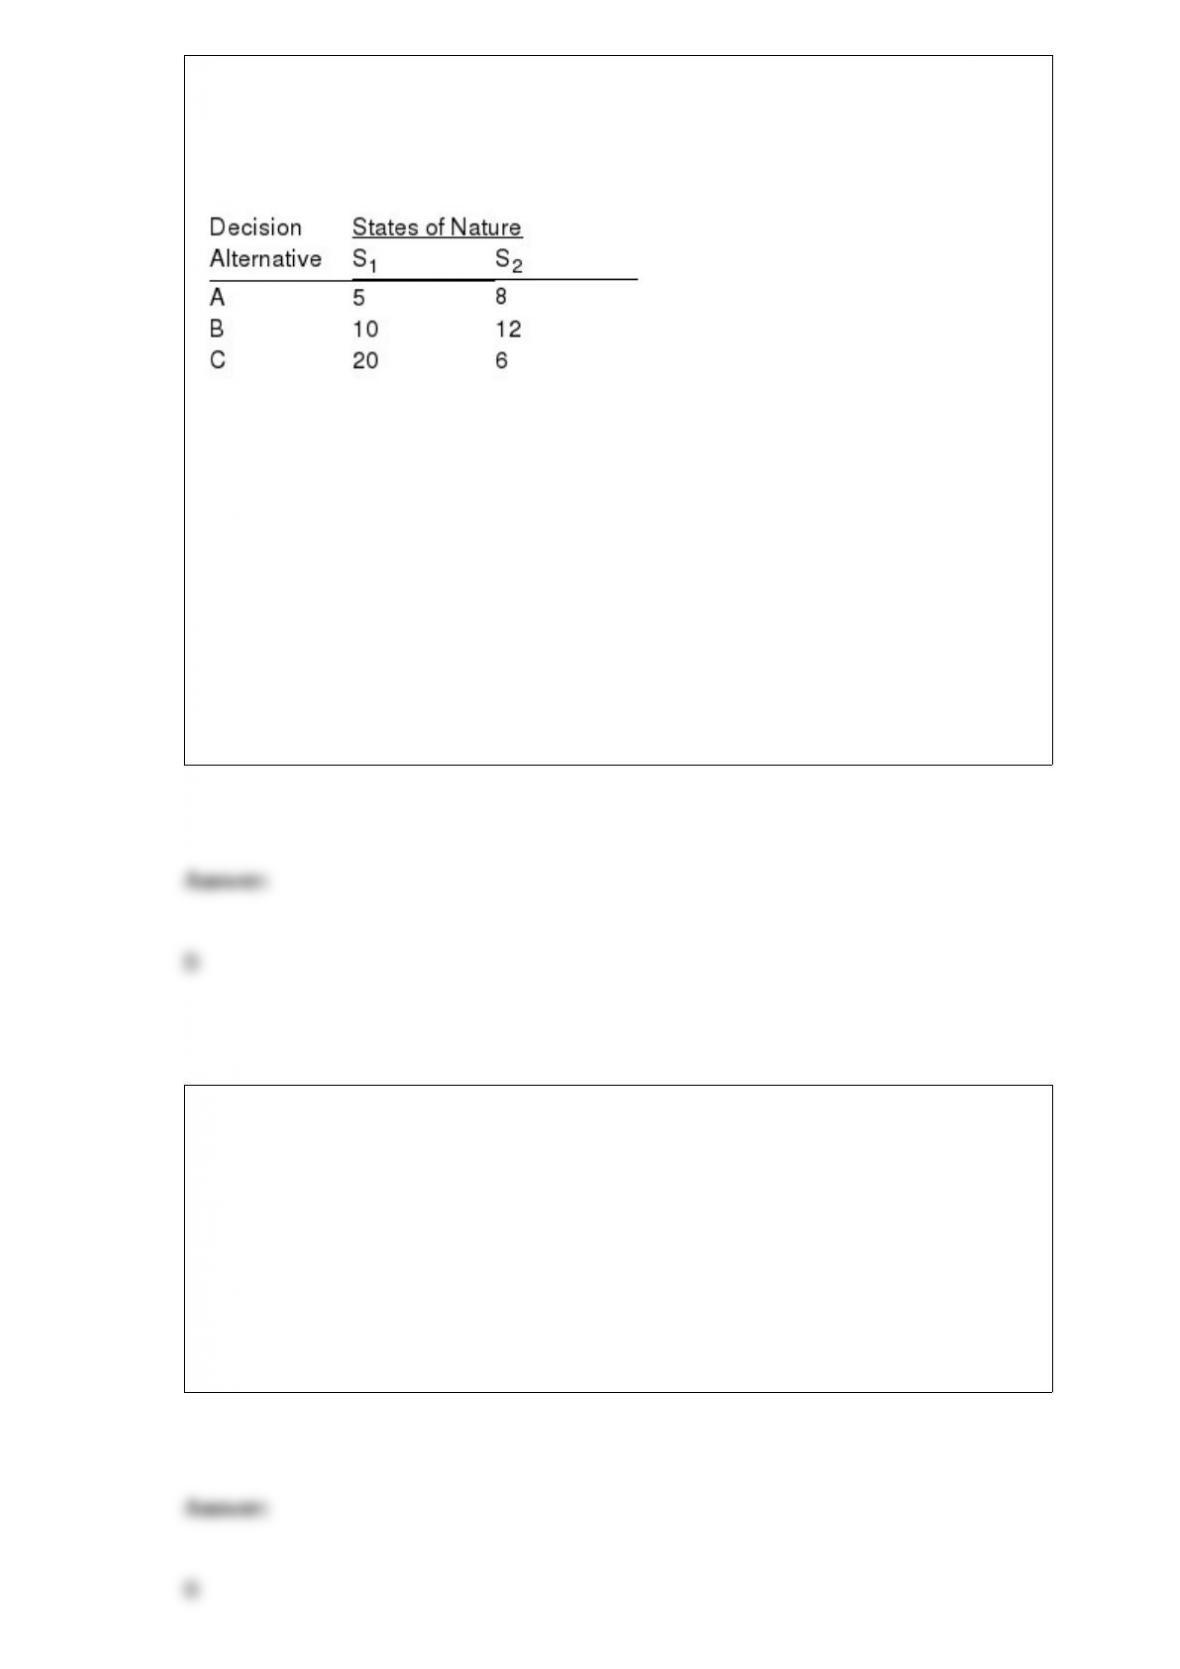
Exhibit 20-1
Below you are given a payoff table involving two states of nature and three decision
alternatives.
The probability of occurrence of S1 = 0.2.
Refer to Exhibit 20-1. The expected value of perfect information is
a. 6.2
b. 2.0
c. 13.6
d. 4.8
If P(A|B) = .3,
a. P(B|A) = .7
b. P(AC|B) = .7
c. P(A|BC) = .7
d. P(AC|BC) = .7
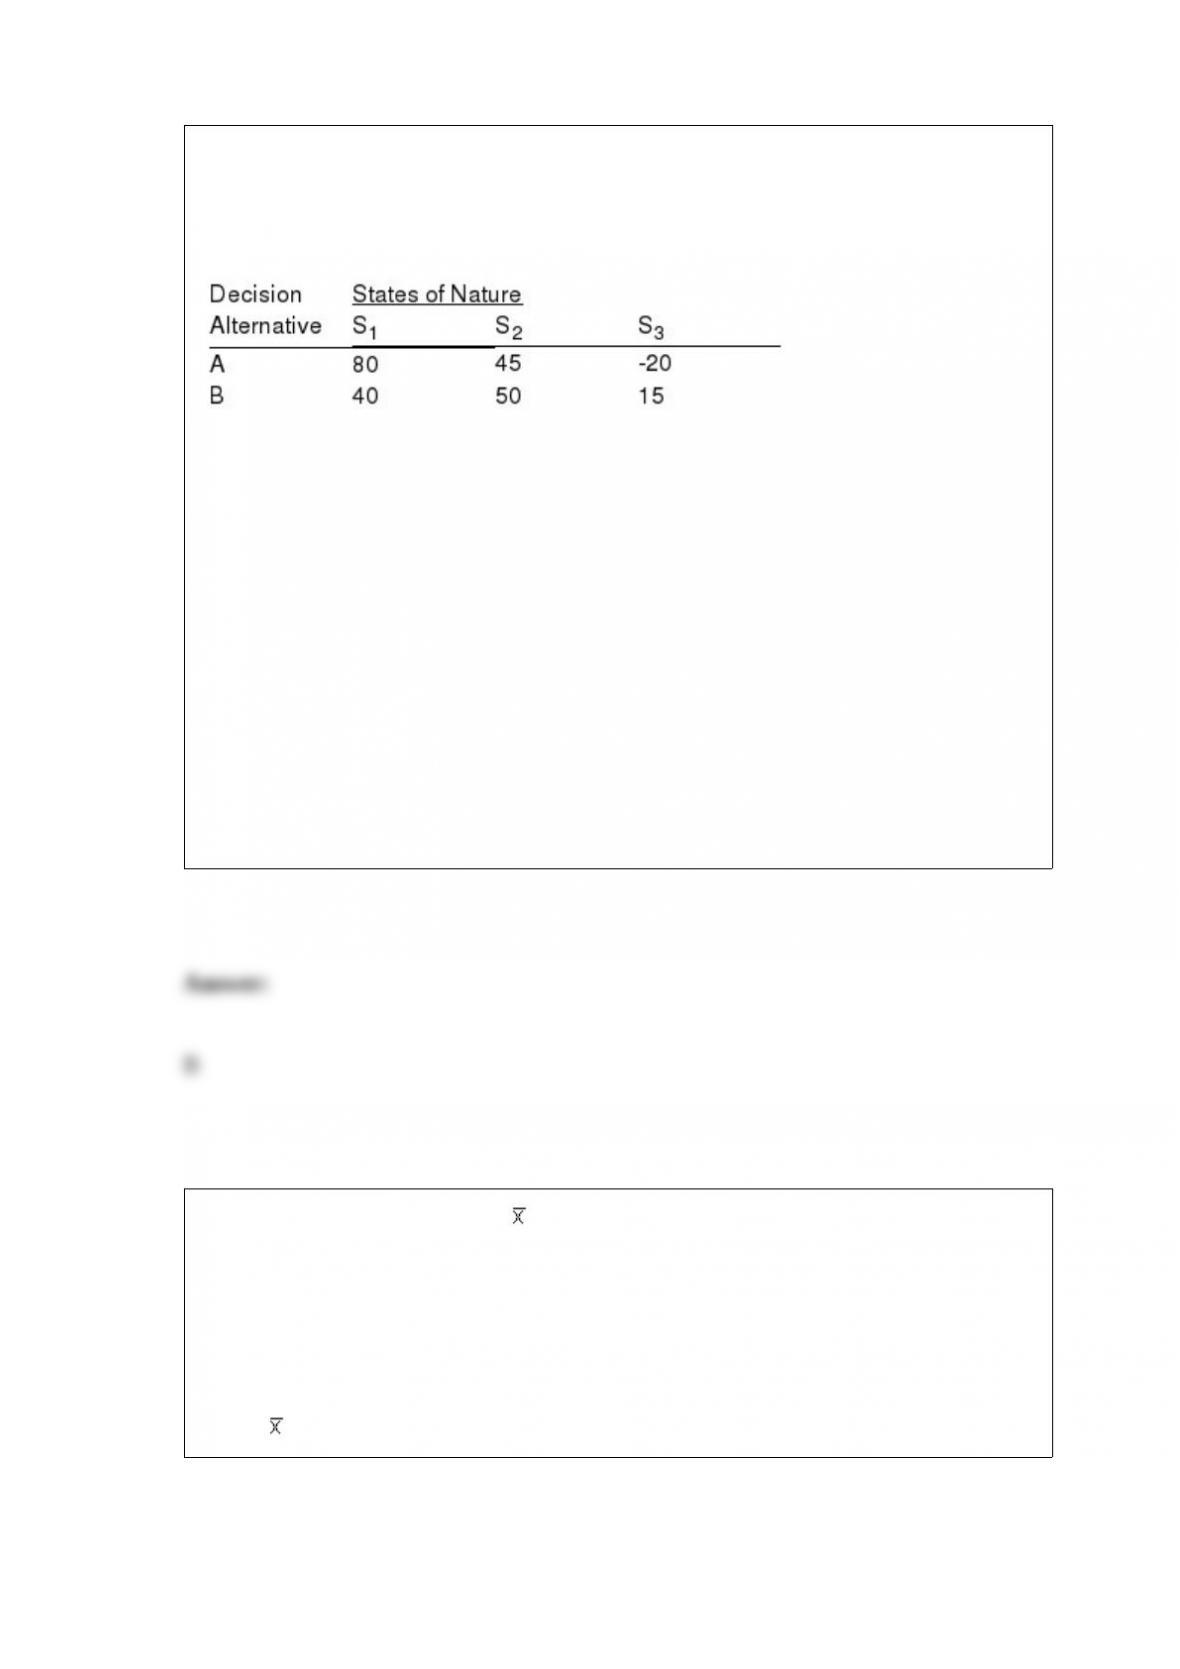
Exhibit 20-2
Below you are given a payoff table involving three states of nature and two decision
alternatives.
The probability that S1 will occur is 0.1; the probability that S2 will occur is 0.6; and
the probability that S3 will occur is 0.3.
Refer to Exhibit 20-2. The recommended decision based on the expected value criterion
is
a. A
b. B
c. Both alternatives are the same.
d. None of the answers are correct.
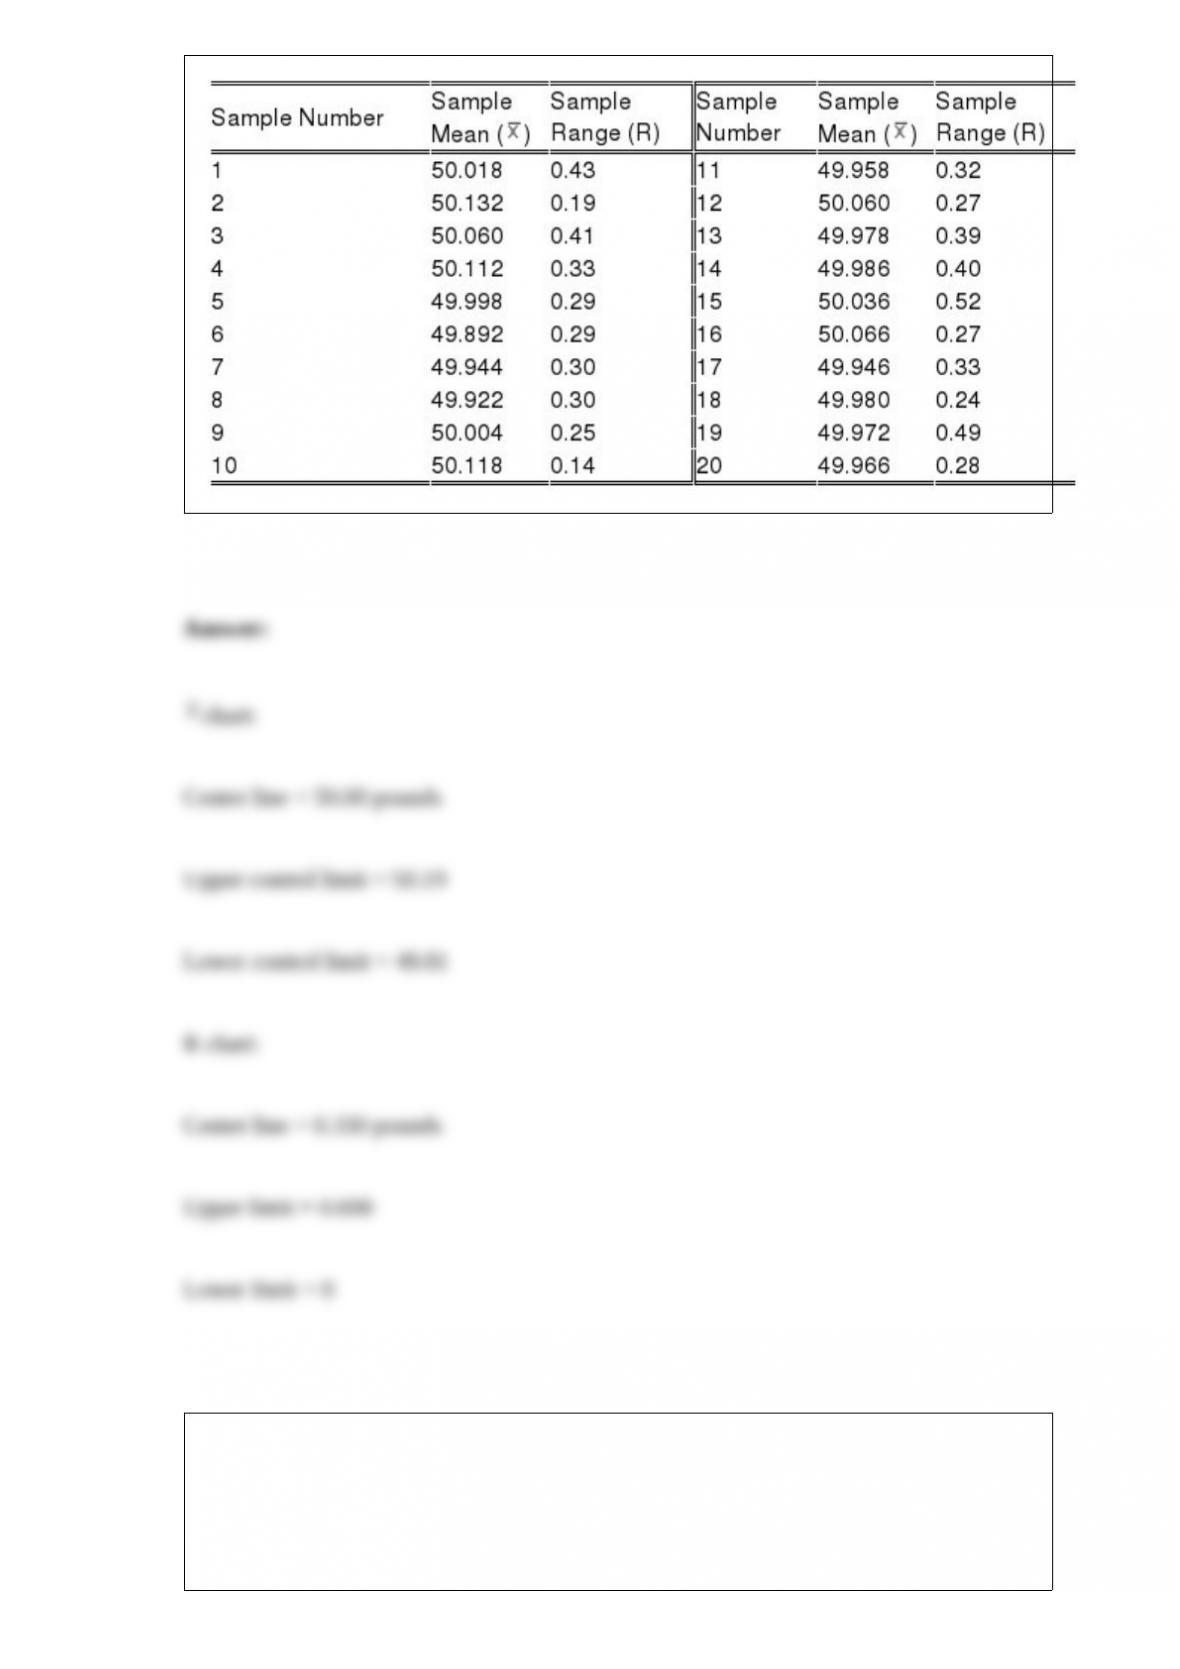
Harry Coates wants to construct and R charts at the bag-filling operation for Meow
Chow cat food. He knows that when the filling operation is functioning correctly, bags
of cat food should average 50.00 pounds and 5-bag samples should have an average
range of .330 pounds.
Harry had twenty 5-bag samples taken at 2-hour intervals and the sample means and
ranges are shown below. Determine the center lines and upper and lower control limits
for the and R charts.
If P(A ‡ B) = 0,
a. P(A) + P(B) = 1
b. either P(A) = 0 or P(B) = 0
c. A and B are mutually exclusive events
d. A and B are independent events
Assume your favorite football team has 2 games left to finish the season. The outcome
of each game can be win, lose or tie. The number of possible outcomes is
a. 2
b. 4
c. 6
d. None of the other answers is correct.
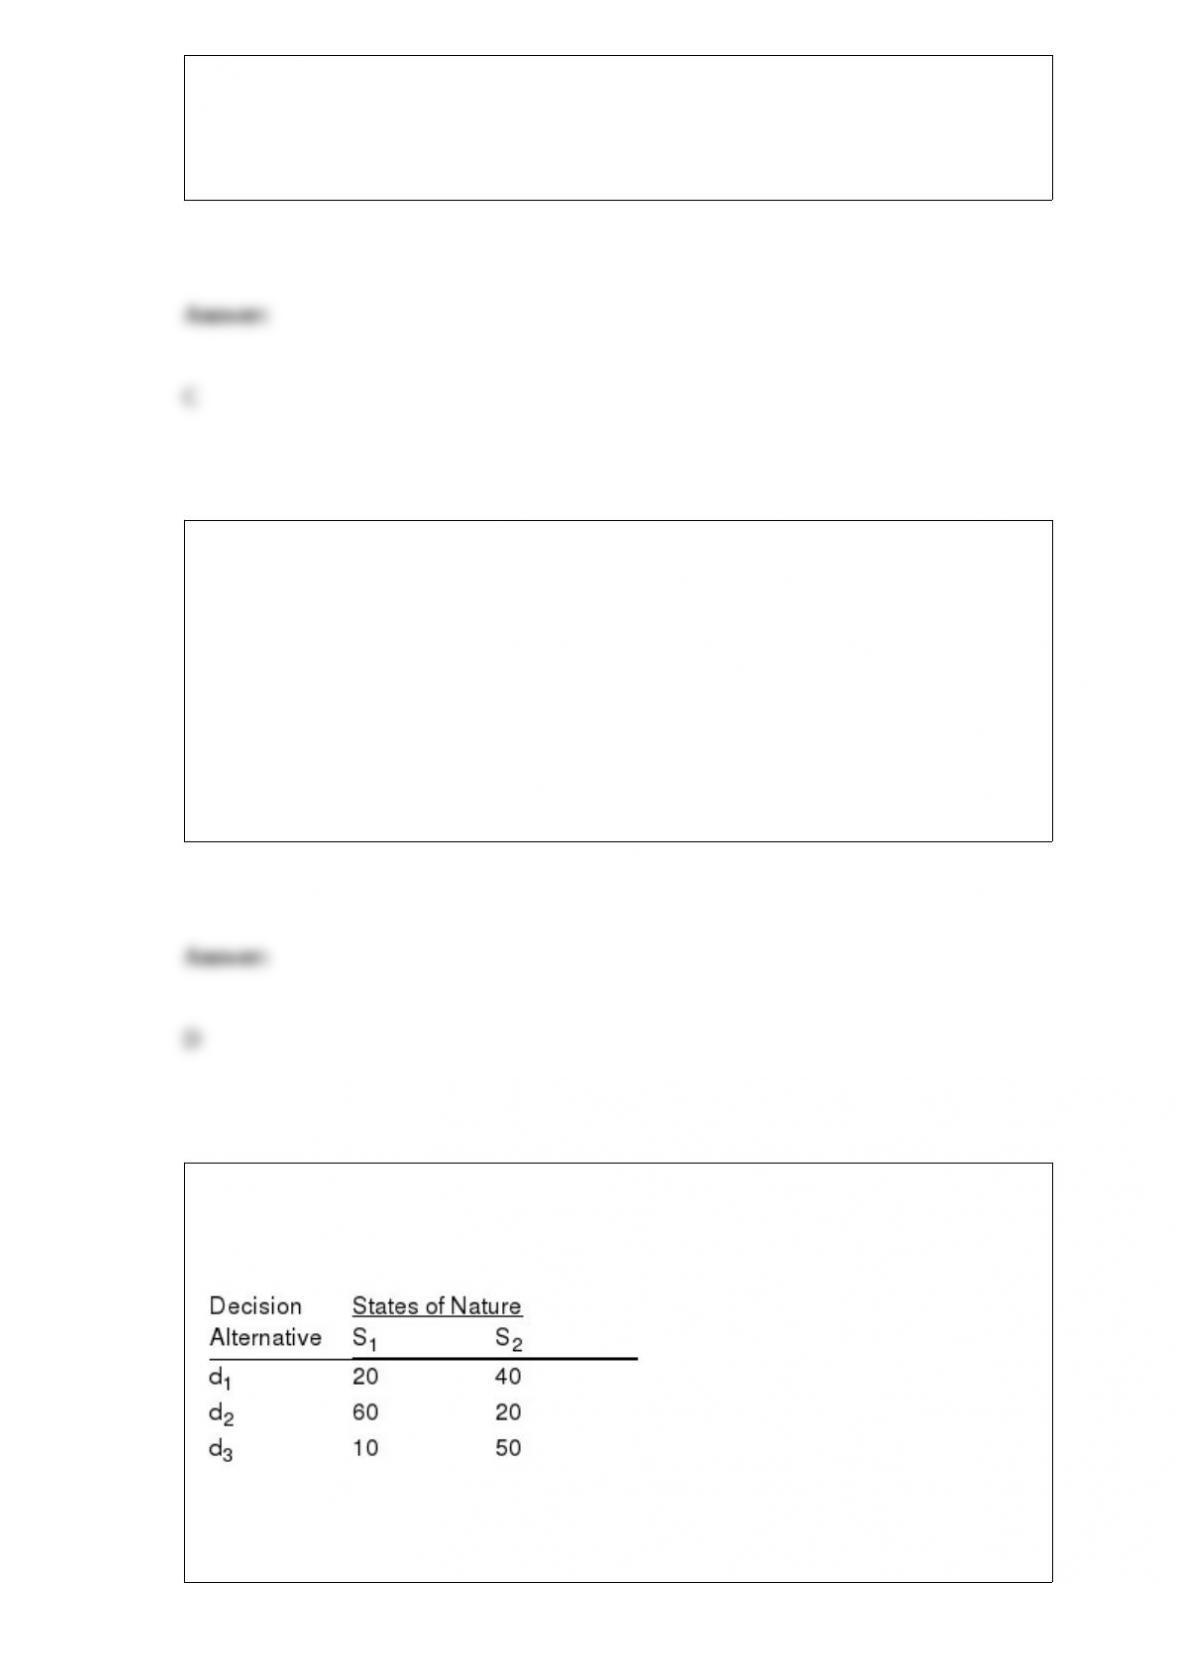
Assume you are faced with the following decision alternatives and two states of nature.
The probability of the occurrence of state of nature 1 is 0.35. The payoff table is shown
below:
a. Determine the expected value of each alternative and indicate which decision
alternative is the best.
b. Determine the expected value with perfect information about the states of nature.
c. Determine the expected value of perfect information.
If the cost of a Type I error is high, a smaller value should be chosen for the
a. critical value
b. confidence coefficient
c. level of significance
d. test statistic
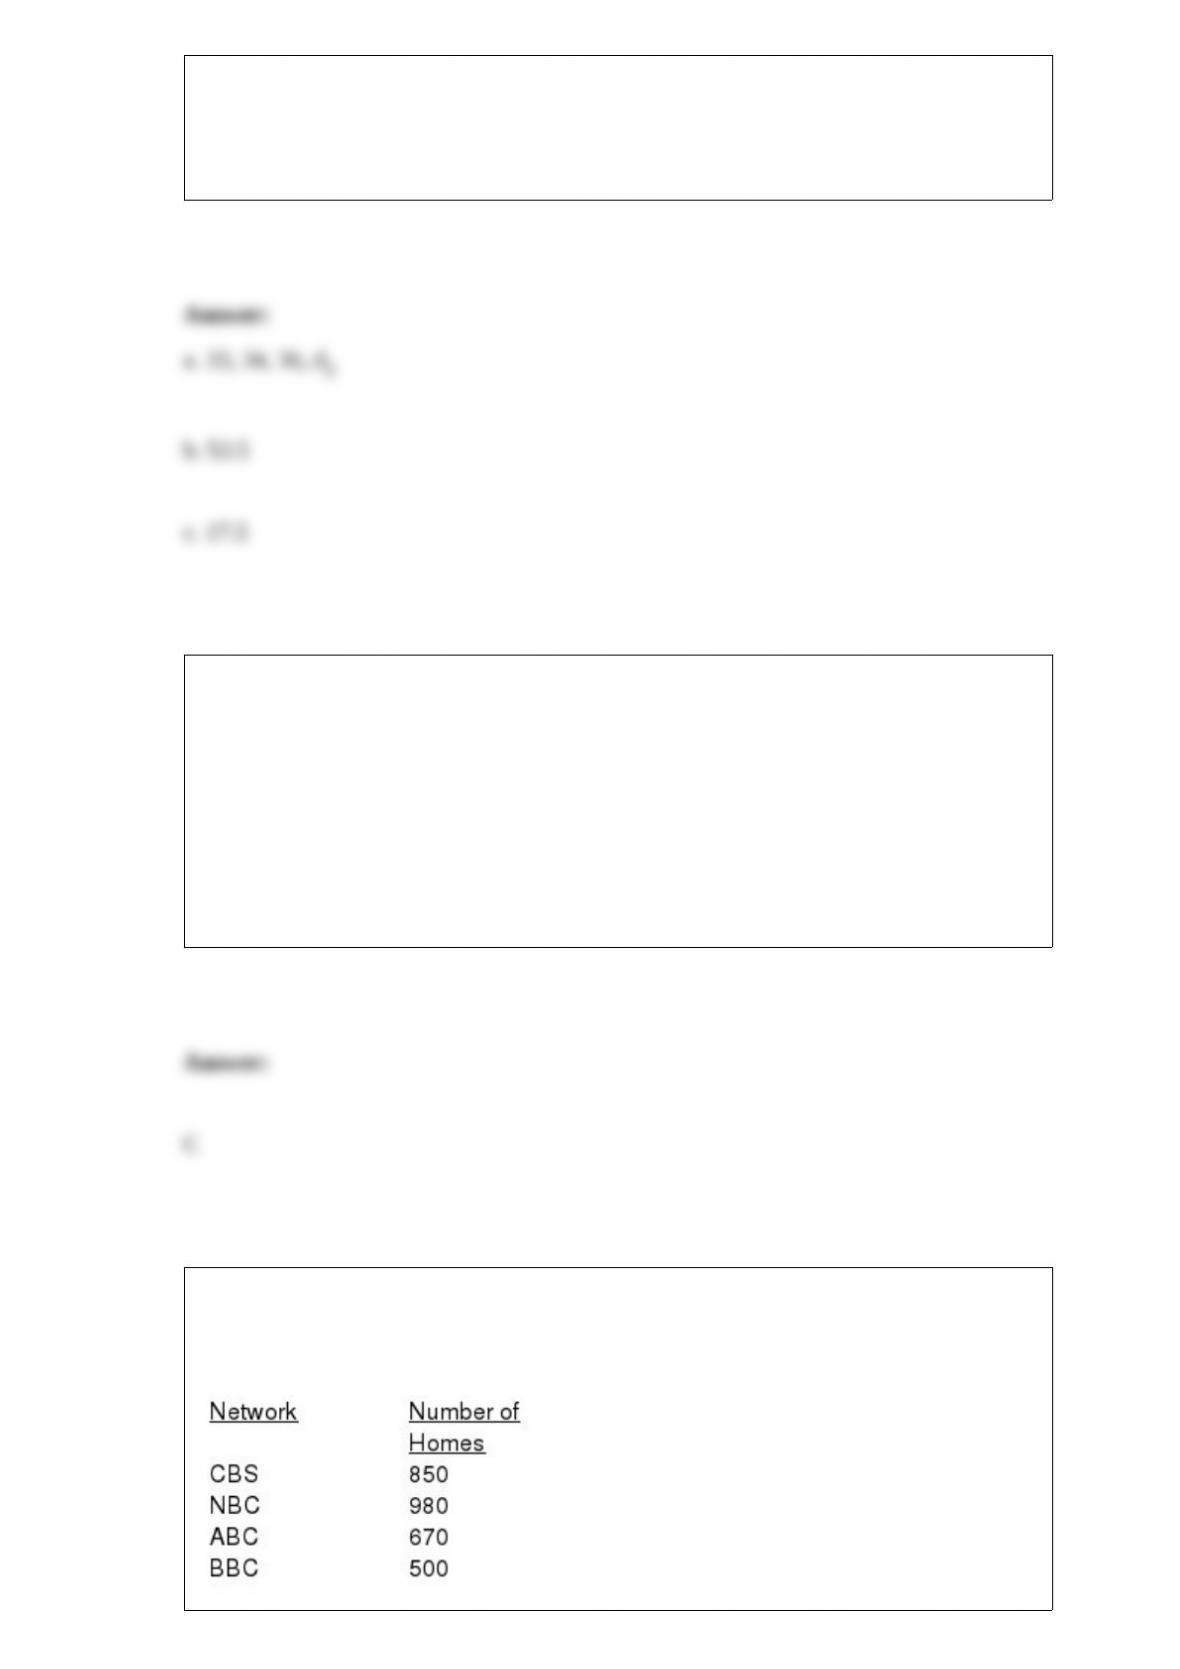
Prior to the start of the season, it was expected that audience proportions for the four
major news networks would be CBS 28%, NBC 35%, ABC 22% and BBC 15%. A
recent sample of homes yielded the following viewing audience data.
We want to determine whether or not the recent sample supports the expectations of the
number of homes of the viewing audience of the four networks.
a. State the null and alternative hypotheses to be tested.
b. Compute the test statistic.
c. The null hypothesis is to be tested at 95% confidence. Determine the critical value for
this test.
d. What do you conclude?
The probability distribution of all possible values of the sample mean is called the
a. central probability distribution
b. sampling distribution of the sample mean
c. random variation
d. standard error
Exhibit 2-1
The numbers of hours worked (per week) by 400 statistics students are shown below.
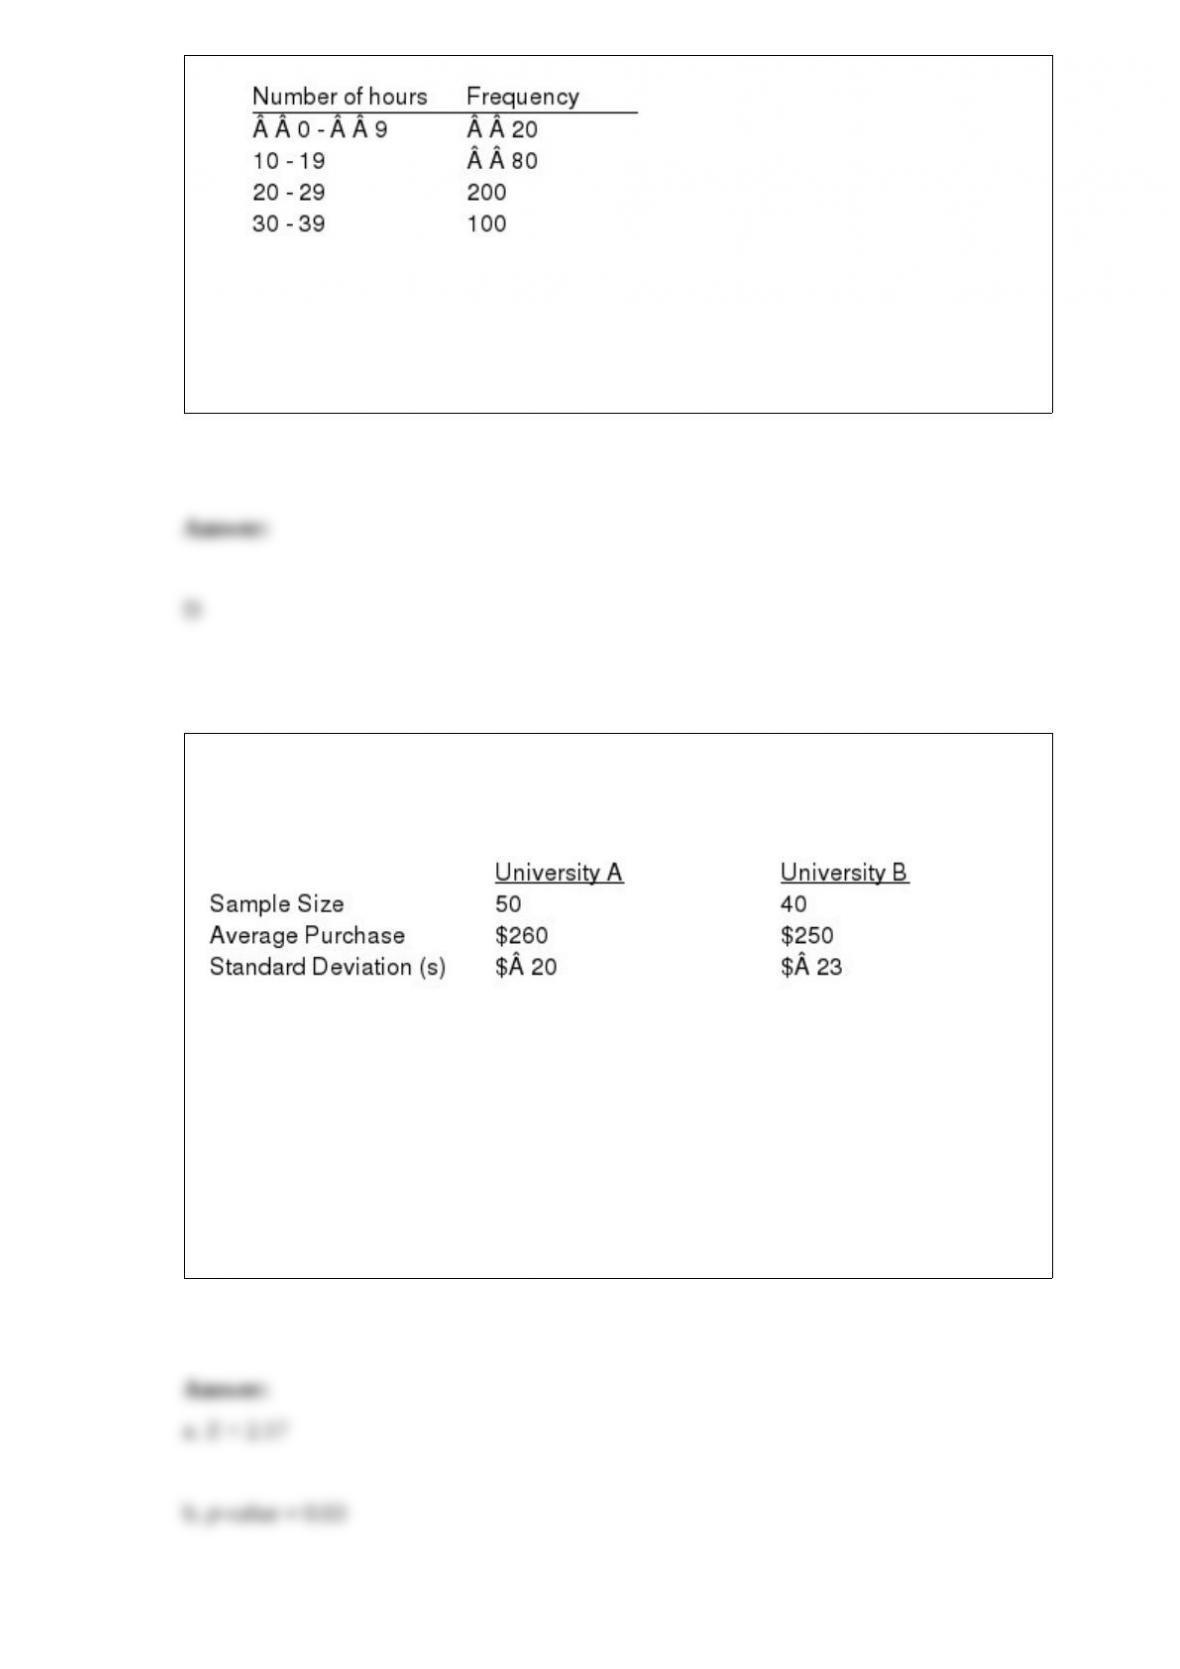
Refer to Exhibit 2-1. The relative frequency of students working 9 hours or less
a. is 20
b. is 100
c. is 0.95
d. 0.05
Independent random samples taken on two university campuses revealed the following
information concerning the average amount of money spent on textbooks during the fall
semester.
We want to determine if, on the average, students at University A spent more on
textbooks then the students at University B.
a. Compute the test statistic.
b. Compute the p-value.
c. What is your conclusion? Let = .05.
As a general rule, the sampling distribution of the sample proportions can be
approximated by a normal probability distribution whenever
a. np 5
b. n(1 p) 5
c. n 30
d. Both np 5 and n(1 p) 5 are true.
A subset of a population selected to represent the population is a
a. subset
b. sample
c. small population
d. None of the alternative answers is correct.
The measure of location often used in analyzing growth rates in financial data is the
a. arithmetic mean
b. weighted mean
c. geometric mean
d. hyperbolic mean
If the coefficient of correlation is 0.8, the percentage of variation in the dependent
variable explained by the estimated regression equation is
a. 0.80%
b. 80%
c. 0.64%
d. 64%
A process sampled 30 times with a sample of size nine resulted in = 12.7 and =
0.8. Compute the upper and lower control limits for the and charts for this
process.
The monthly starting salaries of students who receive an MBA degree have a standard
deviation of $110. What size sample should be selected to obtain a 0.95 probability of
estimating the mean monthly income within $20 or less?
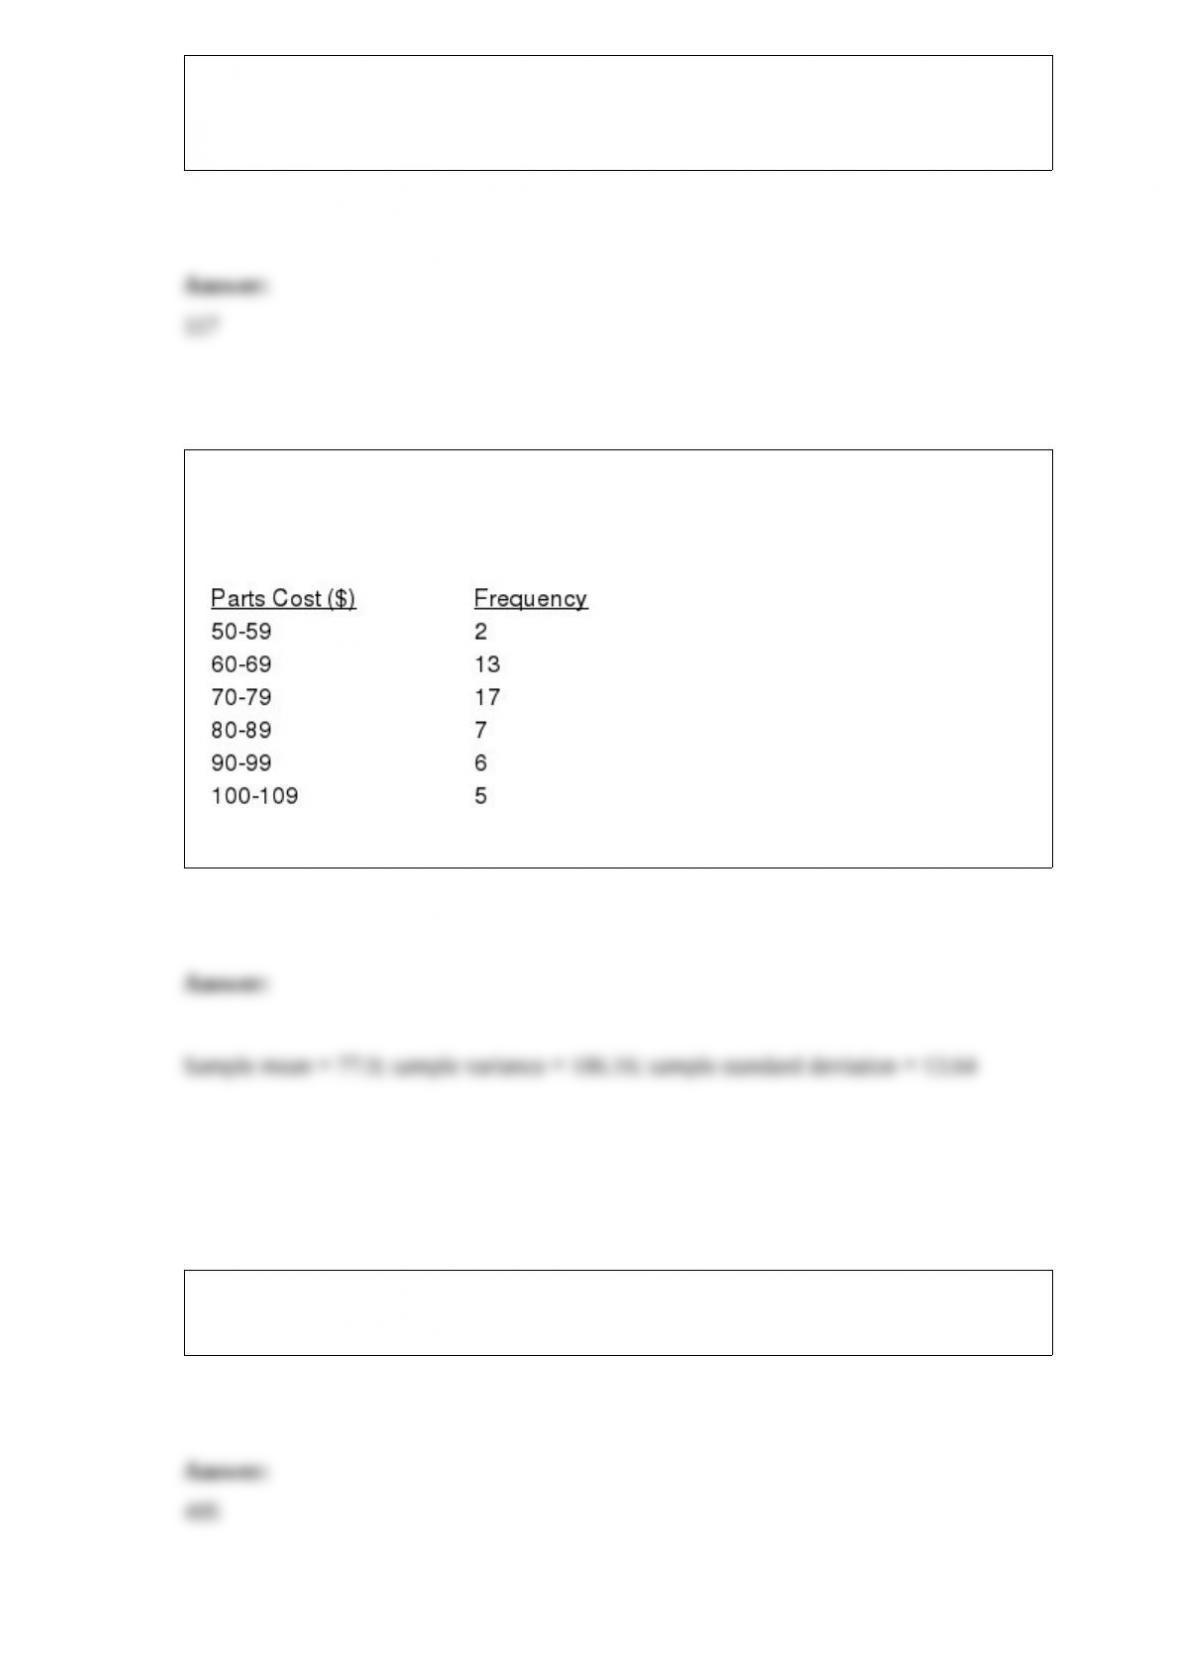
The manager of Hudson Auto Repair has recorded the following frequency
distribution for the cost of new parts used in doing an engine tune-up in a
sample of 50 tune-ups.
Compute the sample mean, variance, and standard deviation.
A committee of 4 is to be selected from a group of 12 people. How many possible
committees can be selected?
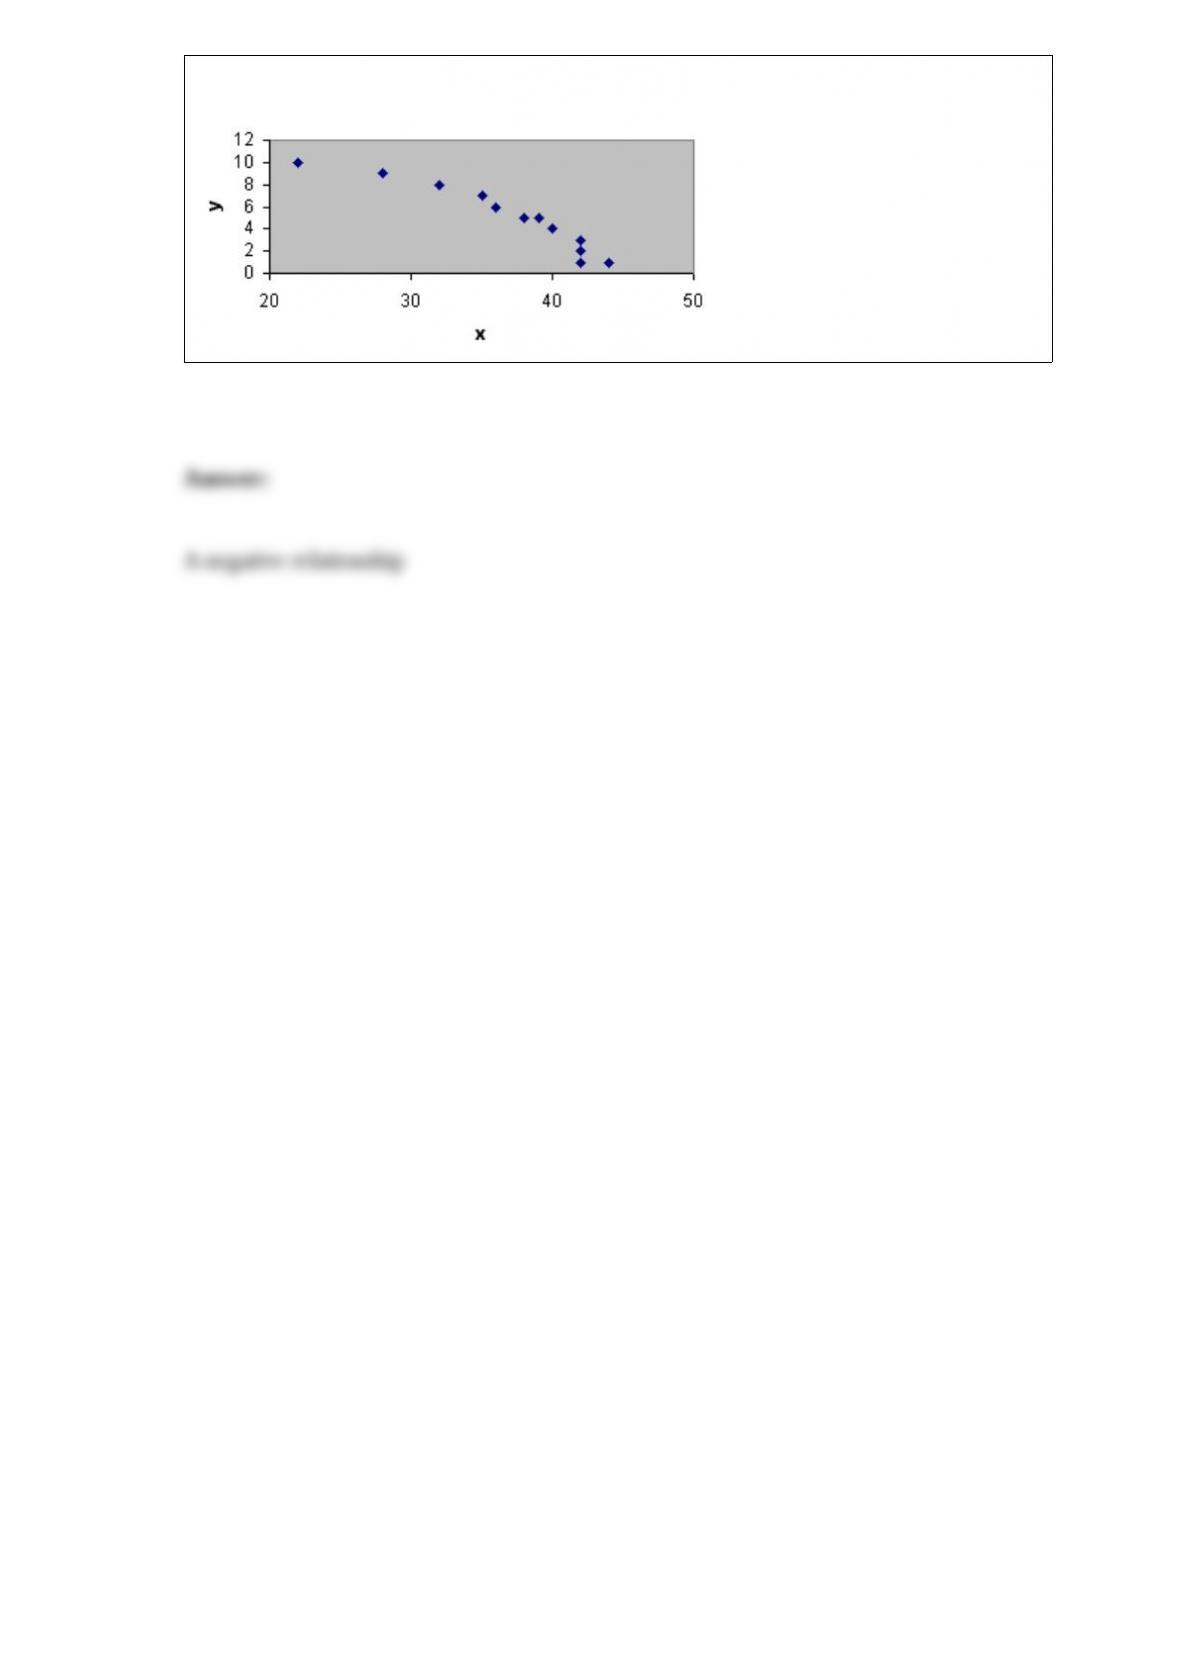
What type of relationship is depicted in the following scatter diagram?