
Exhibit 10-10
The results of a recent poll on the preference of shoppers regarding two products are
shown below.
Refer to Exhibit 10-10. The standard error of is
a. 52
b. 0.044
c. 0.0225
d. 100
It is crucial that the variance of a production process be less than or equal to 25. A
sample of 22 is taken. The sample variance equaled 26.
a. Construct a 90% confidence interval for the population variance.
b. Construct a 90% confidence interval for the population standard deviation.
c. State the null and alternative hypotheses to be tested.
d. Compute the test statistic.
e. The null hypothesis is to be tested at the 10% level of significance. State the decision
rule for the test.
f. What do you conclude about the population variance?
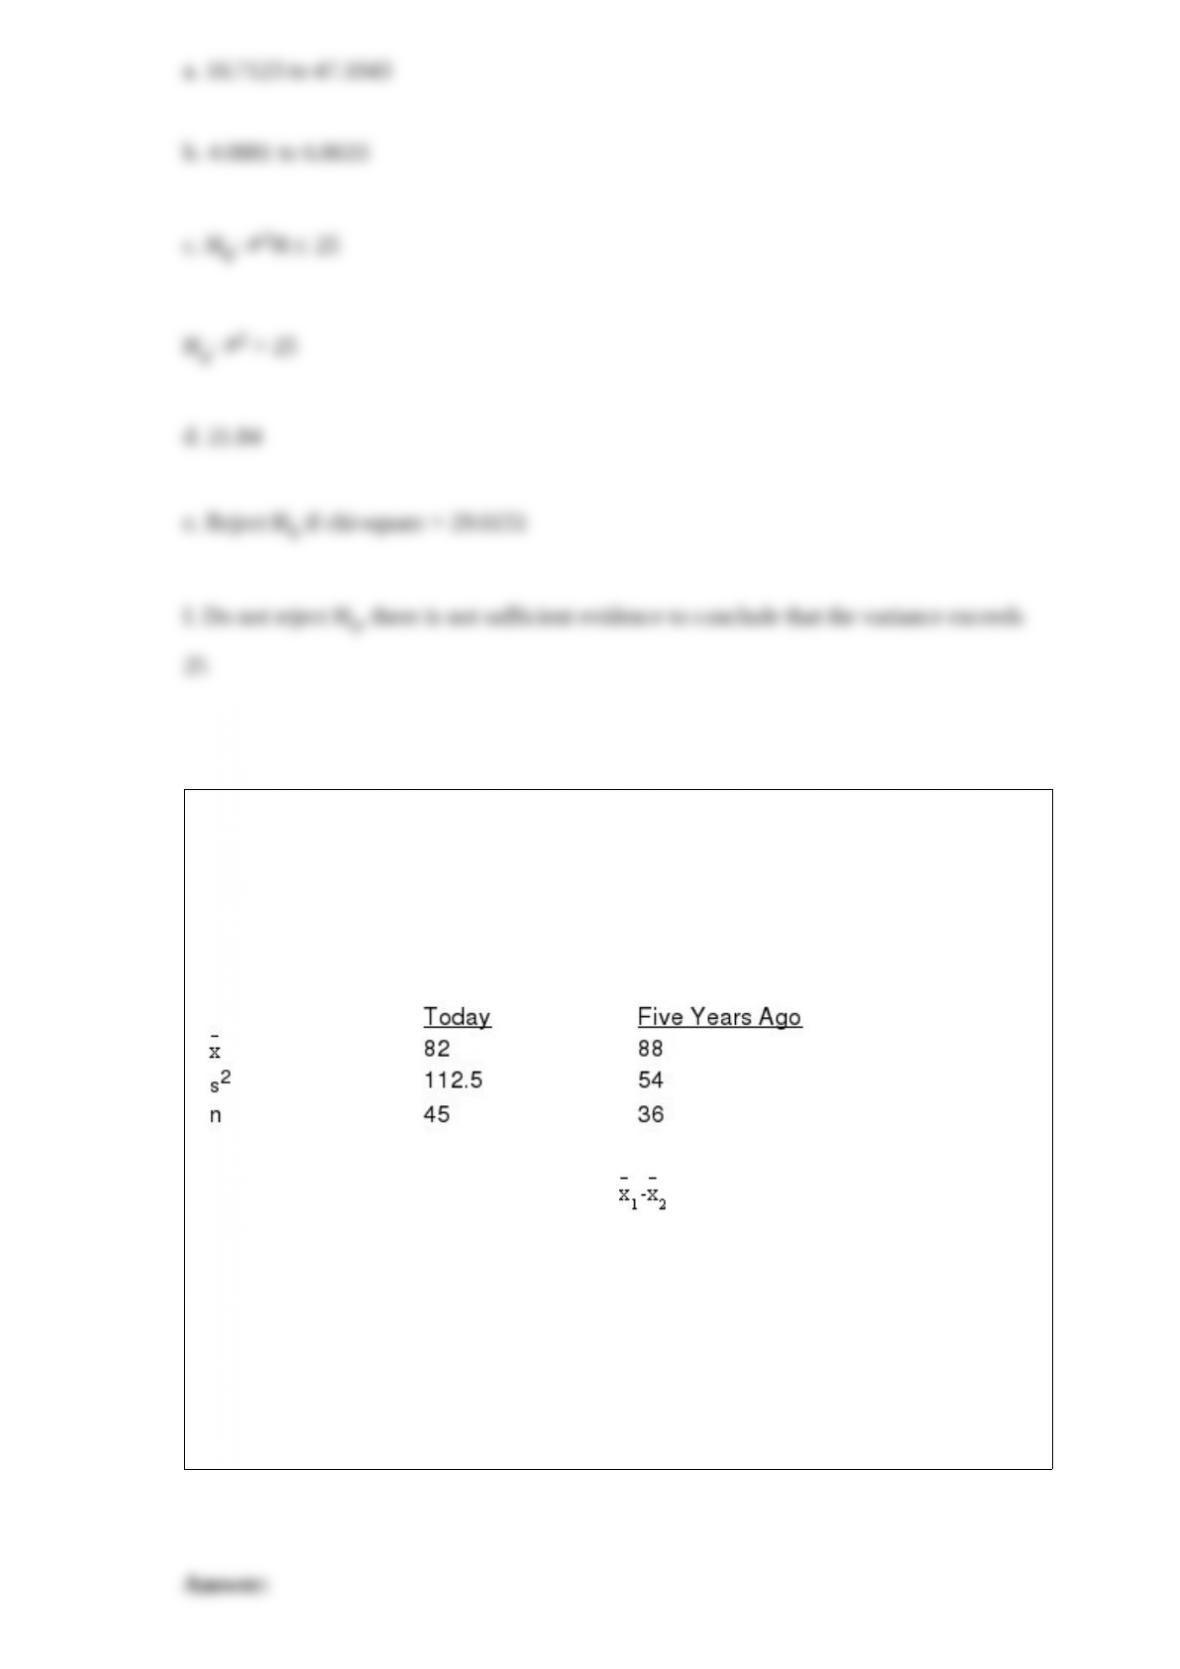
Exhibit 10-3
A statistics teacher wants to see if there is any difference in the abilities of students
enrolled in statistics today and those enrolled five years ago. A sample of final
examination scores from students enrolled today and from students enrolled five years
ago was taken. You are given the following information.
Refer to Exhibit 10-3. The standard error of is
a. 12.9
b. 9.3
c. 4
d. 2

Which of the following tests would not be an example of nonparametric method?
a. Mann-Whitney-Wilcoxon test
b. Wilcoxon signed-rank test
c. sign test
d. t test
The difference between the observed value of the dependent variable and the value
predicted by using the estimated regression equation is the
a. standard error
b. residual
c. prediction interval
d. variance
An experiment consists of making 80 telephone calls in order to sell a particular
insurance policy. The random variable in this experiment is the number of sales made.
This random variable is a

a. discrete random variable
b. continuous random variable
c. complex random variable
d. None of the answers is correct.
Exhibit 21-3
From a population of size 600, a simple random sample of size 58 is selected. The
sample mean is 400, and the sample standard deviation is 40.
Refer to Exhibit 21-3. An approximate 95% confidence interval for the population total
is
a. 350,000 to 450,000
b. 234,010 to 245,990
c. 350 to 400
d. 390 to 409
During the recent primary elections, the democratic presidential candidate showed the
following pre-election voter support in Alabama and Mississippi.
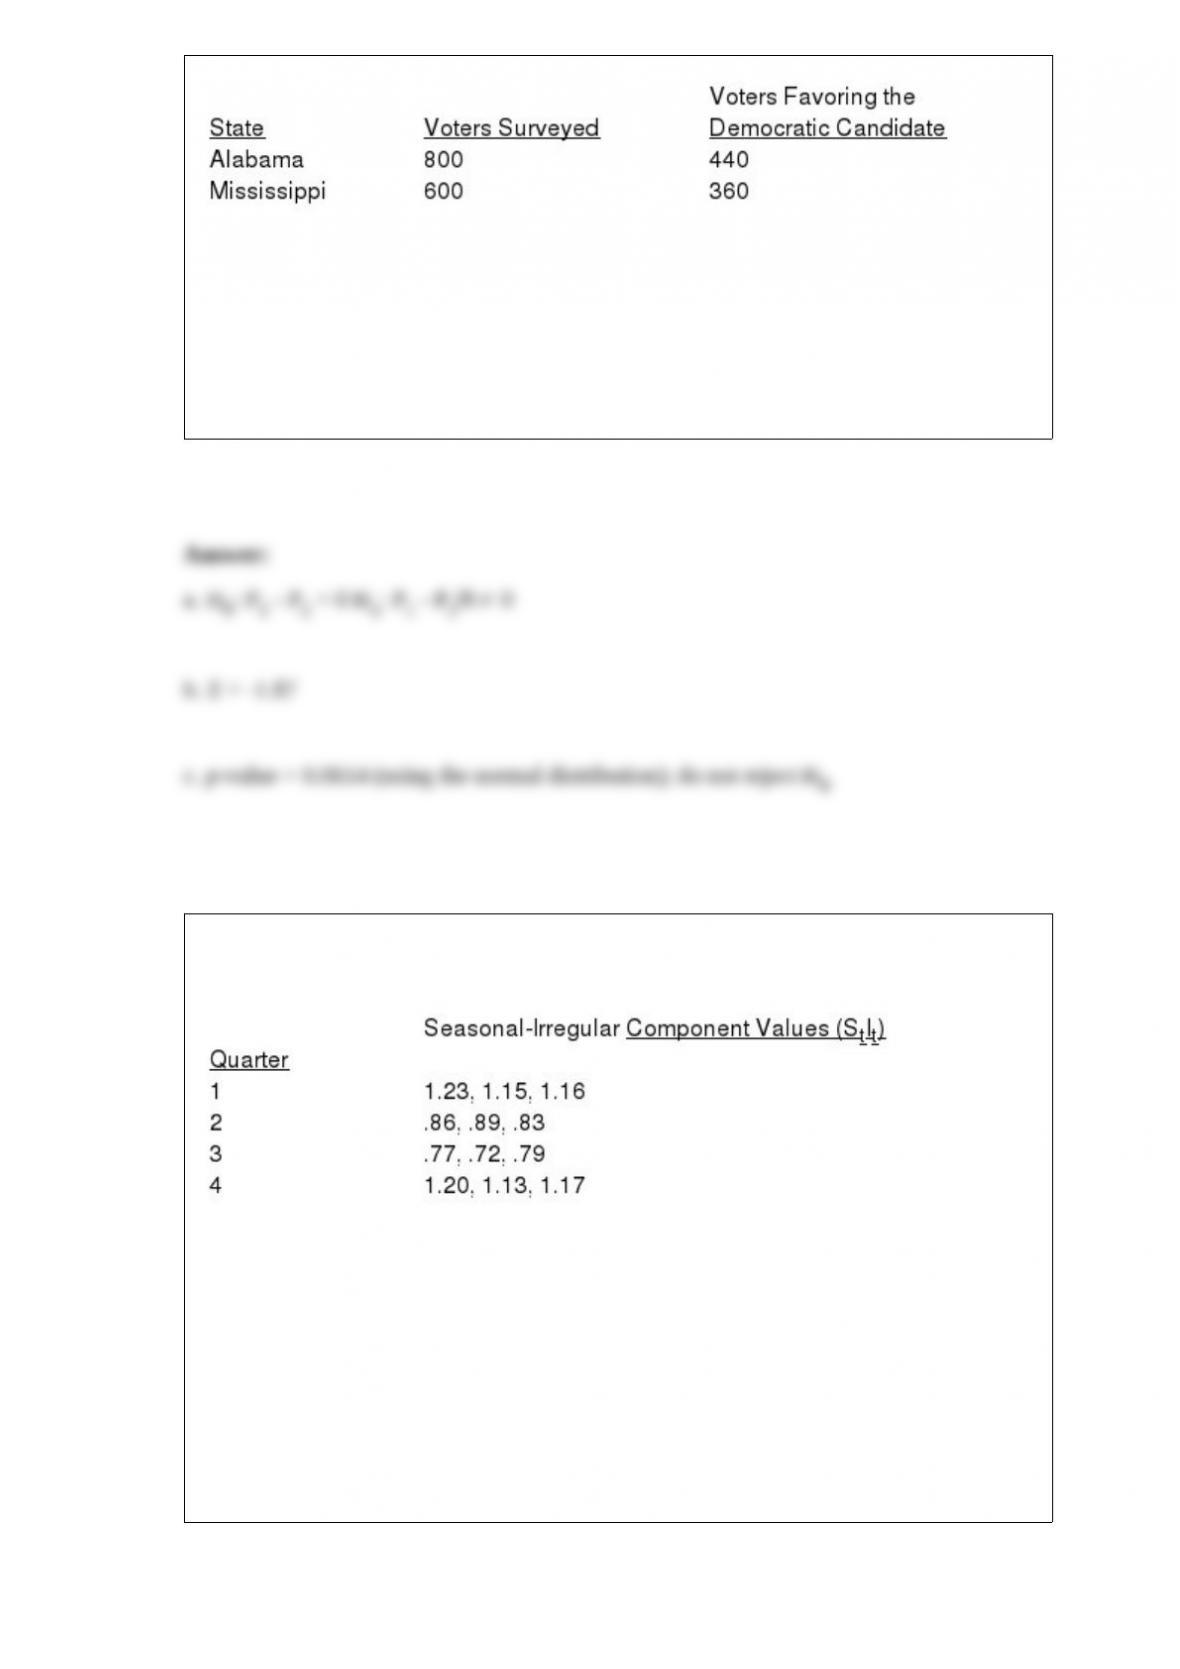
a. We want to determine whether or not the proportions of voters favoring the
Democratic candidate were the same in both states. Provide the hypotheses.
b. Compute the test statistic.
c. Determine the p-value; and at 95% confidence, test the above hypotheses.
You are given the following information on the seasonal-irregular component values for
a quarterly time series:
The seasonal index for Quarter 1 is
a. .997
b. 1.18
c. 4
d. 3

In a regression analysis if SST 4500 and SSE 1575, then the coefficient of
determination is
a. 0.35
b. 0.65
c. 2.85
d. 0.45
Gradual shifting or movement of a time series to relatively higher or lower values over
a longer period of time is called
a. periodicity.
b. cycle.
c. regression.
d. trend.
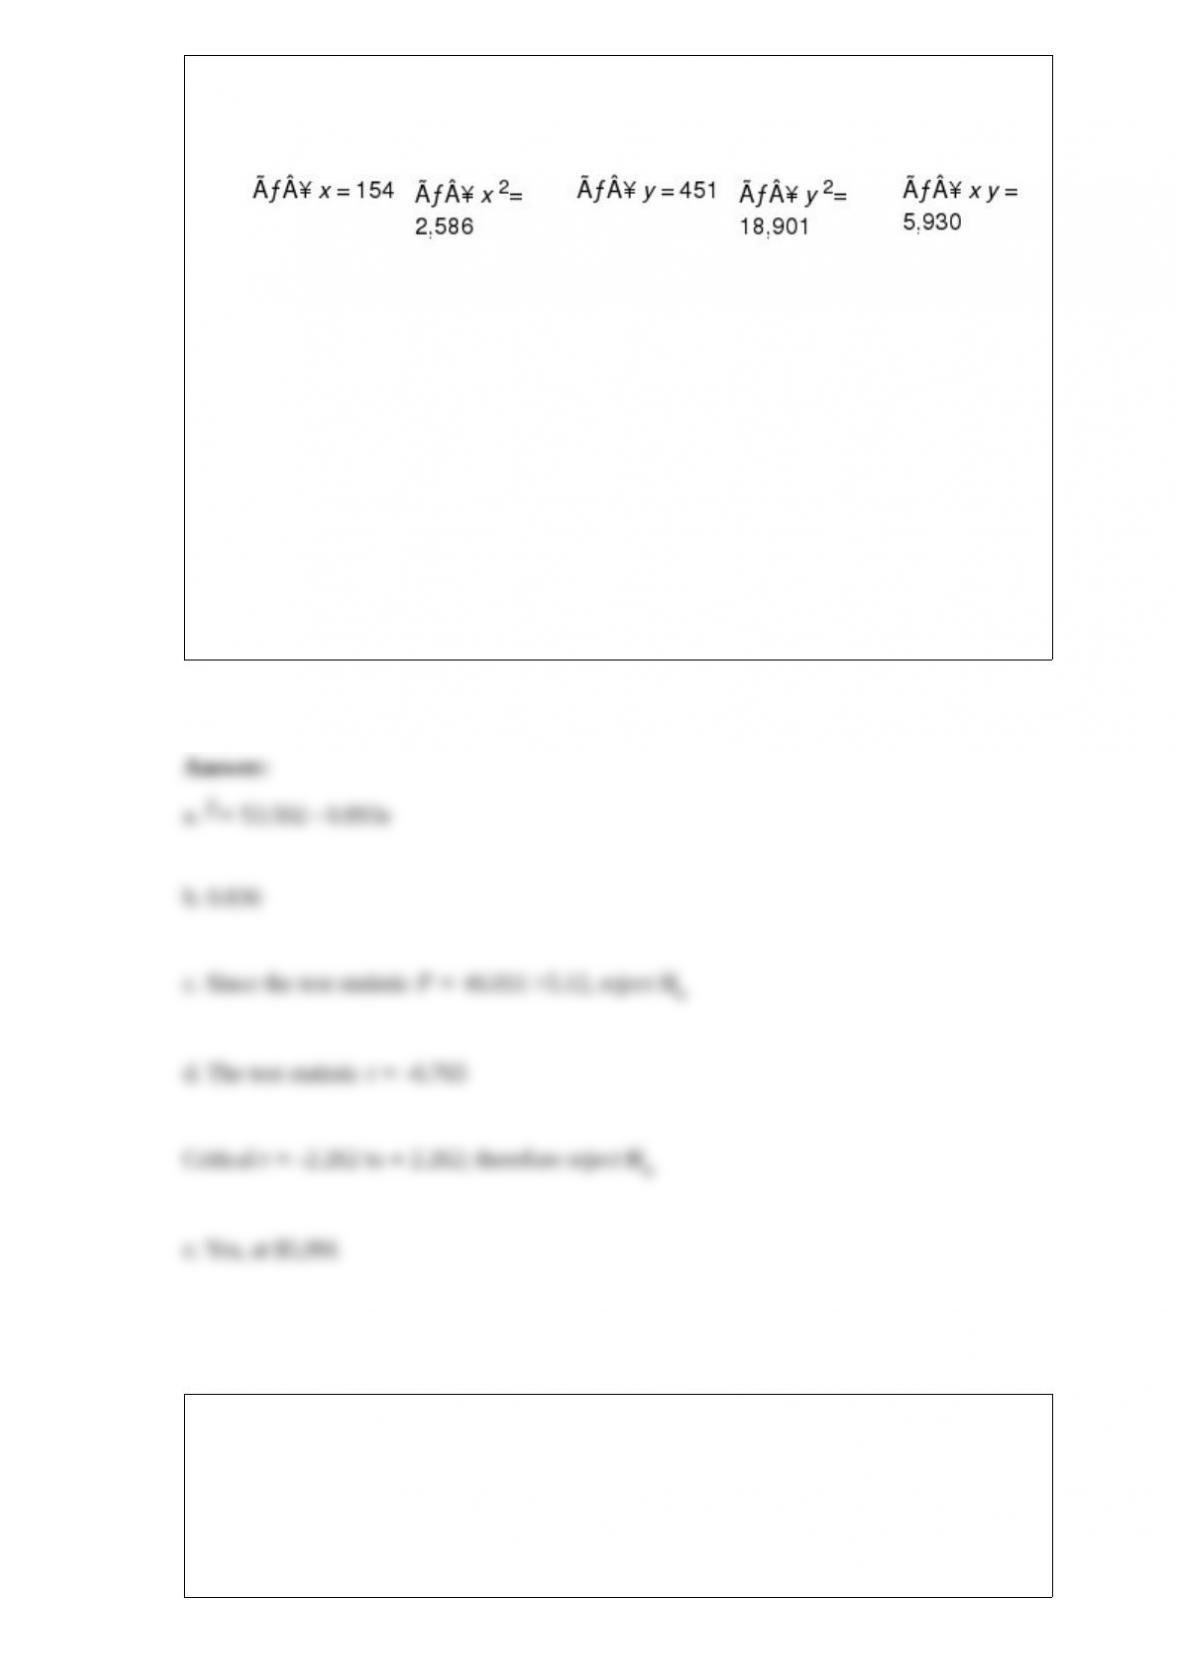
A company has recorded data on the daily demand for its product (y in thousands of
units) and the unit price (x in hundreds of dollars). A sample of 11 days demand and
associated price resulted in the following data.
a. Using the above information, develop the least-squares estimated regression line.
b. Compute the coefficient of determination.
c. Perform an F test and determine whether or not there is a significant relationship
between demand and unit price. Let 0.05.
d. Perform a t test to determine whether the slope is significantly different from zero.
Let 0.05.
e. Would the demand ever reach zero? If yes, at what price would the demand be zero?
Show your complete work.
In computing descriptive statistics for grouped data, the ____ are used to approximate
the data values in each class.
a. class lower limits
b. class upper limits
c. class midpoints
d. class ranges
A recent issue of a national magazine reported that in a national public opinion survey
conducted among 2,000 individuals, 56% were in favor of gun control, 40% opposed
gun control, and 4% had no opinion on the subject.
a. What is the sample in this survey?
b. Based on the sample, what percentage of the population would you think is in favor
of gun control?
c. Based on the sample, what percentage of the population would you think have no
opinion on the subject?
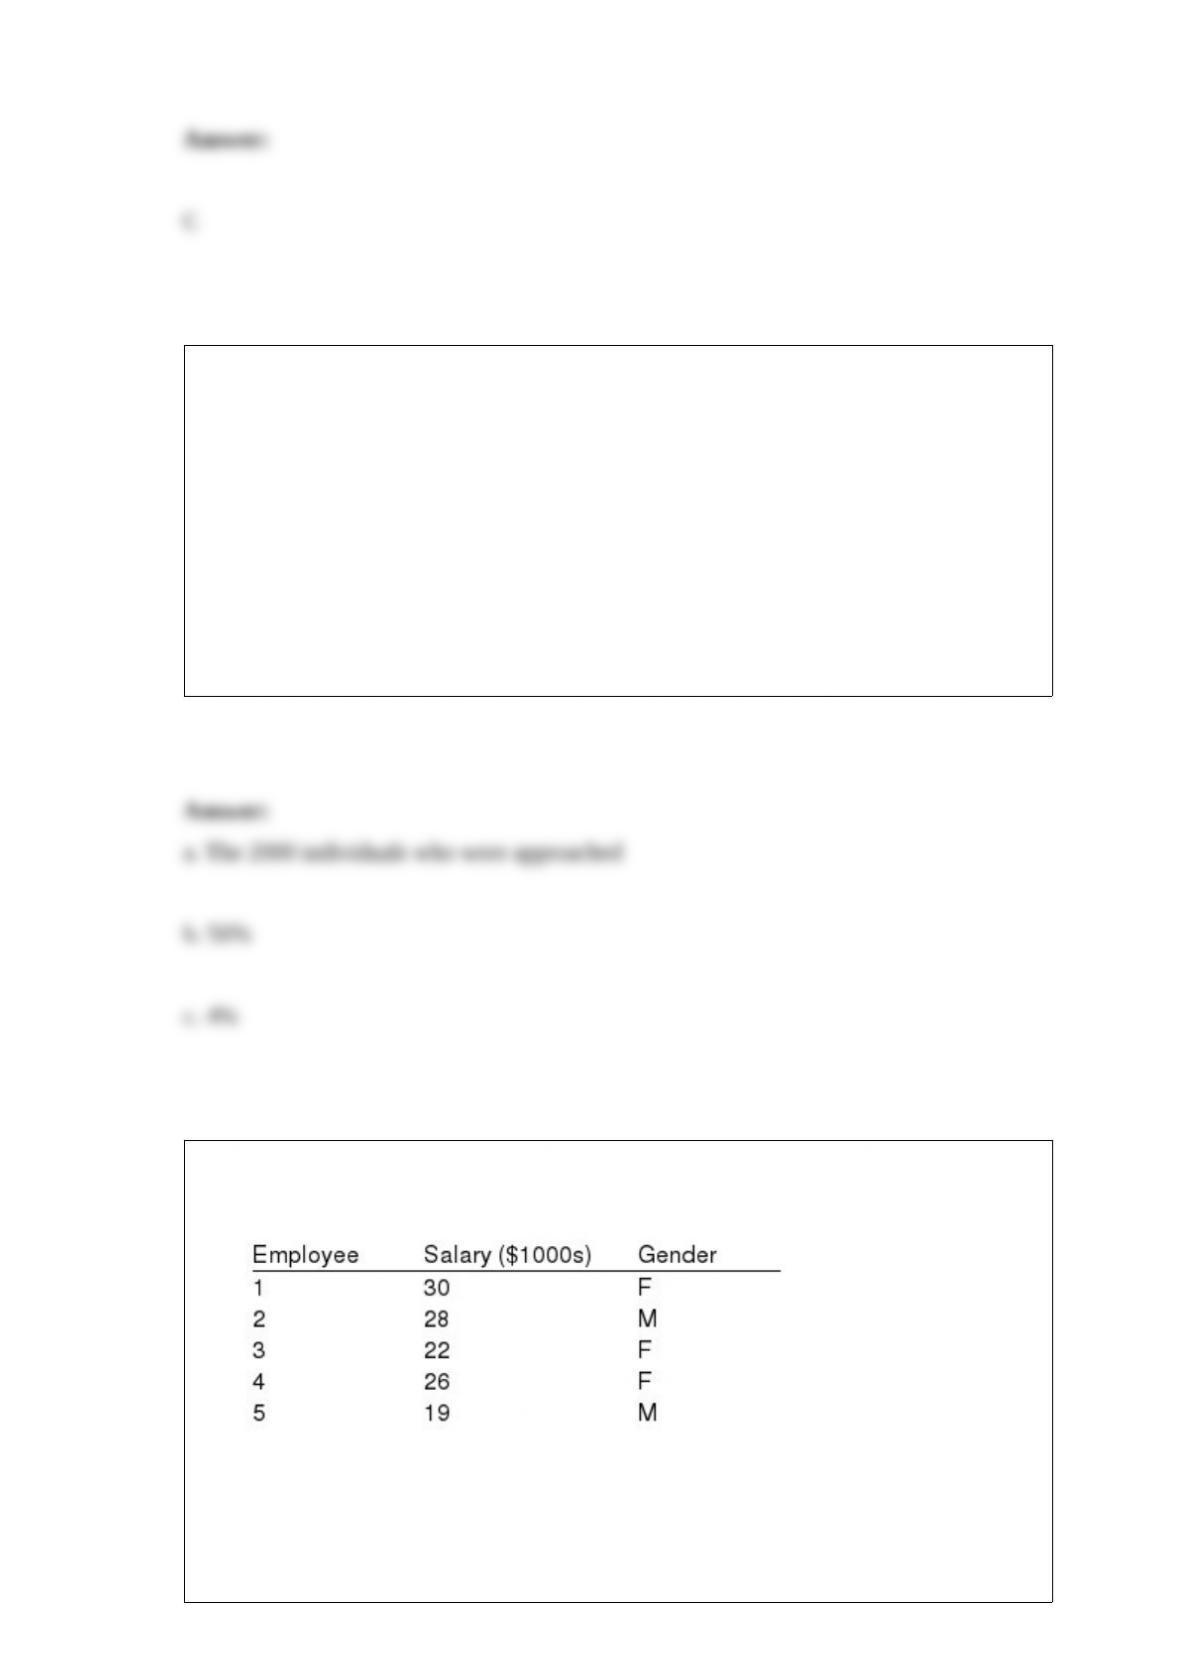
Starting salaries of a sample of five management majors along with their genders are
shown below.
a. What is the point estimate for the starting salaries of all management majors?
b. Determine the point estimate for the variance of the population.

c. Determine the point estimate for the proportion of male employees.
Exhibit 18-5
Forty-one individuals from a sample of 60 indicated they oppose legalized abortion. We
are interested in determining whether or not there is a significant difference between the
proportions of opponents and proponents of legalized abortion.
Refer to Exhibit 18-5. in this situation is
a. 60
b. 30
c. 41
d. 2
Assume you have noted the following prices for books and the number of pages that
each book contains.
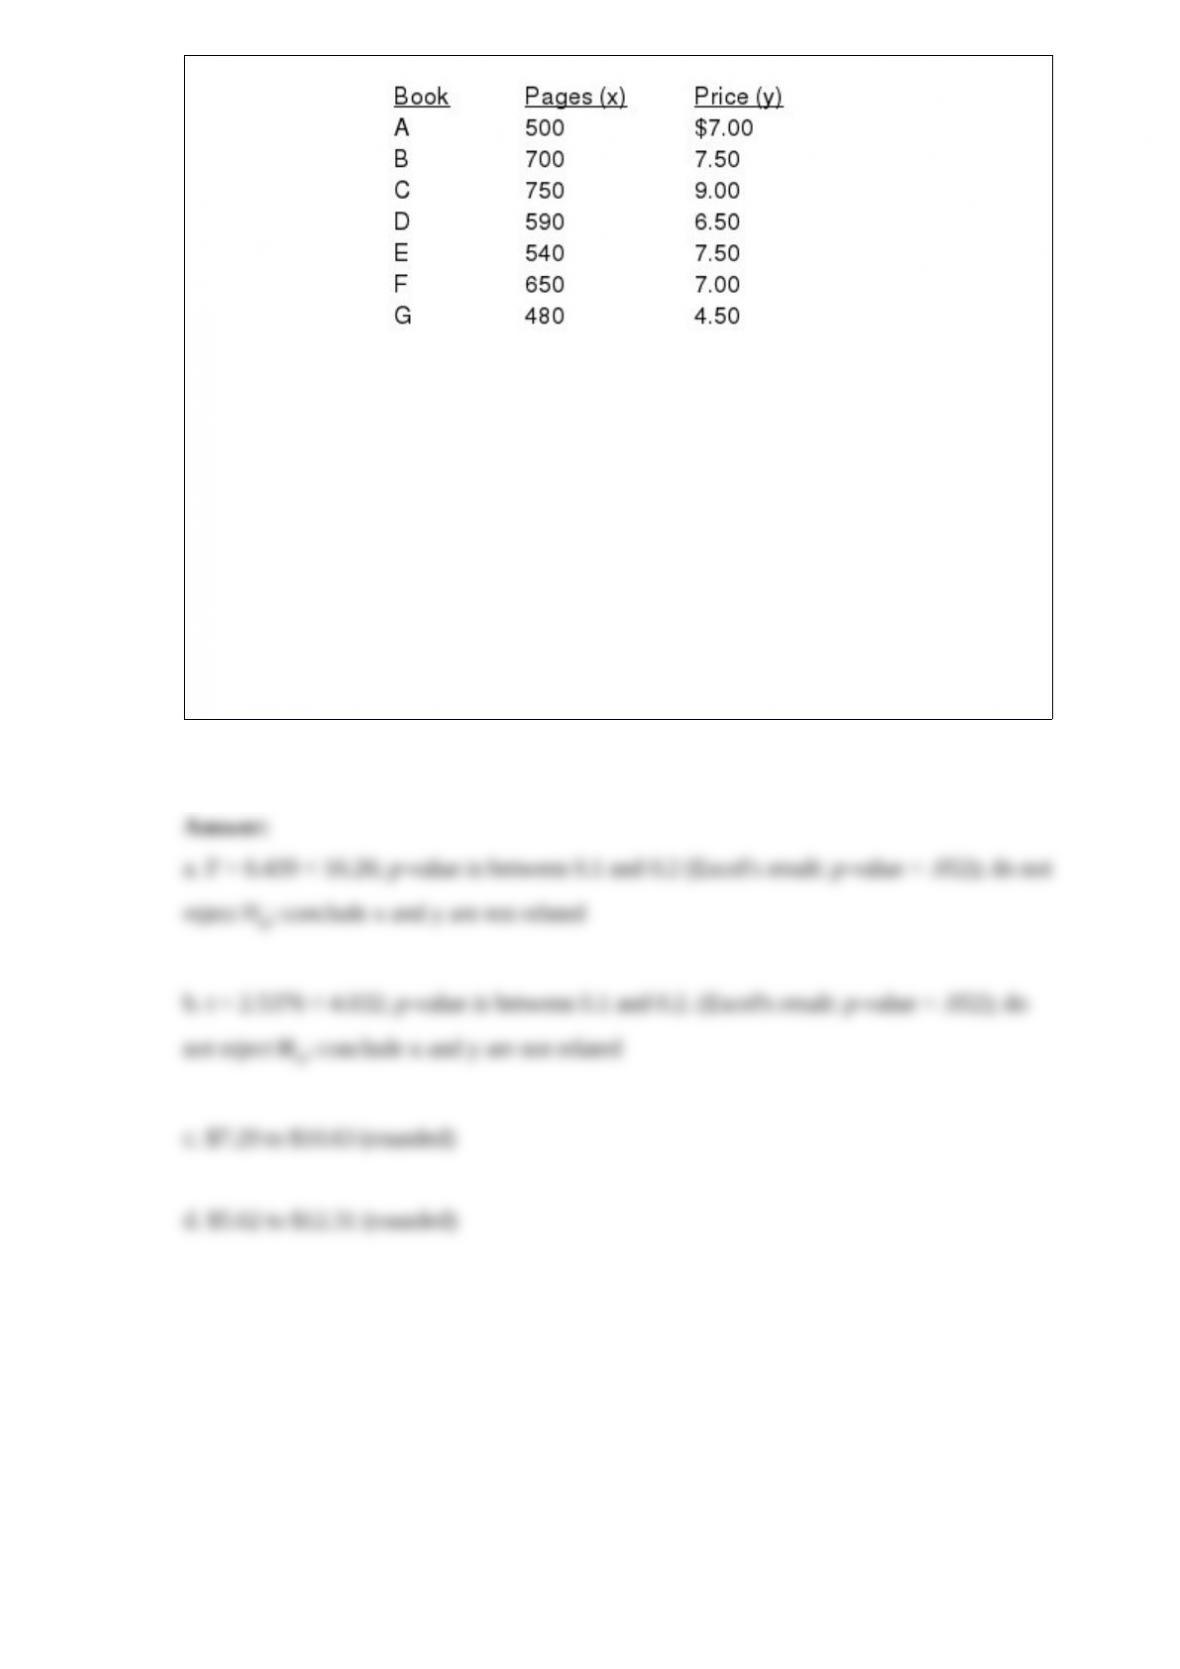
a. Perform an F test and determine if the price and the number of pages of the books are
related. Let = 0.01.
b. Perform a t test and determine if the price and the number of pages of the books are
related. Let = 0.01.
c. Develop a 90% confidence interval for estimating the average price of books that
contain 800 pages.
d. Develop a 90% confidence interval to estimate the price of a specific book that has
800 pages.