
A random sample of 25 statistics examinations was taken. The average score in the
sample was 76 with a variance of 144. Assuming the scores are normally distributed,
the 99% confidence interval for the population average examination score is
a. 70.02 to 81.98
b. 69.82 to 82.18
c. 70.06 to 81.94
d. 69.48 to 82.52
The chi-square value for a one-tailed test (lower tail) when the level of significance is
0.1 and the sample size is 15 is
a. 21.0642
b. 23.6848
c. 7.78453
d. 6.57063
A six-sided die is tossed 3 times. The probability of observing three ones in a row is
a. 1/3
b. 1/6
c. 1/27

d. 1/216
The sum of the frequencies in any frequency distribution always equals
a. the number of observations
b. 1.00
c. 100
d. the number of variables
Allied Corporation wants to increase the productivity of its line workers. Four different
programs have been suggested to help increase productivity. Twenty employees,
making up a sample, have been randomly assigned to one of the four programs and
their output for a day’s work has been recorded. You are given the results below.
a. State the null and alternative hypotheses.
b. Construct an ANOVA table.
c. As the statistical consultant to Allied, what would you advise them? Use a .05 level
of significance.
d. Use Fisher’s LSD procedure and determine which population mean (if any) is
different from the others. Let = .05.

Shoppers enter Hamilton Place Mall at an average of 120 per hour.
a. Define the random variable in words for this experiment.
b. What is the probability that exactly 5 shoppers will enter the mall between noon and
1:00 p.m.?
c. What is the probability that exactly 5 shoppers will enter the mall between noon and
12:05 p.m.?
d. What is the probability that at least 35 shoppers will enter the mall between 5:00 and
5:10 p.m.?

Categorical data
a. are always nonnumeric
b. may be either numeric or nonnumeric
c. are always numeric
d. indicate either how much or how many
If we consider the simple random sampling process as an experiment, the sample mean
is
a. always zero
b. always smaller than the population mean
c. a random variable
d. exactly equal to the population mean
The collection of all elements of interest in a particular study is
a. the population
b. the sampling
c. statistical inference
d. descriptive statistics
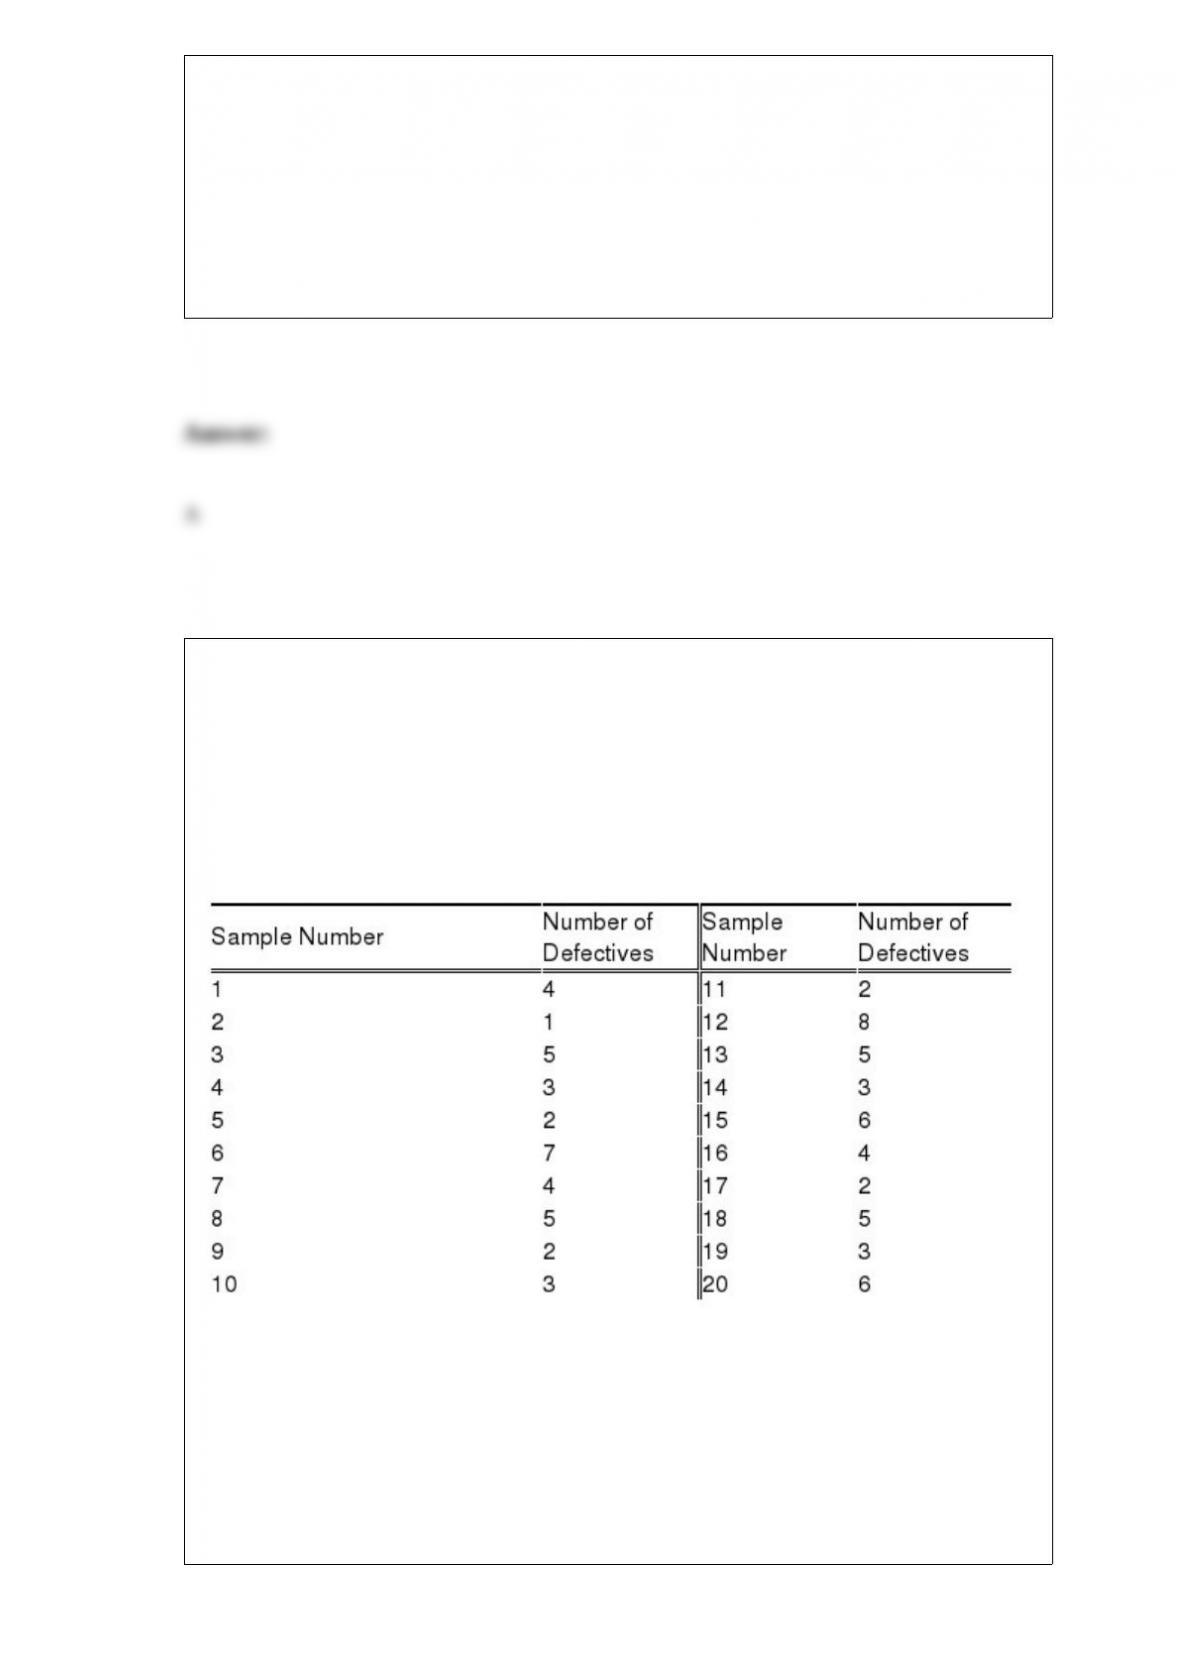
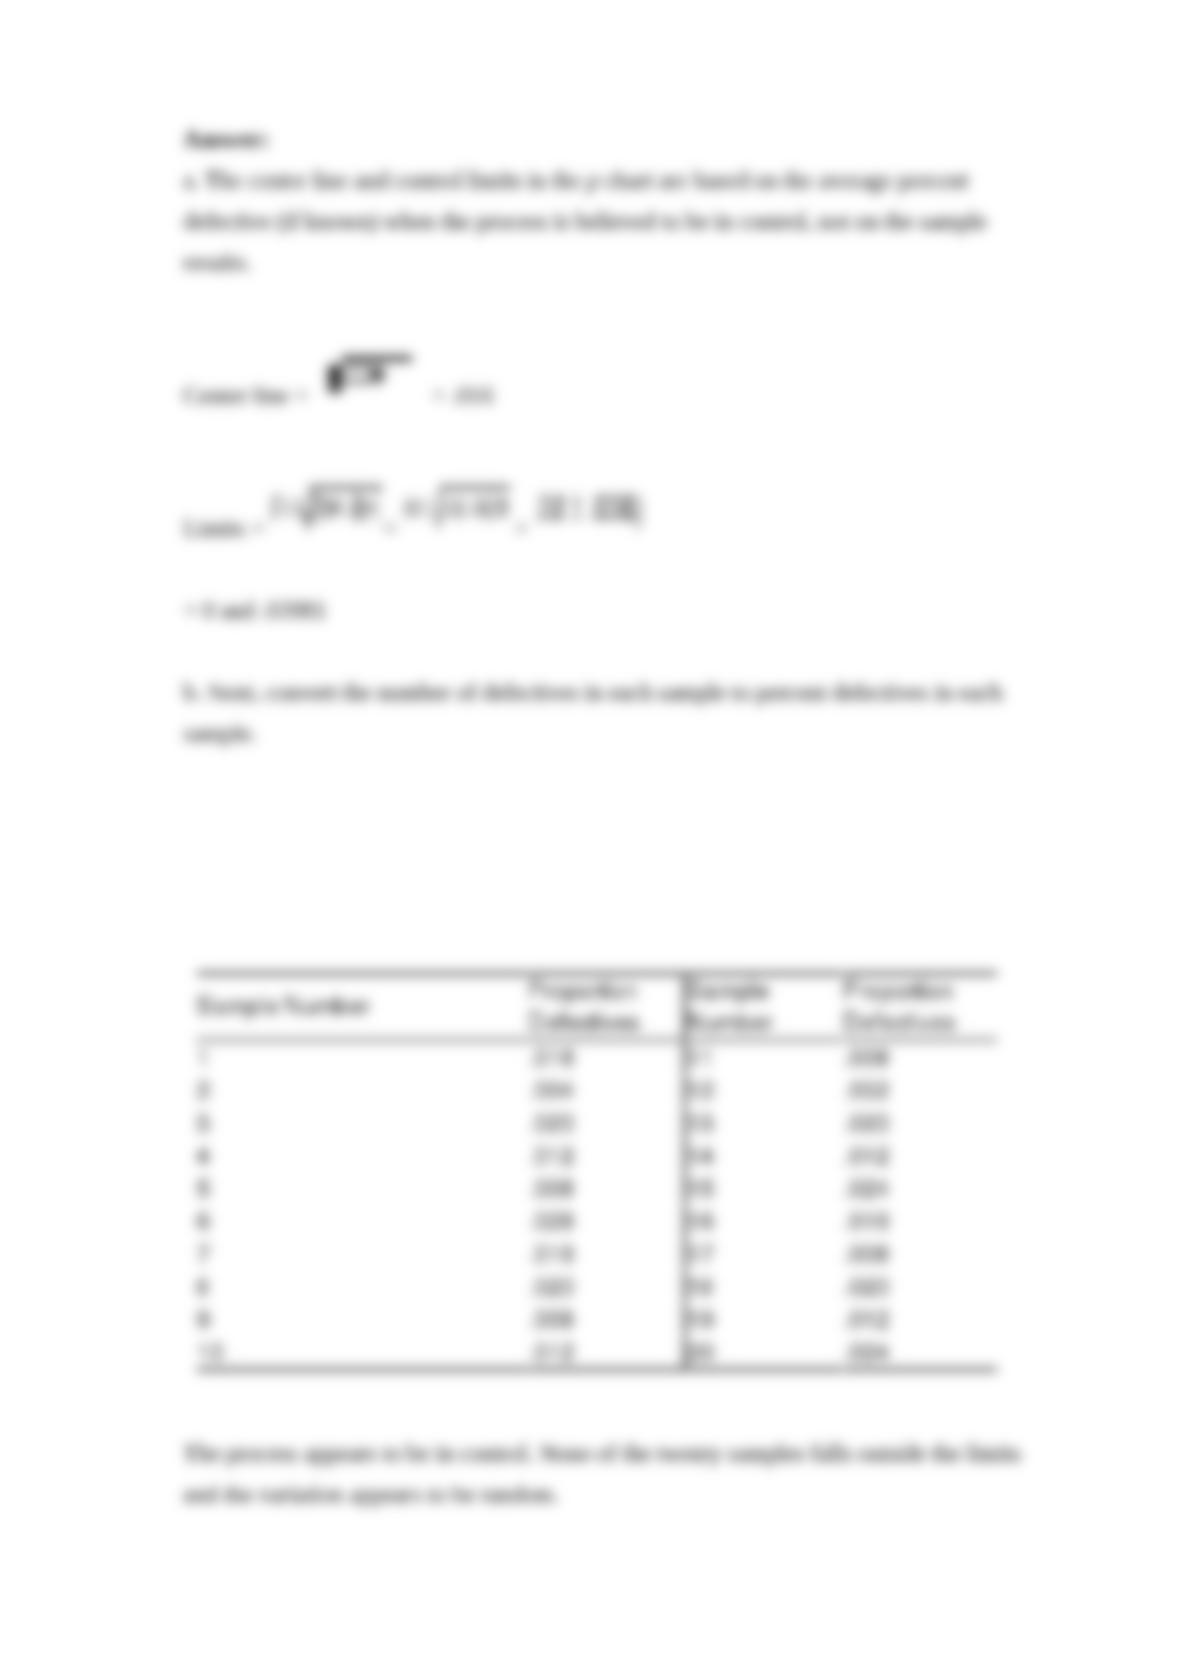
Every check cashed or deposited at Lincoln Bank must be encoded with the amount of
the check before it can begin the Federal Reserve clearing process. The accuracy of the
check encoding process is of utmost importance. If there is any discrepancy between
the amount a check is made out for and the encoded amount, the check is defective.
Twenty samples, each consisting of 250 checks, were selected and examined. The
number of defective checks found in each sample is shown below.
The manager of the check encoding department knows from past experience that when
the encoding process is in control, an average of 1.6% of the encoded checks are
defective.
a. Determine the center line and the 3-sigma control limits for the p chart.
b. Plot the twenty recent sample findings on the chart and decide if the check encoding
operation is in control.
The Poisson probability distribution is a
a. continuous probability distribution
b. discrete probability distribution
c. uniform probability distribution
d. normal probability distribution
The following estimated regression equation has been developed for the relationship
between y, the dependent variable, and x, the independent variable.
The sample size for this regression model was 23, and SSR = 600 and SSE = 400.
If a hypothesis test leads to the rejection of the null hypothesis, a
a. Type II error must have been committed
b. Type II error may have been committed
c. Type I error must have been committed

d. Type I error may have been committed
Data that indicate how much or how many are known as
a. categorical data
b. quantitative data
c. label data
d. category data
A list of the sampling units for a study is
a. the sampled population
b. called the frame
c. the same as the sample
d. the sample space
Excel’s NORM.S.DIST function can be used to compute

a. cumulative probabilities for a standard normal z value
b. the standard normal z value given a cumulative probability
c. cumulative probabilities for a normally distributed x value
d. the normally distributed x value given a cumulative probability
Exhibit 16-4
In a laboratory experiment, data were gathered on the life span (y in months) of 33 rats,
units of daily protein intake (x1), and whether or not agent x2 (a proposed life extending
agent) was added to the rats diet (x2 = 0 if agent x2 was not added, and x2 = 1 if agent
was added.) From the results of the experiment, the following regression model was
developed.
= 36 + 0.8x1 – 1.7x2
Also provided are SSR = 60 and SST = 180.
Refer to Exhibit 16-4. The life expectancy of a rat that was given 3 units of protein
daily, and who took agent x2 is
a. 36.7
b. 36
c. 49
d. 38.4
In a hypothesis test about two population variances, the test statistic F is
computed as

a. 1/(s12/s22)
b. s12/s22
c. 1/(σ12/σ22)
d. σ12/σ22
The control limits for an np chart are how many standard deviations above and below
the expected number of defectives?
a. one
b. two
c. three
d. four