
The exponential probability distribution is used with
a. a discrete random variable
b. a continuous random variable
c. any probability distribution with an exponential term
d. an approximation of the binomial probability distribution
We can examine the effect of the sampling plan on both types of risks by varying the
assumed
a. percentage of defective items in the lot
b. number of defective items in the sample
c. probability of accepting the lot
d. number of units in the lot
The advantage of nonprobabilistic sampling is that it is inexpensive and
a. provides statistically valid statements about the precision of the estimate
b. can provide valid parameter estimates

c. is error free
d. None of these alternatives is correct.
Below you are given the first four values of a time series.
Using a 4-period moving average, the forecasted value for period 5 is
a. 2.5
b. 17
c. 20
d. 10
Excel’s __________ function can be used to calculate a p-value for a hypothesis test.
a. RAND
b. NORM.S.DIST
c. NORM.S.INV

d. Not enough information is given to answer this question.
The difference between the lower class limits of adjacent classes provides the
a. number of classes
b. class limits
c. class midpoint
d. class width
A single numerical value used as an estimate of a population parameter is known as
a. a parameter
b. a population parameter
c. both a parameter or a population parameter are correct
d. a point estimate
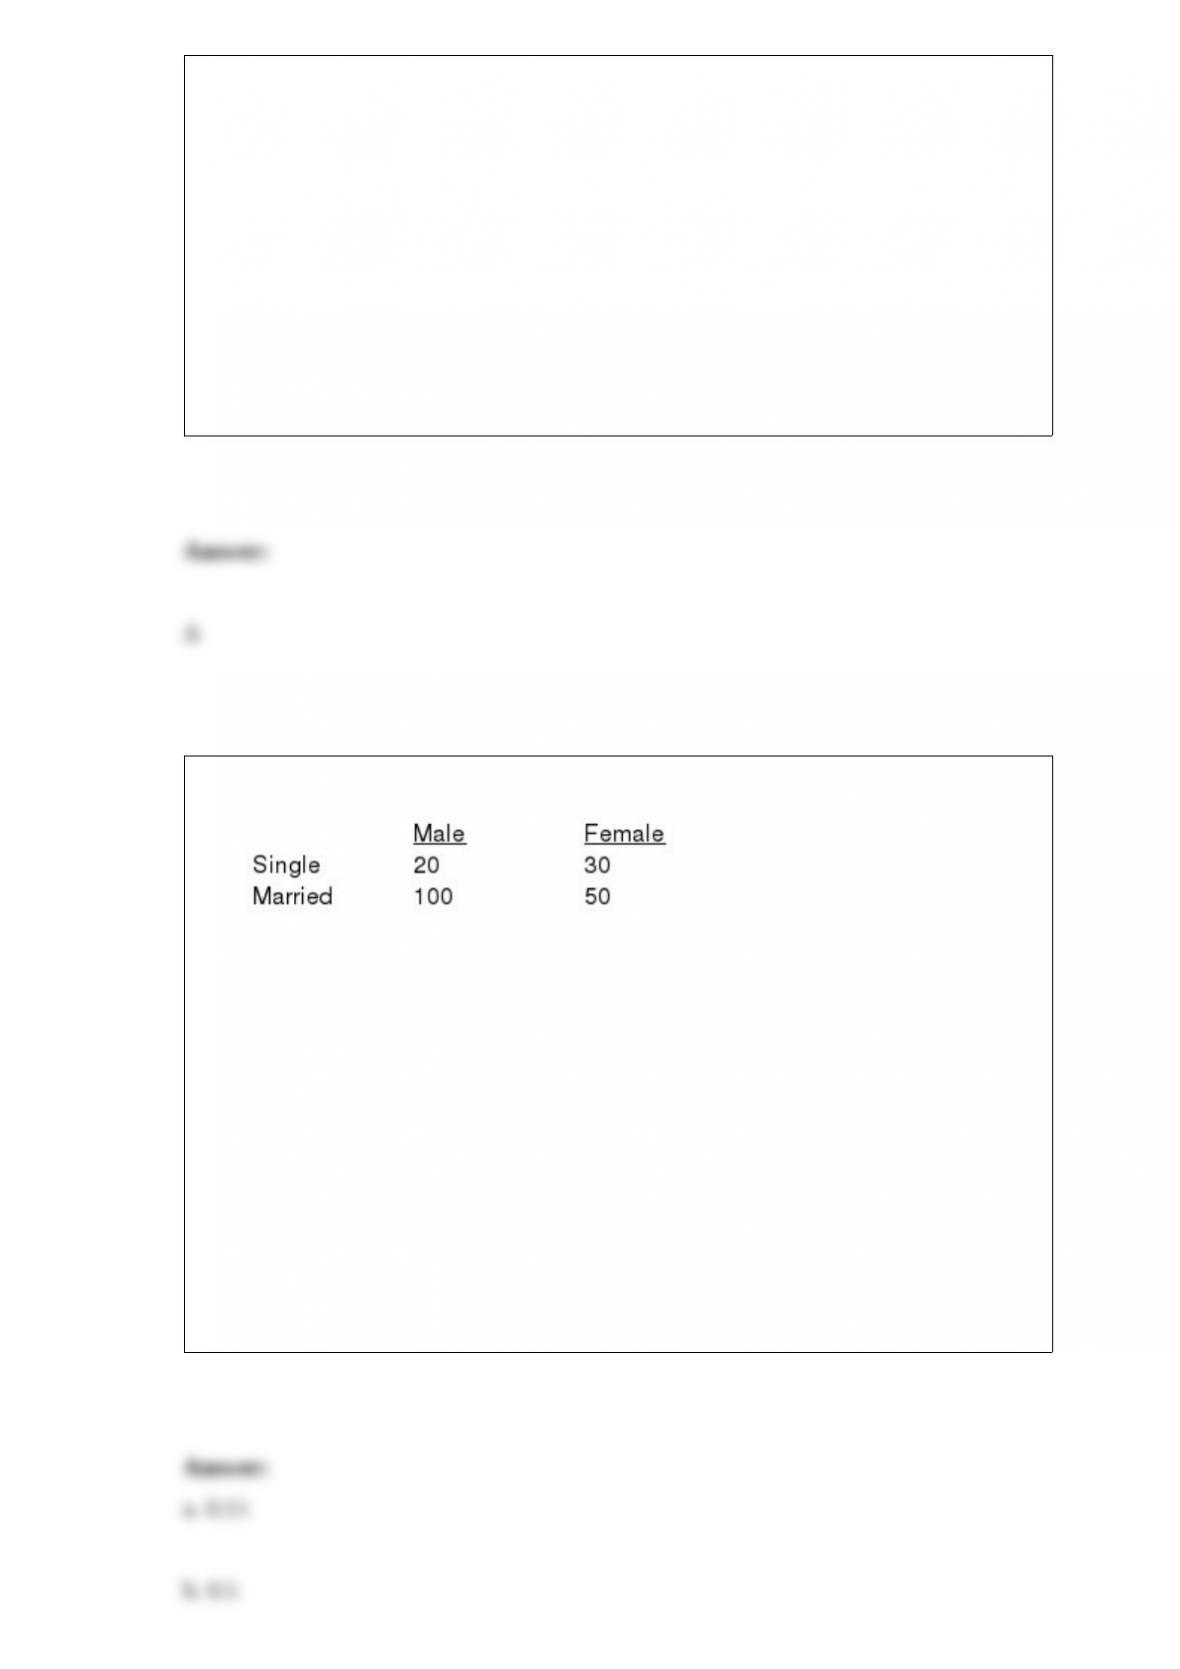
Exhibit 13-4
In a completely randomized experimental design involving five treatments, thirteen
observations were recorded for each of the five treatments. The following information
is provided.
SSTR = 200 (Sum Square Between Treatments)
SST = 800 (Total Sum Square)
Refer to Exhibit 13-4. If at a 5% level of significance we want to determine whether or
not the means of the five populations are equal, the critical value of F is
a. 2.53
b. 19.48
c. 4.98
d. 39.48
A bank has the following data on the gender and marital status of 200 customers.
a. What is the probability of finding a single female customer?
b. What is the probability of finding a married male customer?
c. If a customer is female, what is the probability that she is single?
d. What percentage of customers is male?
e. If a customer is male, what is the probability that he is married?
f. Are gender and marital status mutually exclusive?
g. Is marital status independent of gender? Explain using probabilities.
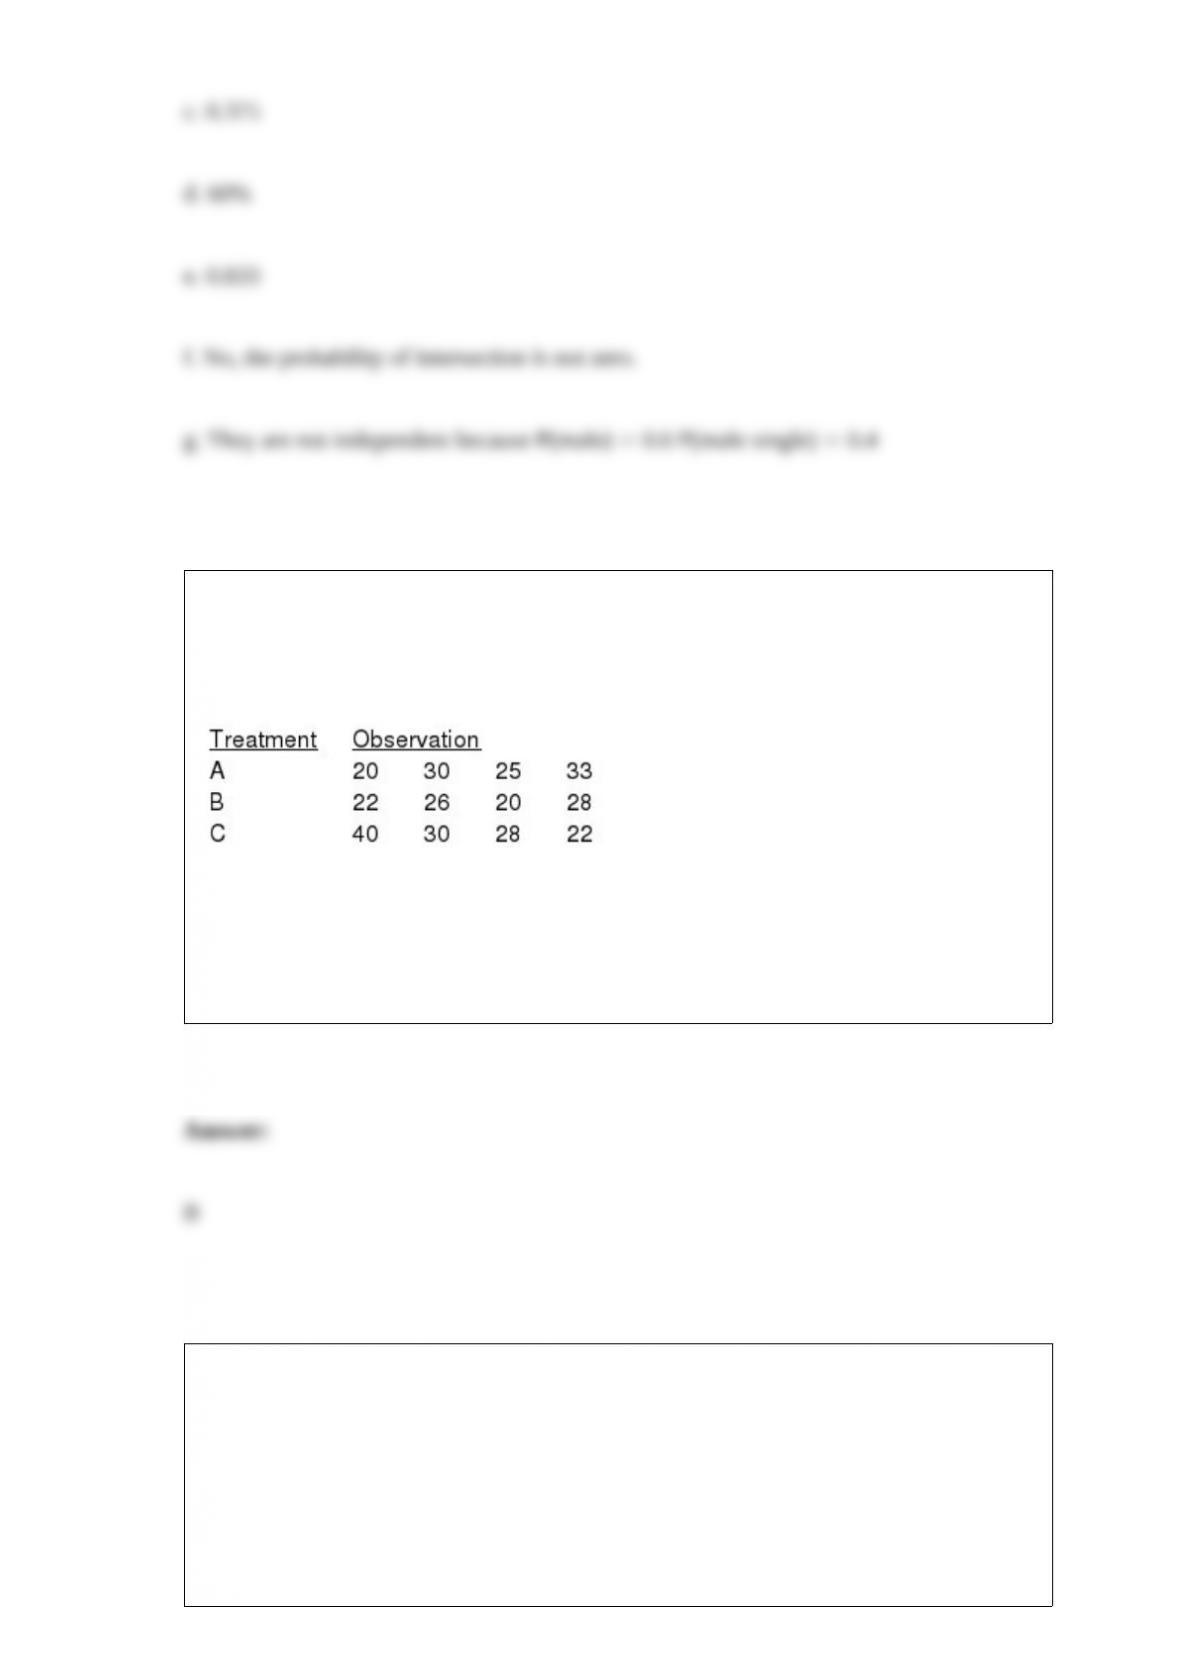
Exhibit 13-3
To test whether or not there is a difference between treatments A, B, and C, a sample of
12 observations has been randomly assigned to the 3 treatments. You are given the
results below.
Refer to Exhibit 13-3. The null hypothesis
a. should be rejected
b. should not be rejected
c. should be revised
d. None of these alternatives is correct.
A property of the exponential distribution is that the mean equals the
a. mode
b. median
c. variance
d. standard deviation
The probability density function for a uniform distribution ranging between 2 and 6 is
a. 4
b. undefined
c. any positive value
d. 0.25
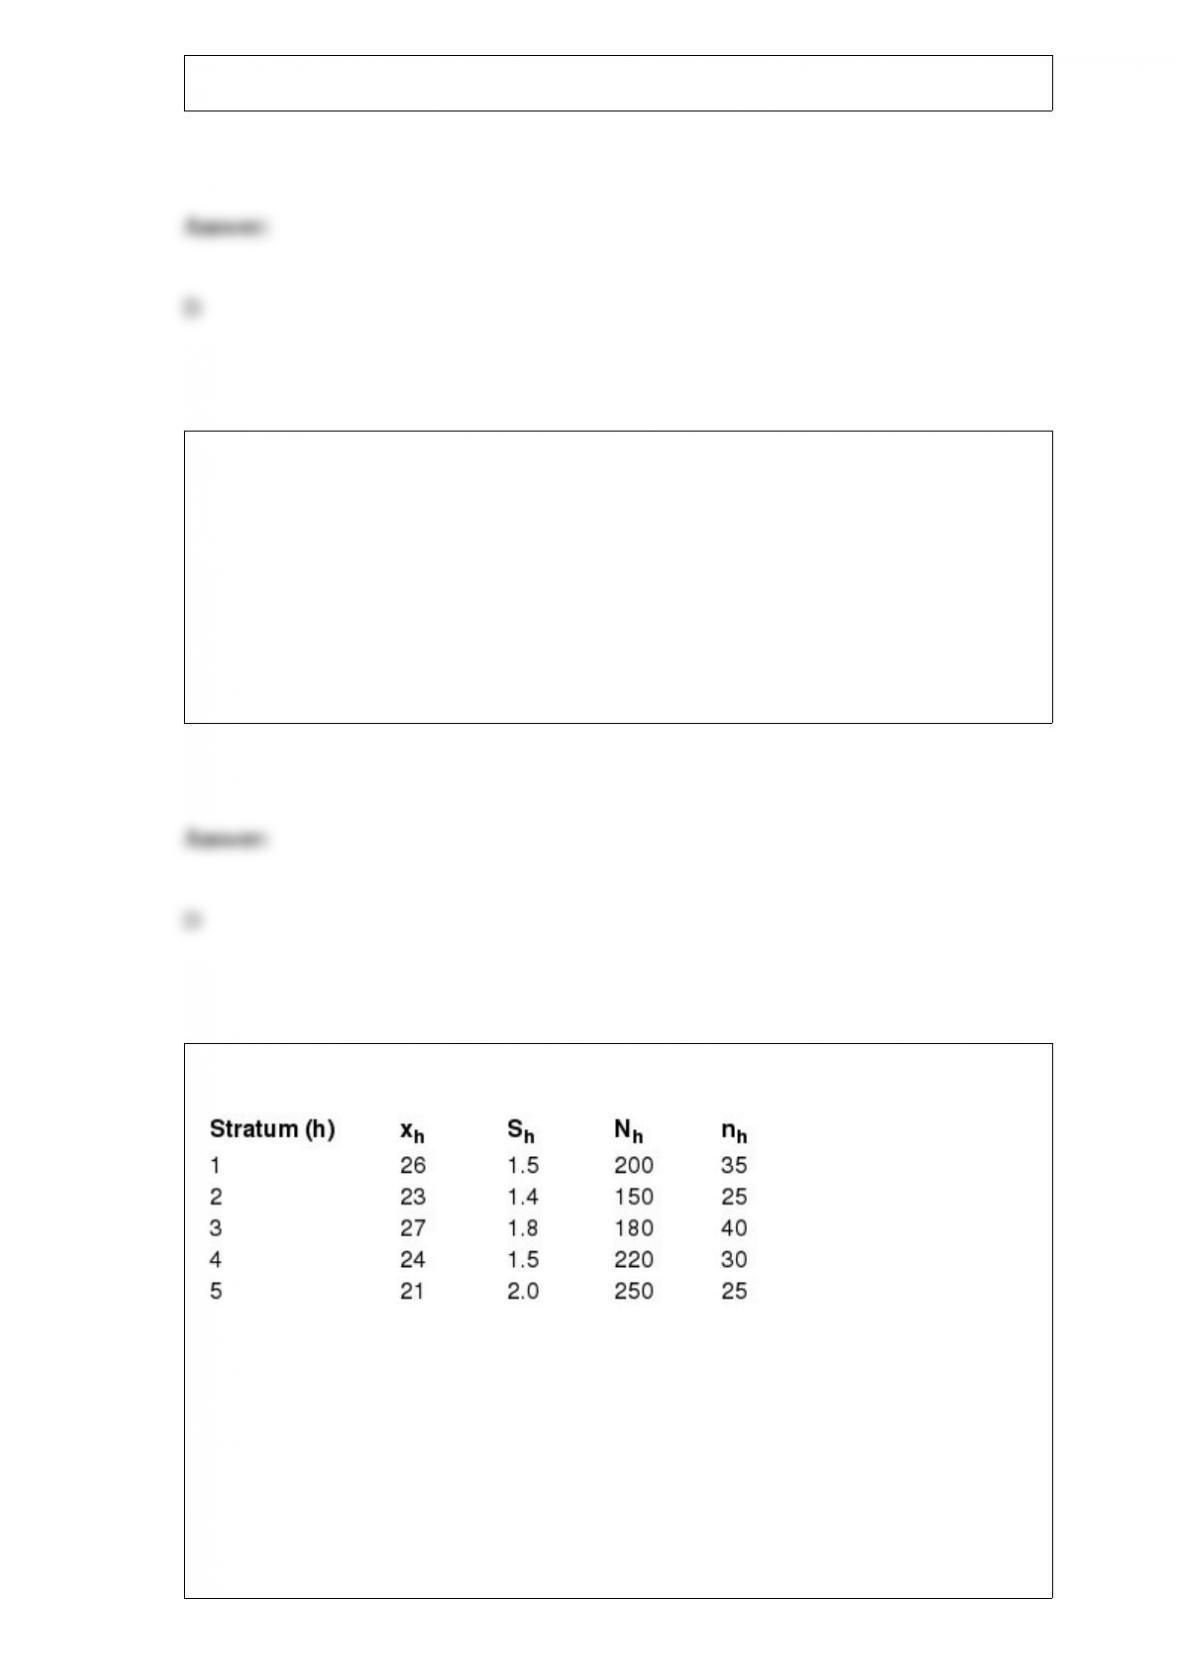
A stratified simple random sample has been taken with the following results.
a. Determine a point estimate for the mean of the population.
b. Estimate the standard error of the mean.
c. Approximate a 95% confidence interval for the population mean.
d. Compute the population total.

e. Determine a 95% confidence interval for the population total.
A major department store has determined that its customers charge an average of $500
per month, with a standard deviation of $80. Assume the amounts of charges are
normally distributed.
a. What percentage of customers charges more than $380 per month?
b. What percentage of customers charges less than $340 per month?
c. What percentage of customers charges between $644 and $700 per month?
A p-value is the
a. probability, when the null hypothesis is true, of obtaining a sample result that is at
least as unlikely as what is observed

b. value of the test statistic
c. probability of a Type II error
d. probability corresponding to the critical value(s) in a hypothesis test
Exhibit 9-2
The manager of a grocery store has taken a random sample of 100 customers. The
average length of time it took the customers in the sample to check out was 3.1 minutes.
The population standard deviation is known to be 0.5 minutes. We want to test to
determine whether or not the mean waiting time of all customers is significantly more
than 3 minutes.
Refer to Exhibit 9-2. At a .05 level of significance, it can be concluded that the mean of
the population is
a. significantly greater than 3
b. not significantly greater than 3
c. significantly less than 3
d. significantly greater then 3.18
Exhibit 18-3
A company advertises that food preparation time can be significantly reduced with the
Handy Dandy Slicer. A sample of 12 individuals prepared the ingredients for a meal

with and without the slicer. You are given the preparation times below.
Refer to Exhibit 18-3. The test statistic equals
a. -0.812 or 0.812
b. -0.889 or 0.889
c. -10 or 10
d. -20 or 20