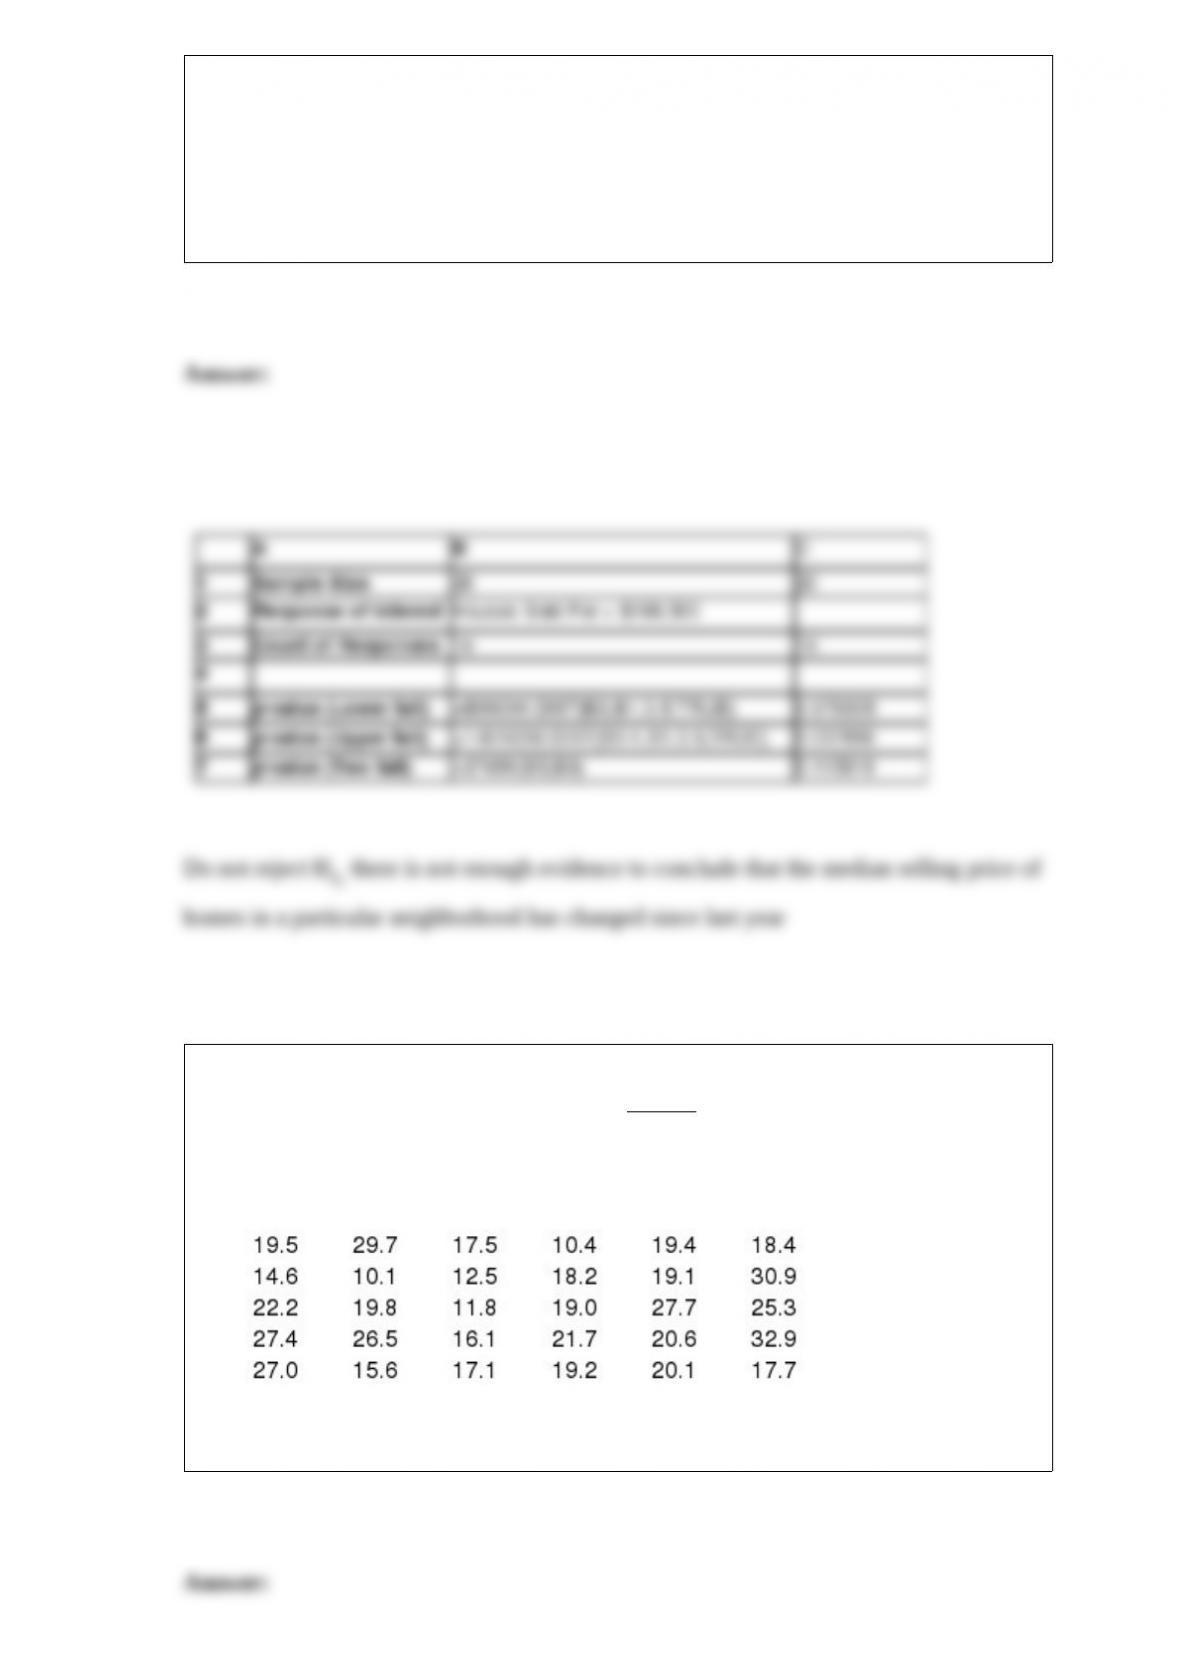
A real estate agency conducts a study to determine if the median selling price of homes
in a particular neighborhood has changed since last year. Last year the median selling
price was $188,500. The agency randomly selects 20 recently sold homes in that
particular neighborhood and finds that 14 of the homes sold for more than $188,500 and
that 6 of the homes sold for less than $188,500. Use Excel to conduct the appropriate
hypothesis test at = .10.
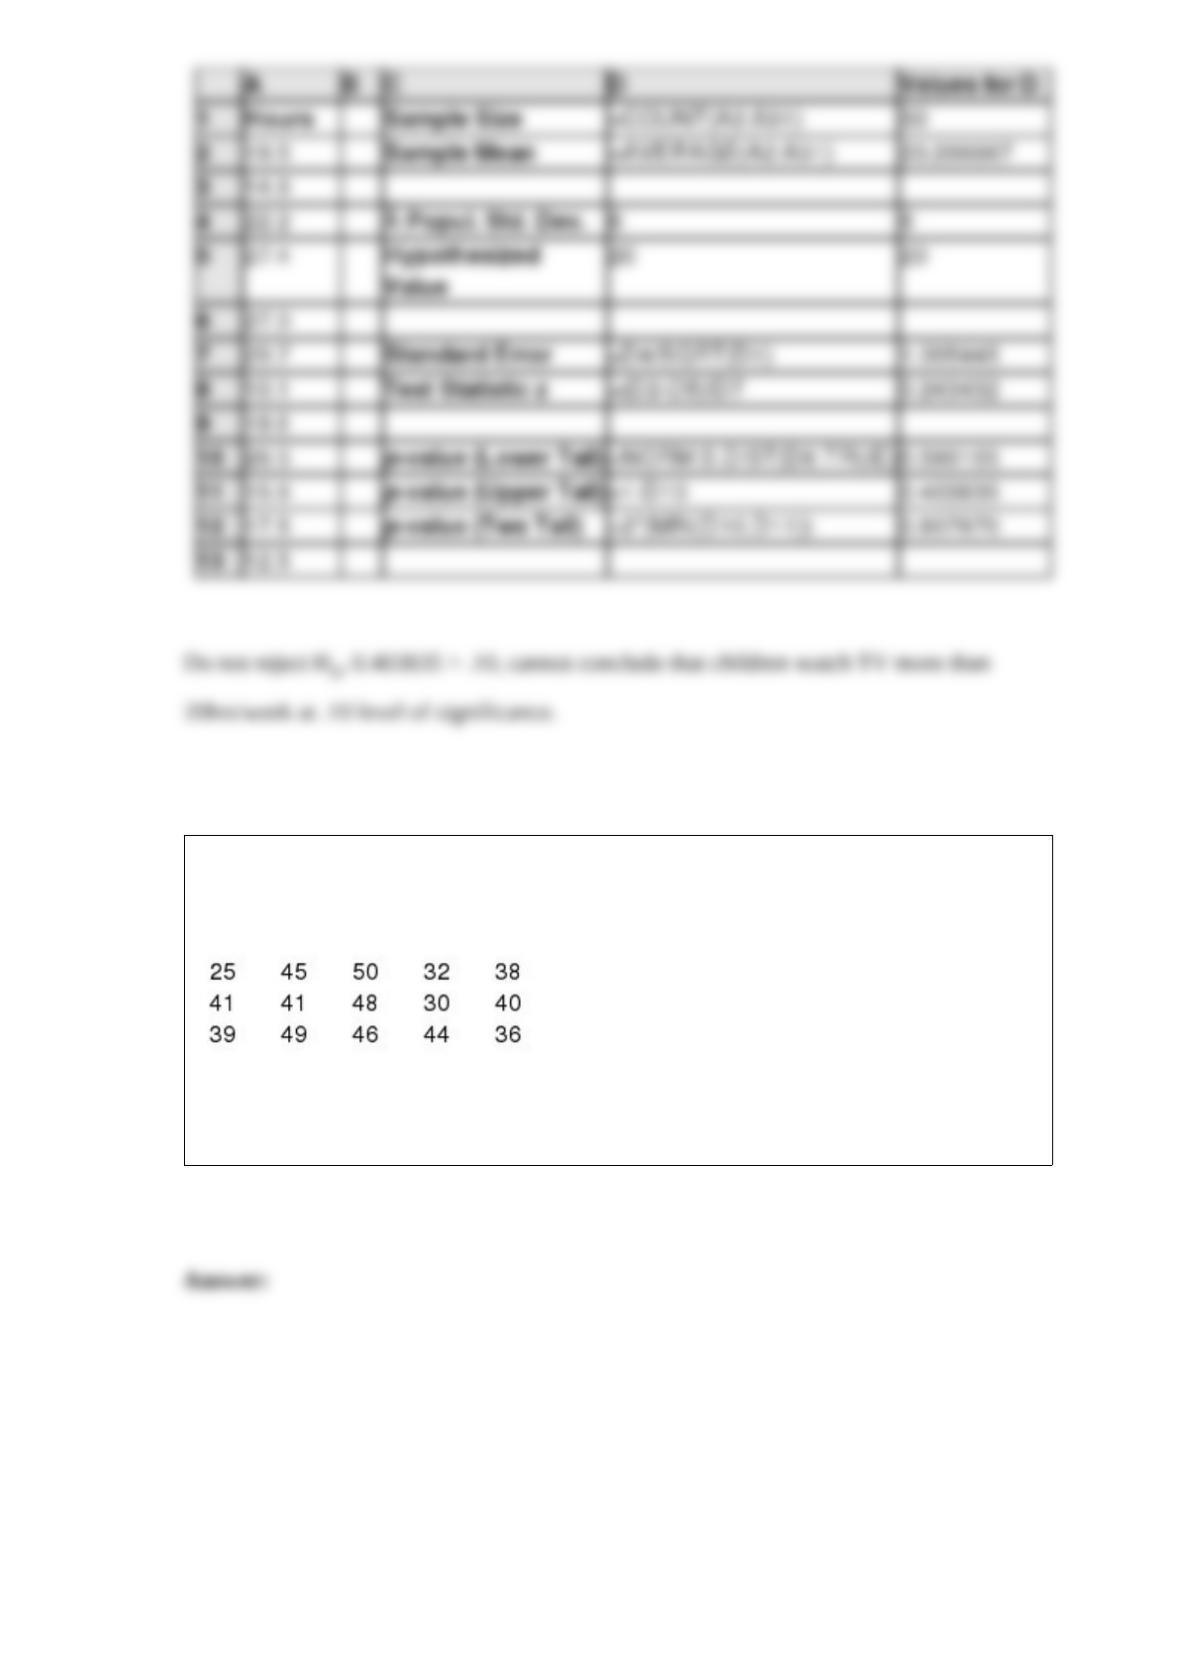
The sponsors of televisions shows targeted at the market of 5 – 8 year olds want to test
the hypothesis that children watch television at most 20 hours per week. The population
of viewing hours per week is known to be normally distributed with a standard
deviation of 6 hours. A market research firm conducted a random sample of 30 children
in this age group. The resulting data follows:
At a .10 level of significance, use Excel to test the sponsors’ hypothesis.
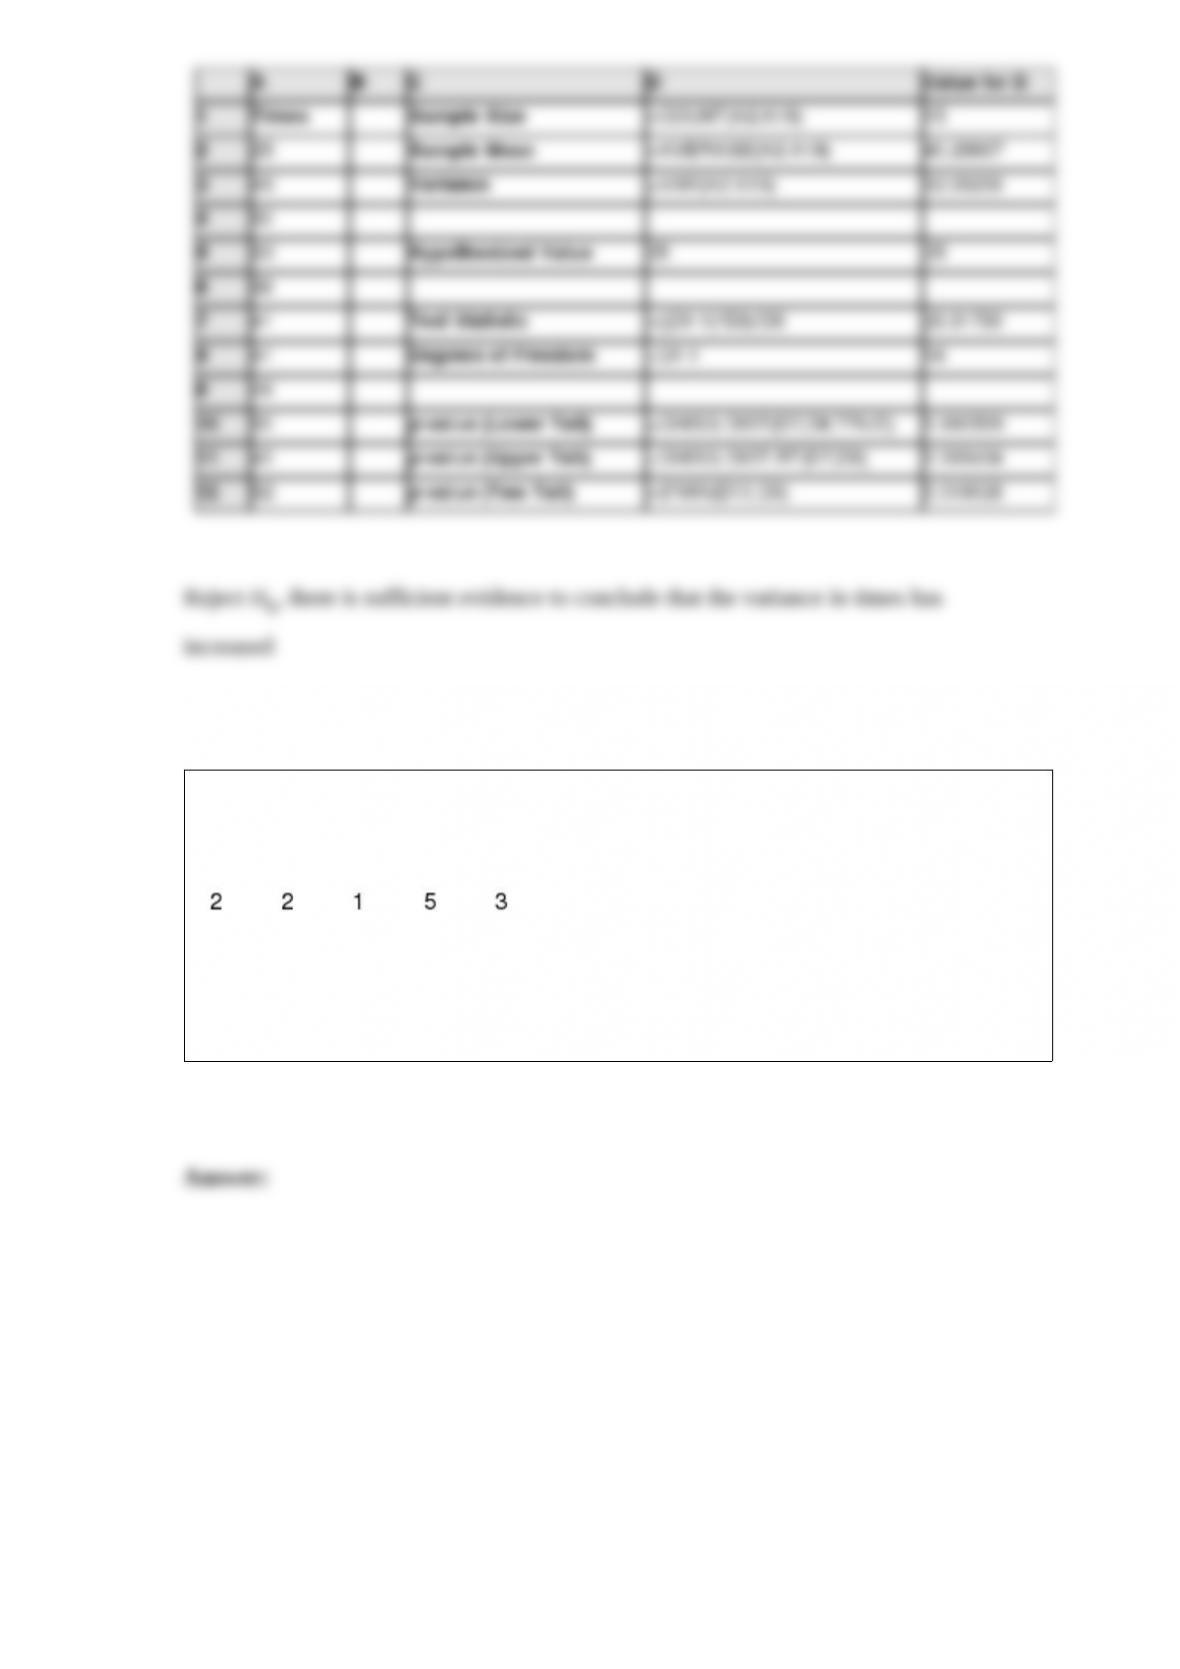
A professor believes the variability in time to complete tests has increased. In the past,
the variance in minutes to complete a particular test was 25. The time it takes to
complete a test was recorded for a sample of 15 students. The results follow.
Use Excel to determine if the variance in times has increased. Use a .02 level of
significance.
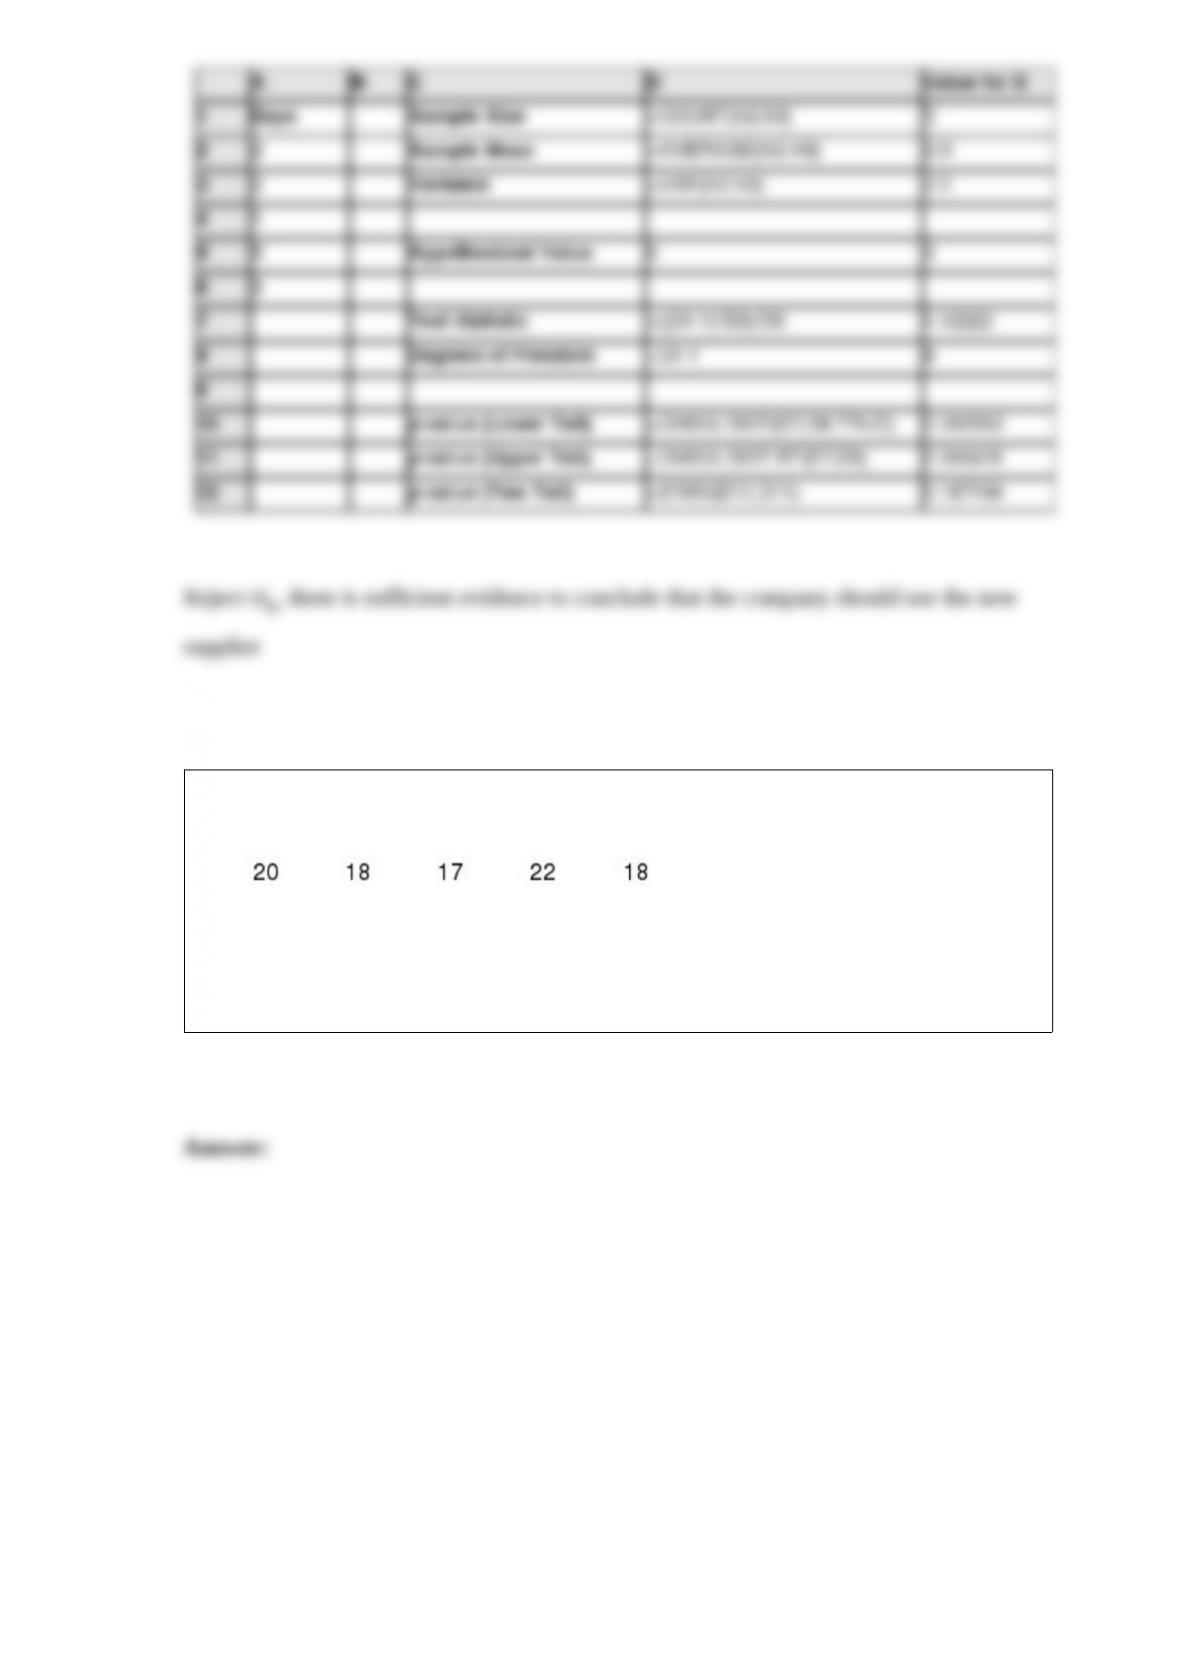
A manufacturing company is considering changing suppliers of a particular raw
material. The standard deviation of days until delivery for the current supplier is 3. A
sample of 5 delivery times is taken from the new supplier. The data follow:
The manufacturing company will use the new supplier if the variance in delivery time is
less than that of the current supplier. Use Excel to determine whether the company
should use the new supplier? Use a 10% level of significance.
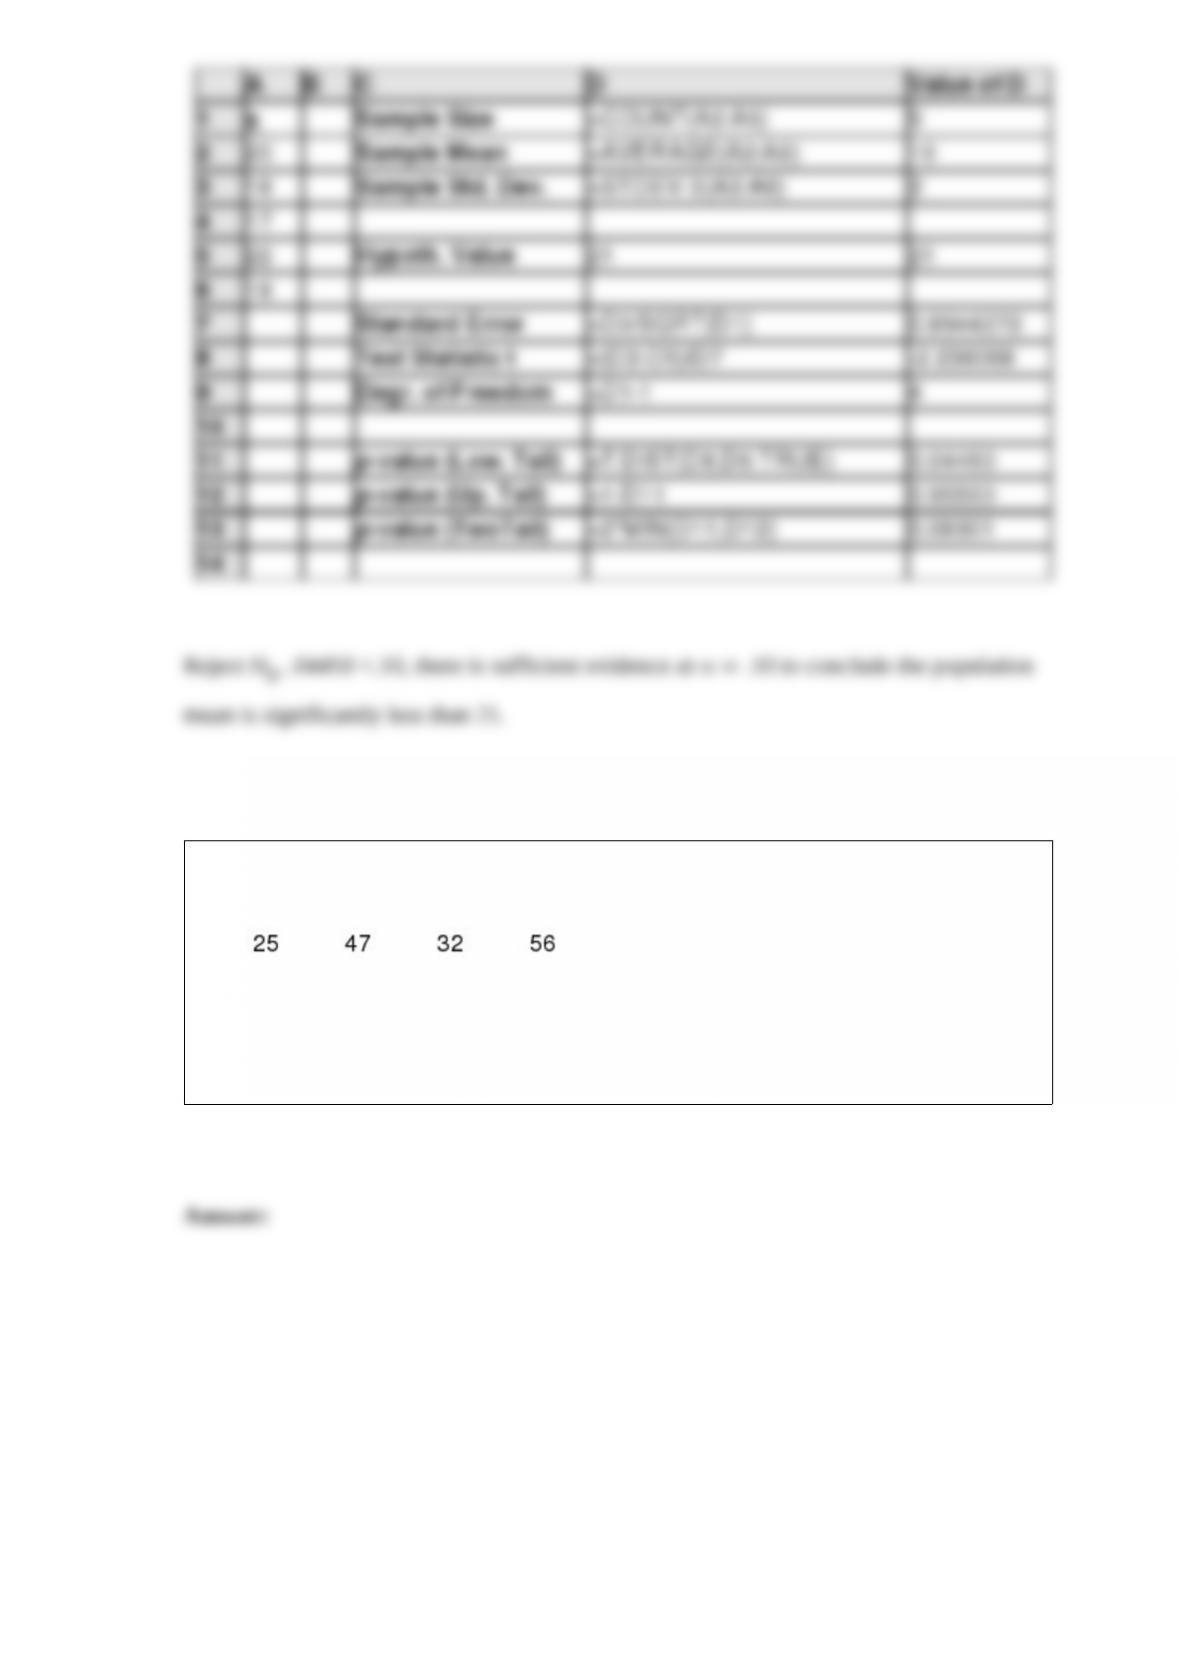
You are given the following information obtained from a random sample of 5
observations.
At a 10% level of significance, use Excel to determine whether or not the mean of the
population from which this sample was taken is significantly less than 21. (Assume the
population is normally distributed.)
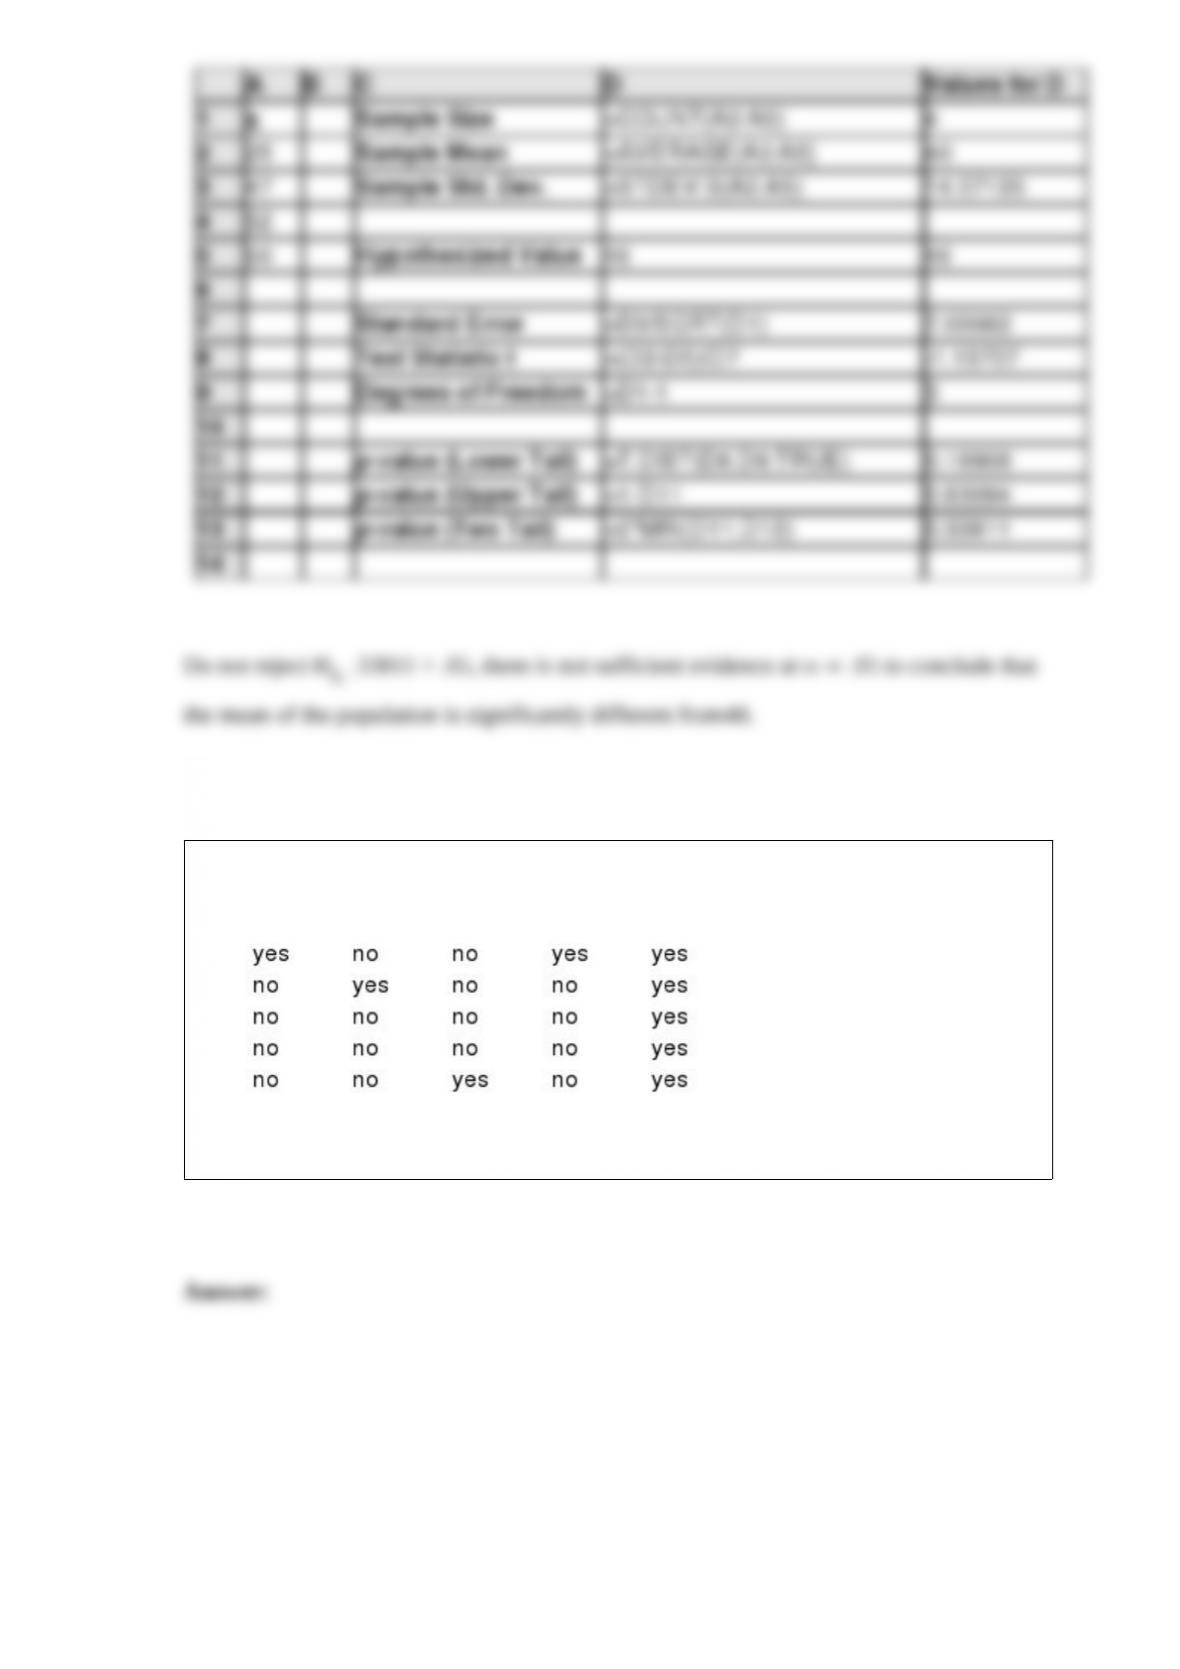
You are given the following information obtained from a random sample of 4
observations.
At a .05 level of significance, use Excel to determine whether or not the mean of the
population from which this sample was taken is significantly different from 48.
(Assume the population is normally distributed.)
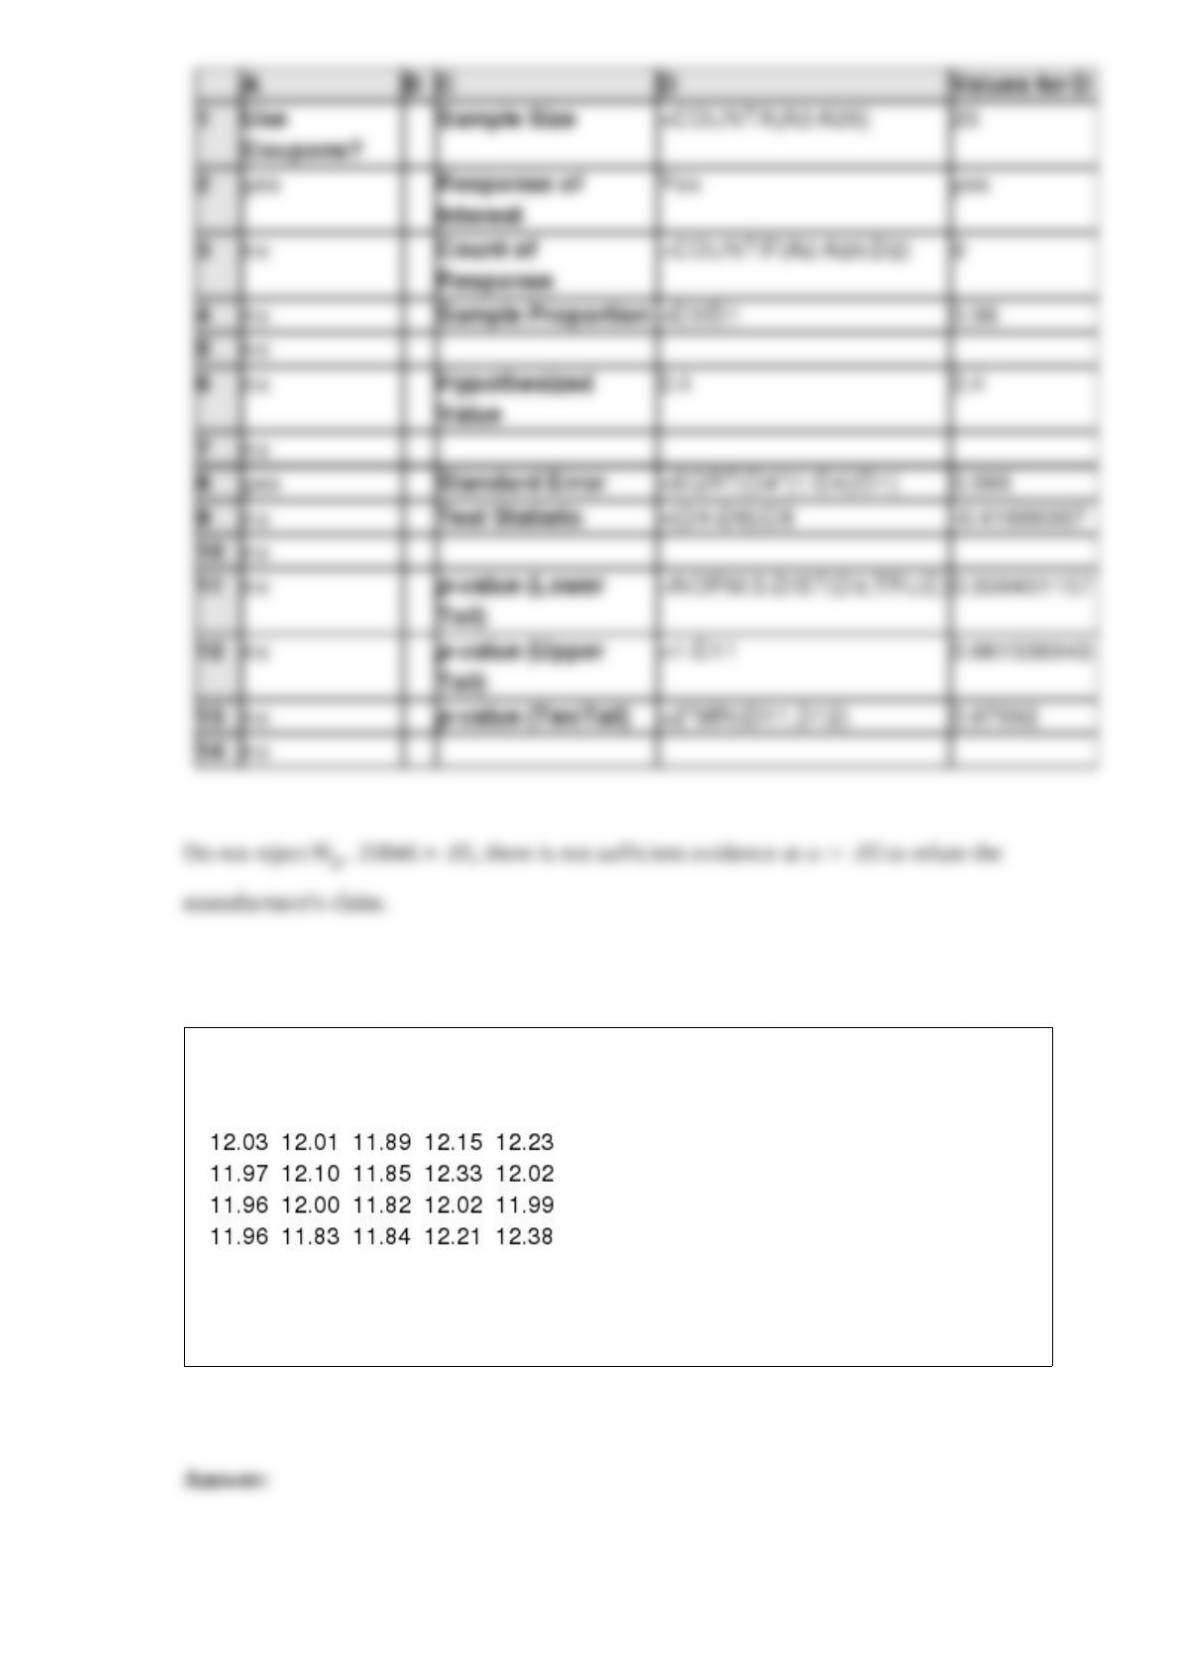
A manufacturer claims that at least 40% of its customers use coupons. A study of 25
customers is undertaken to test that claim. The results of the study follow.
At a .05 level of significance, use Excel to test the manufacturer’s claim.
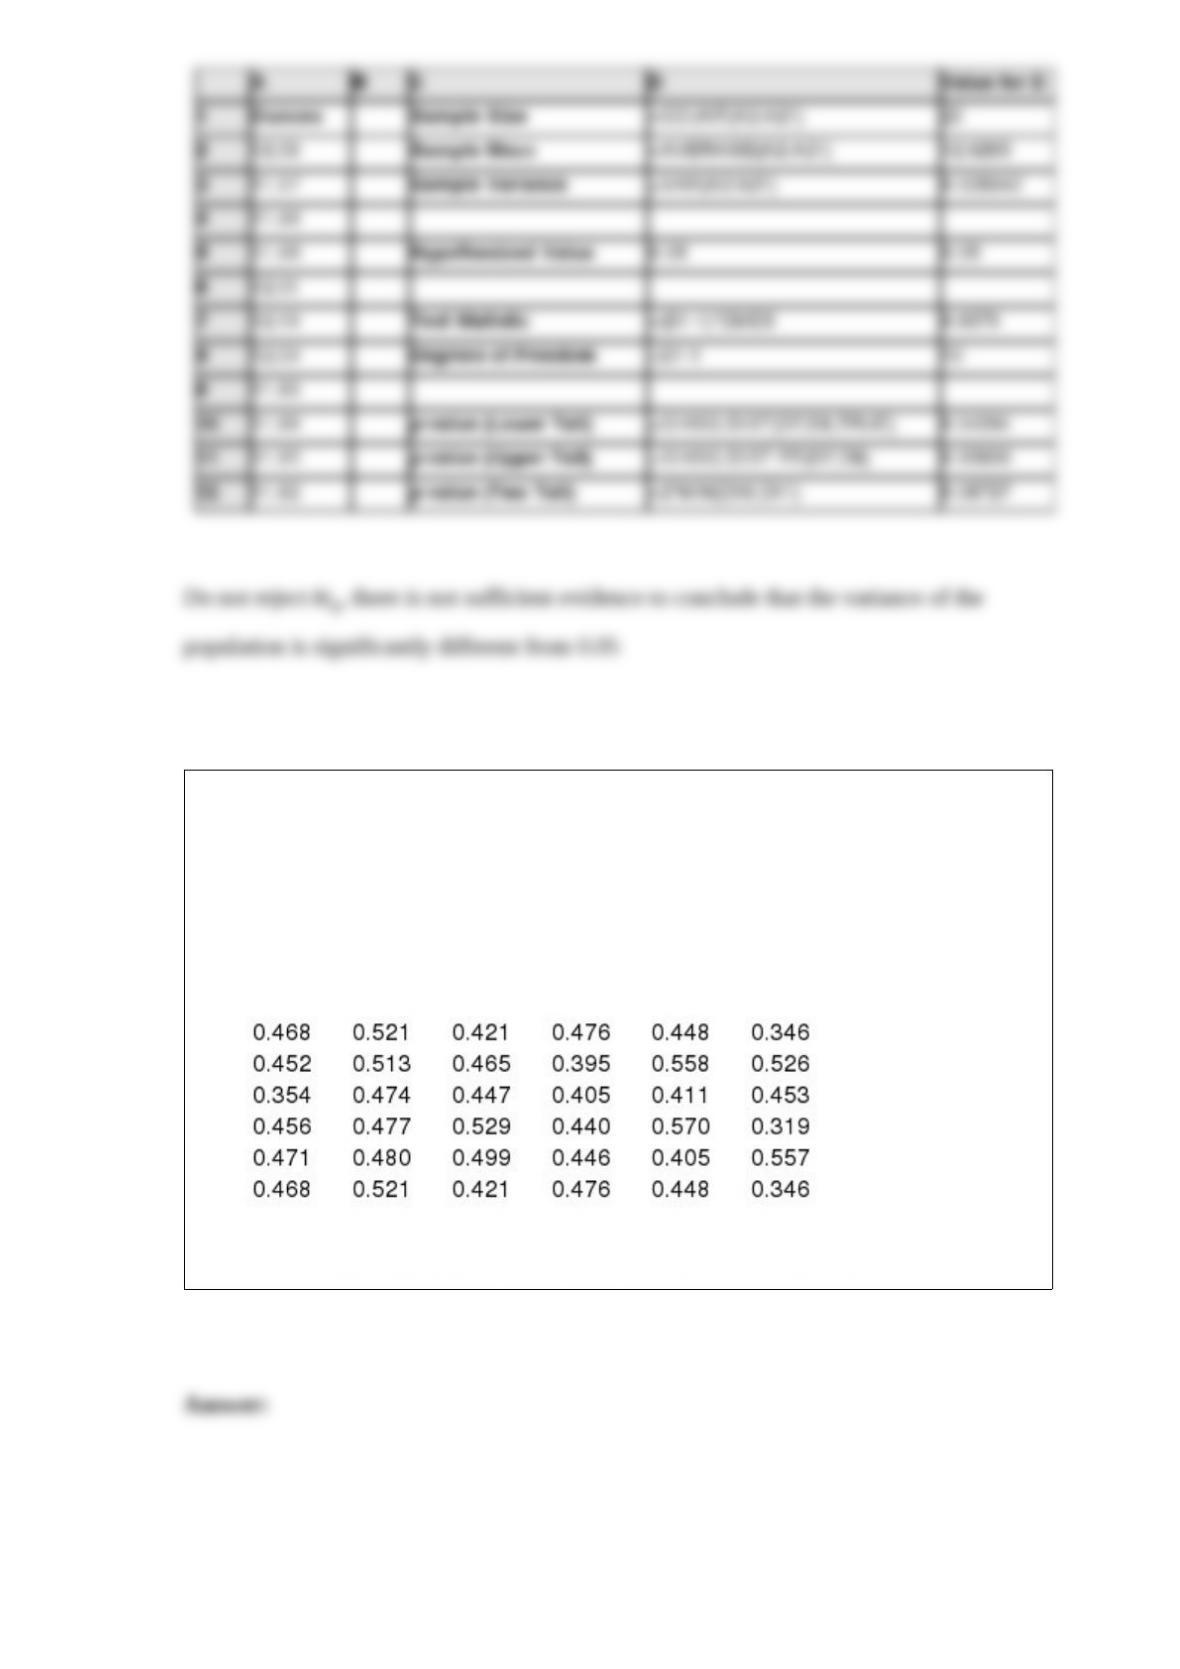
The specifications for the filling of soft drink bottles is a variance of 0.05 (ounces)2. A
sample of 20 bottles of soft drink showed the following results.
At a 5% level of significance, use Excel to determine whether or not the variance of the
population is significantly different from 0.05.
At a certain manufacturing plant, a machine produces ball bearings that should have a
diameter of 0.500 mm. If the machine produces ball bearings that are either too small or
too large, the ball bearings must be scrapped. Every hour, a quality control manager
takes a random sample of 36 ball bearings to test to see if the process is “out of control”
(i.e. to test to see if the average diameter differs from 0.500 mm). Assume that the
process is maintaining the desired standard deviation of .06 mm. The results from the
latest sample follow:
At a .01 level of significance, use Excel to test whether the process is “out of control.”
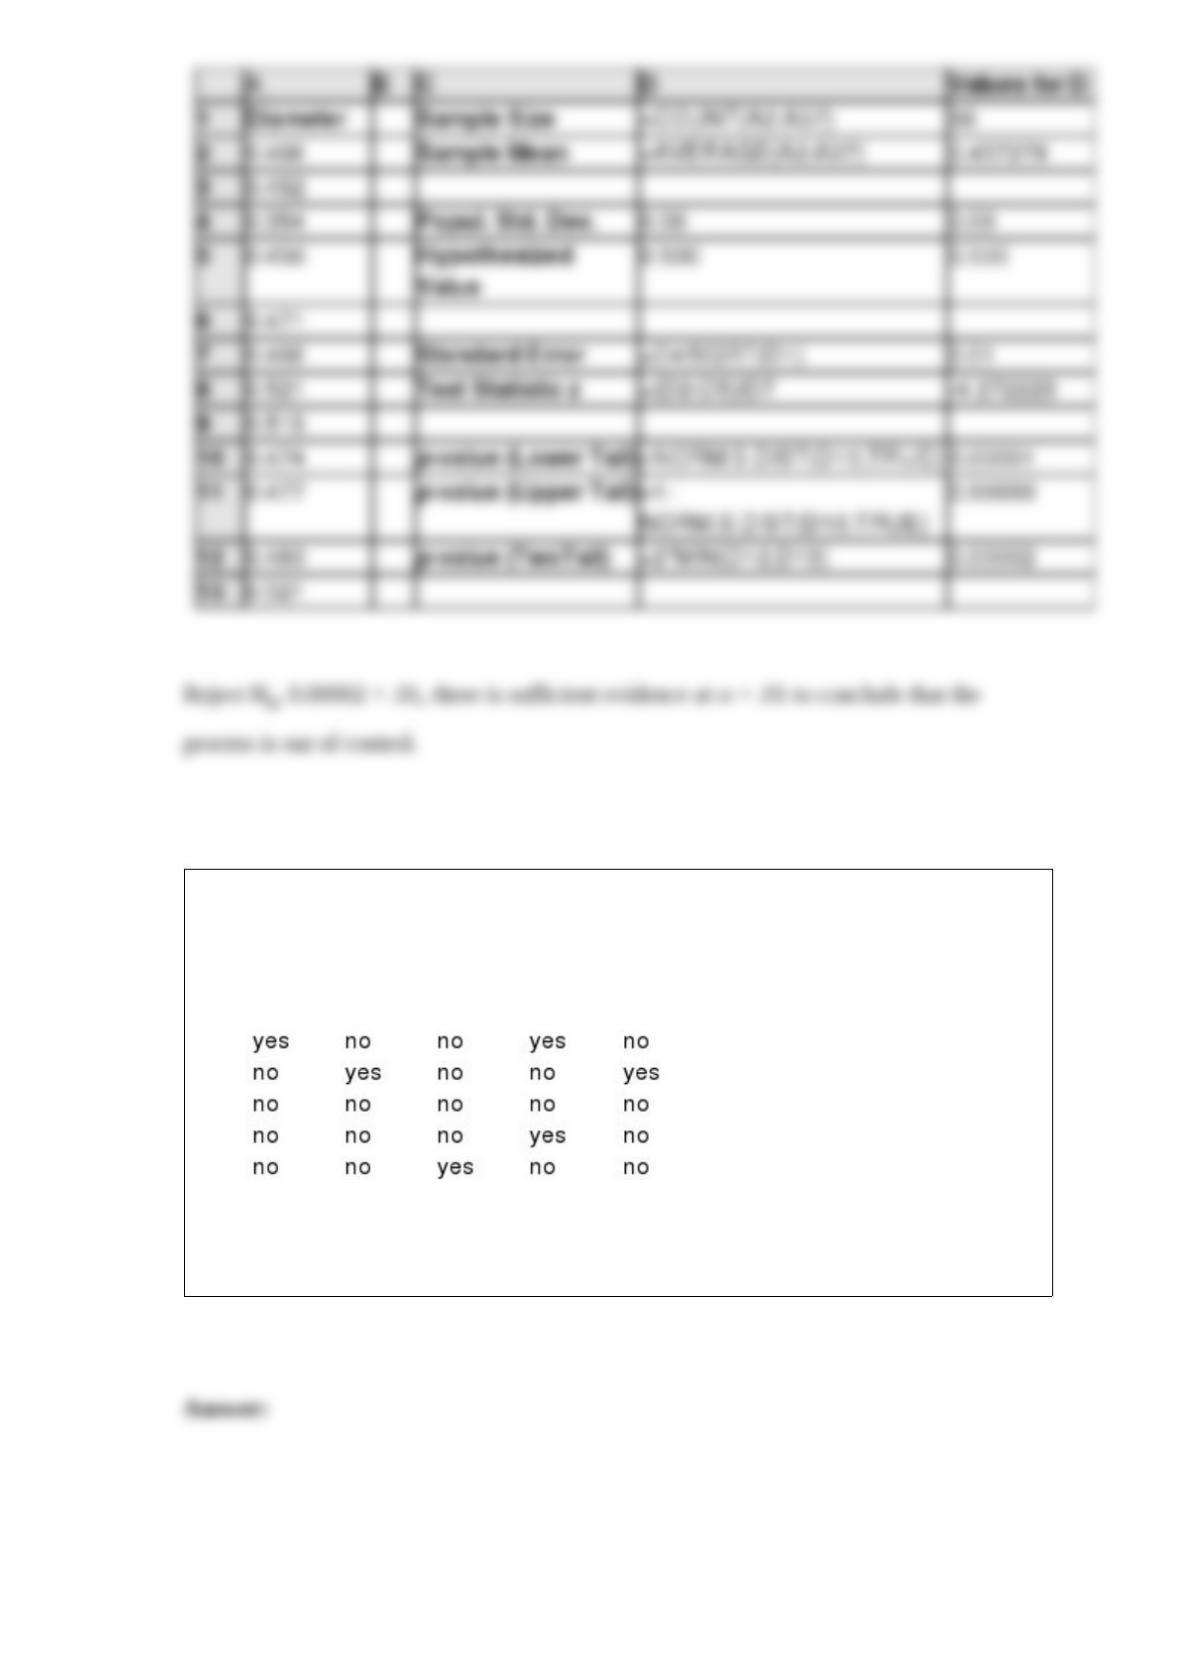
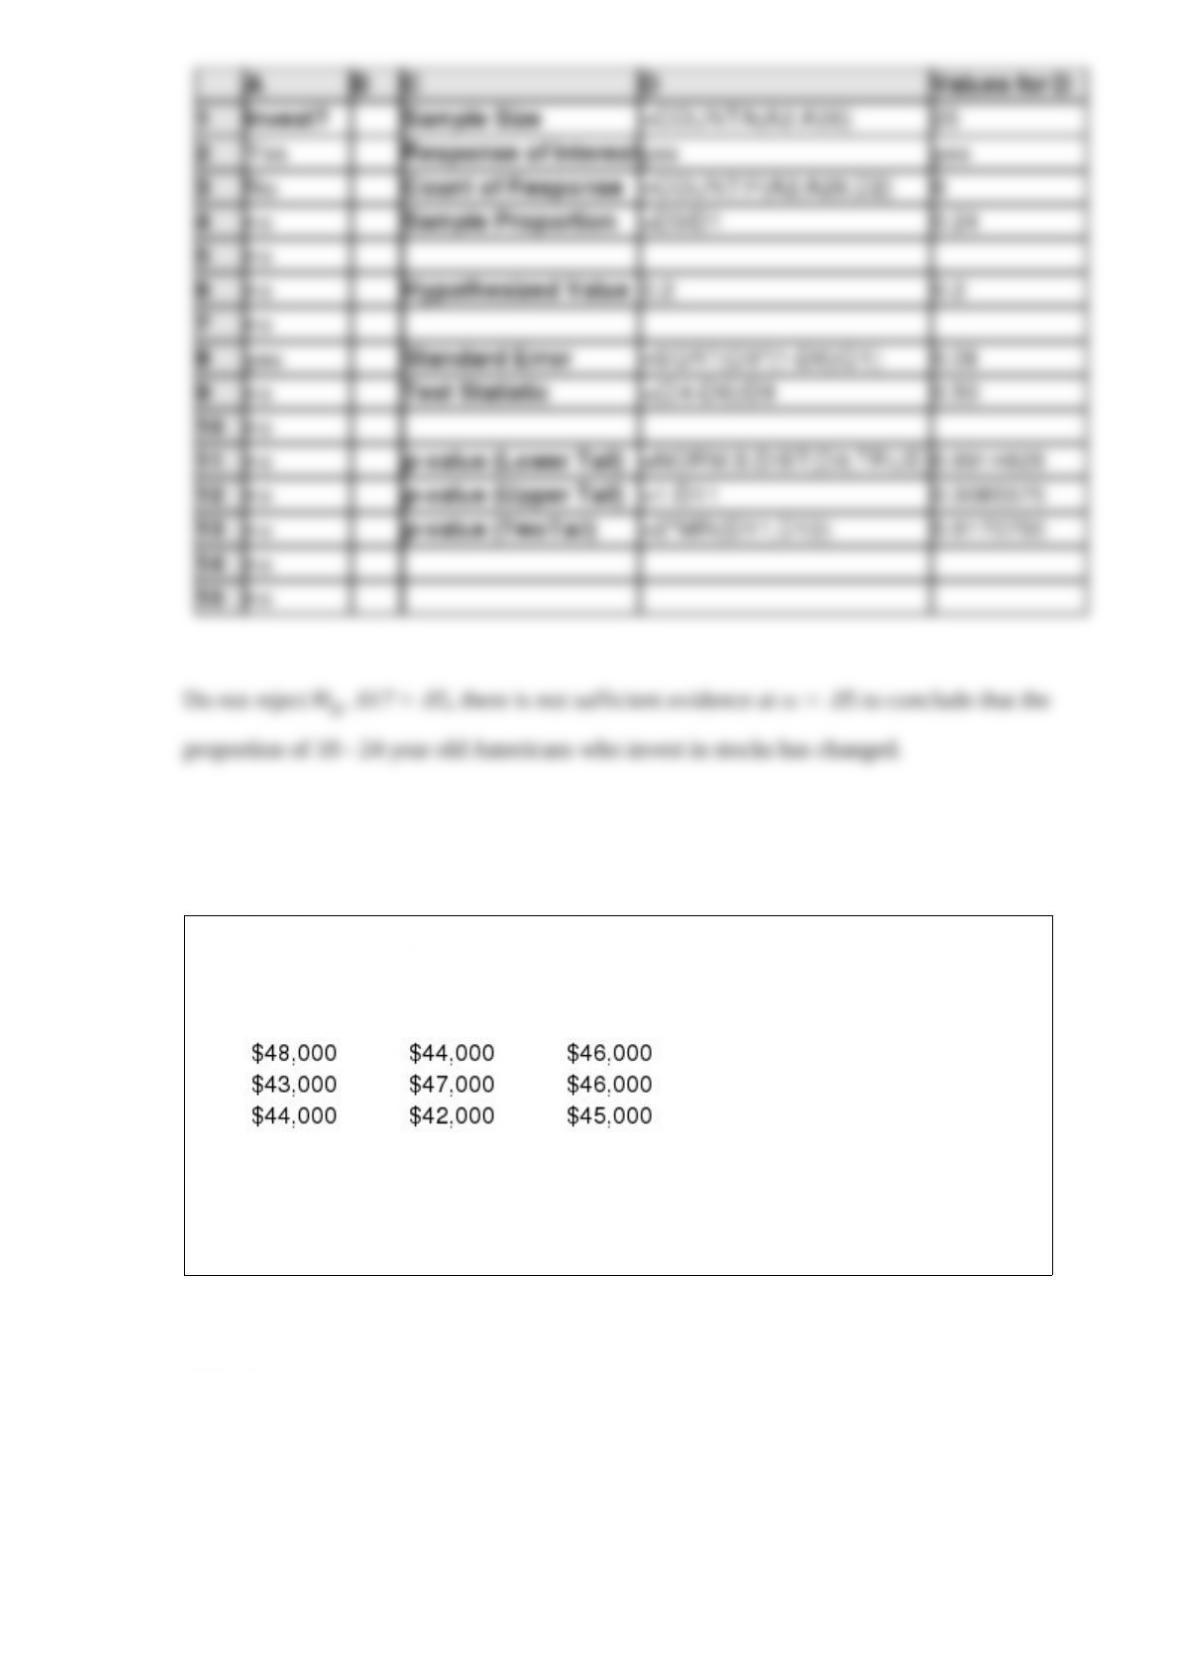
Several years ago the proportion of Americans aged 18 – 24 who invested in the stock
market was 0.20. A random sample of 25 Americans in this age group was recently
taken. They were asked whether or not they invested in the stock market. The results
follow:
At a .05 level of significance, use Excel to determine whether or not the proportion of
Americans 18 – 24 years old that invest in the stock market has changed.
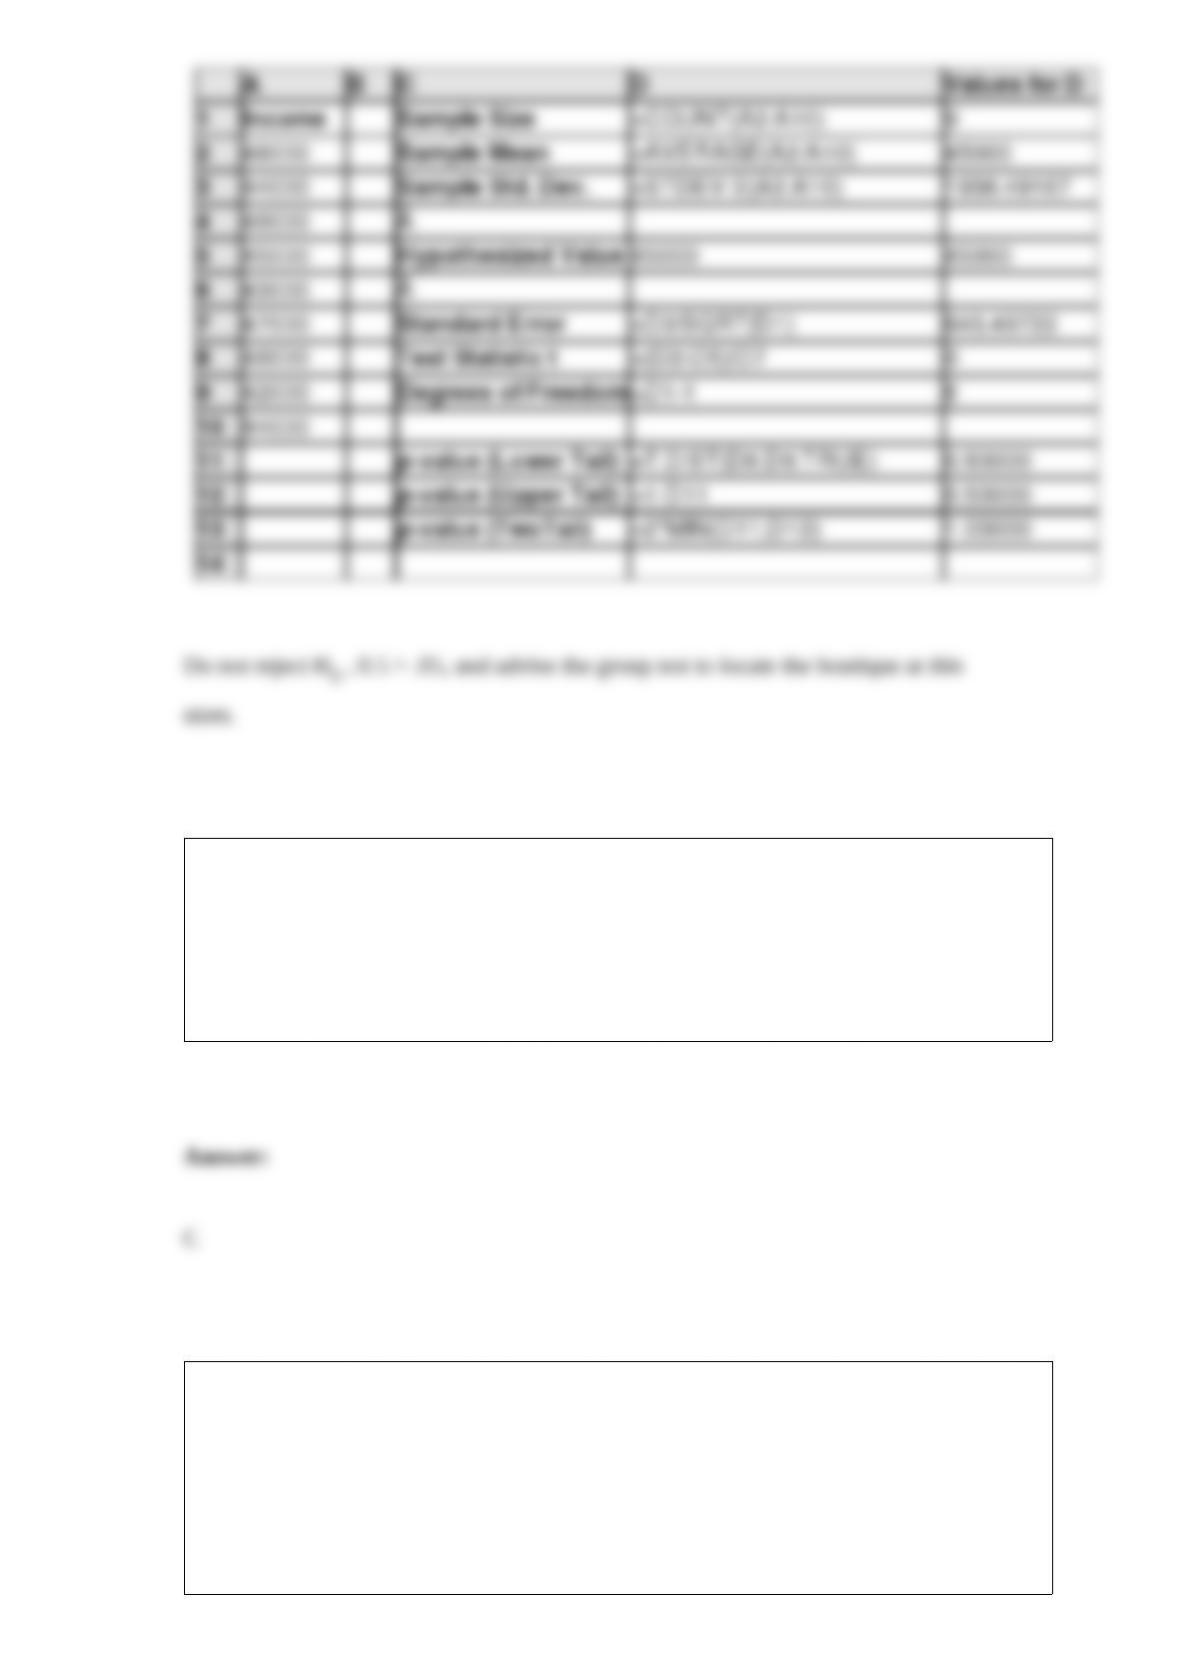
A group of young businesswomen wish to open a high fashion boutique in a vacant
store, but only if the average income of households in the area is more than $45,000. A
random sample of 9 households showed the following results.
Use the statistical techniques in Excel to advise the group on whether or not they should
locate the boutique in this store. Use a .05 level of significance. (Assume the population
is normally distributed.)
For stem-and-leaf displays where the leaf unit is not stated, the leaf unit is assumed to
equal
a. 0
b. .1
c. 1
d. 10
A property of the Poisson distribution is that the mean equals the
a. mode
b. median
c. variance
d. standard deviation
Z is a standard normal random variable. The P(-1.96 z -1.4) equals
a. 0.8942
b. 0.0558
c. 0.475
d. 0.4192
The average monthly electric bill of a random sample of 256 residents of a city is $90.
The population standard deviation is assumed to be $24.
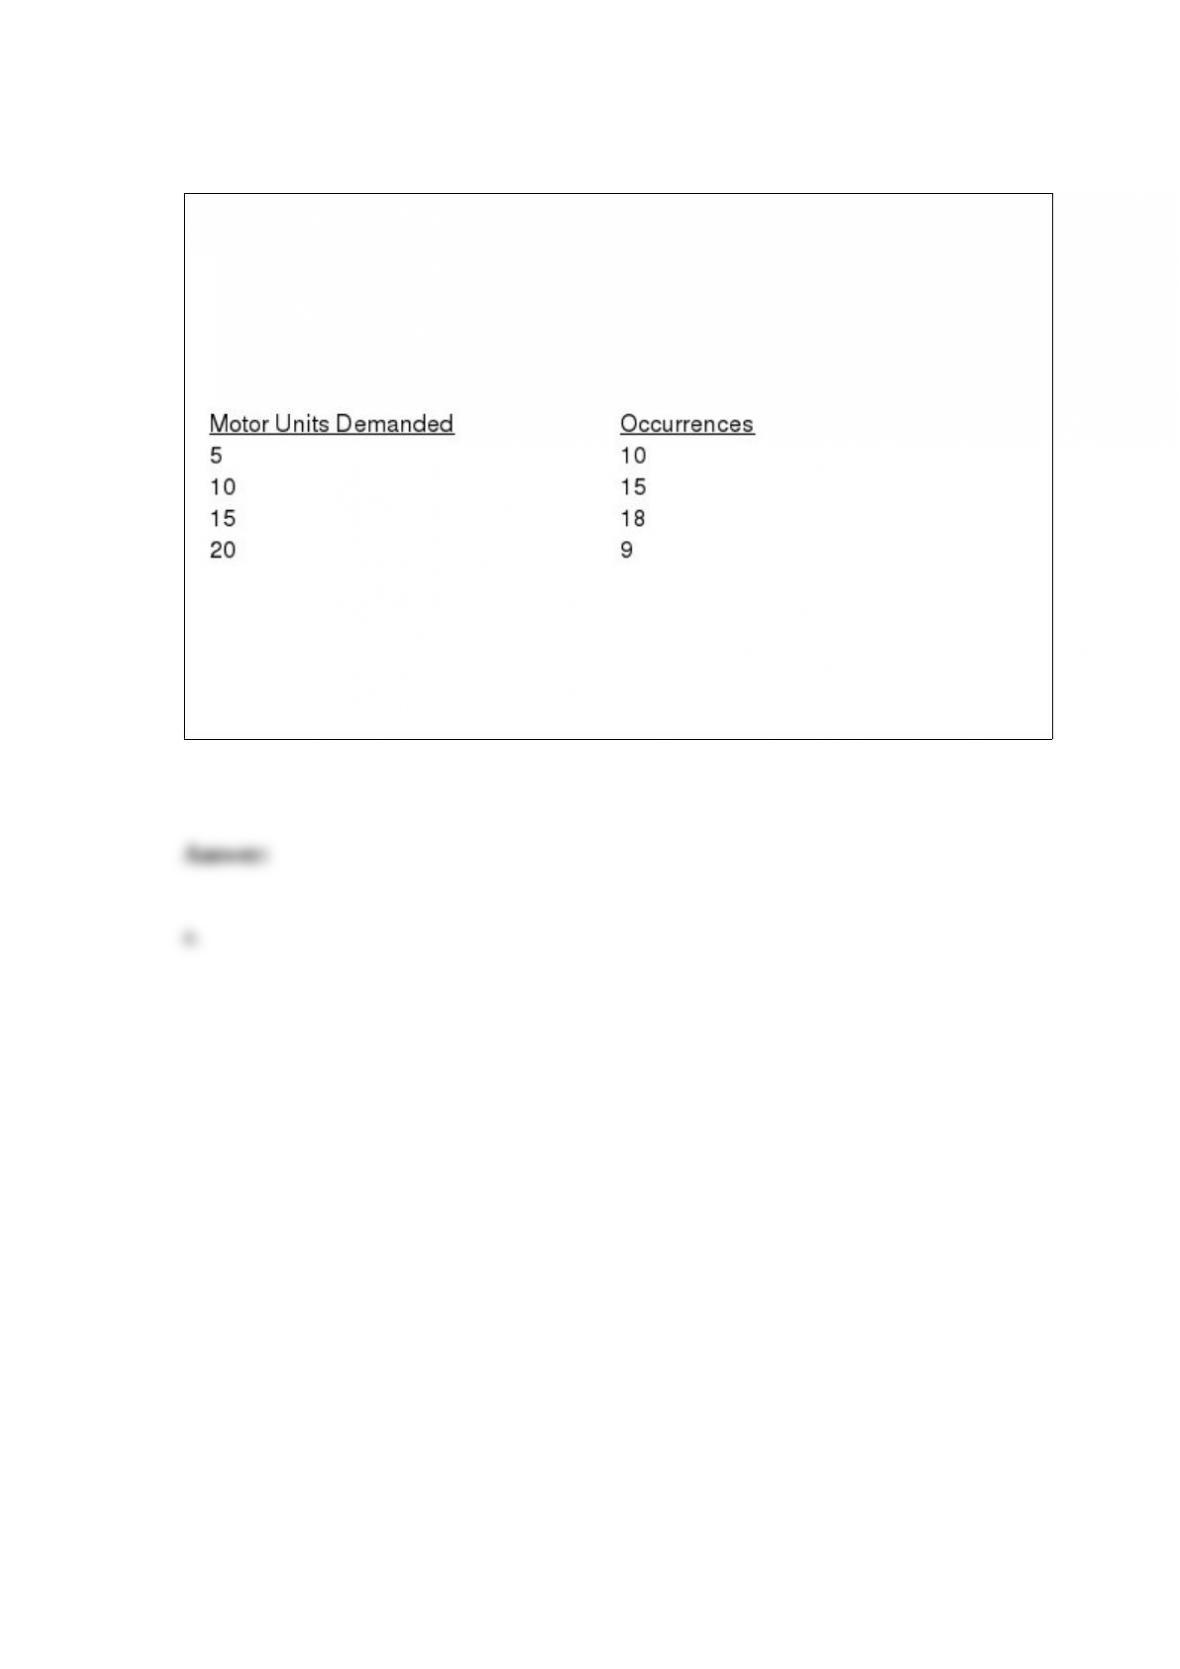
An automobile manufacturer stocks an electric motor unit that is used in many of their
production line robots. As this is the major item to fail in a robot, it is important that
enough of them are kept in storage. Since these precision motors are very expensive
(over $10,000 each) it is also very important not to keep too many on the shelf. Long
costs are $200 and short costs are $325 per unit. Data on monthly breakdown
experience is as follows:
a. Construct a table showing the cost associated with each decision alternative (number
of motors stocked) and state of nature (number of motors needed) combination.
b. Compute the probability of each state of nature.
c. How many standby motors should be stocked in order to minimize their expected
costs?
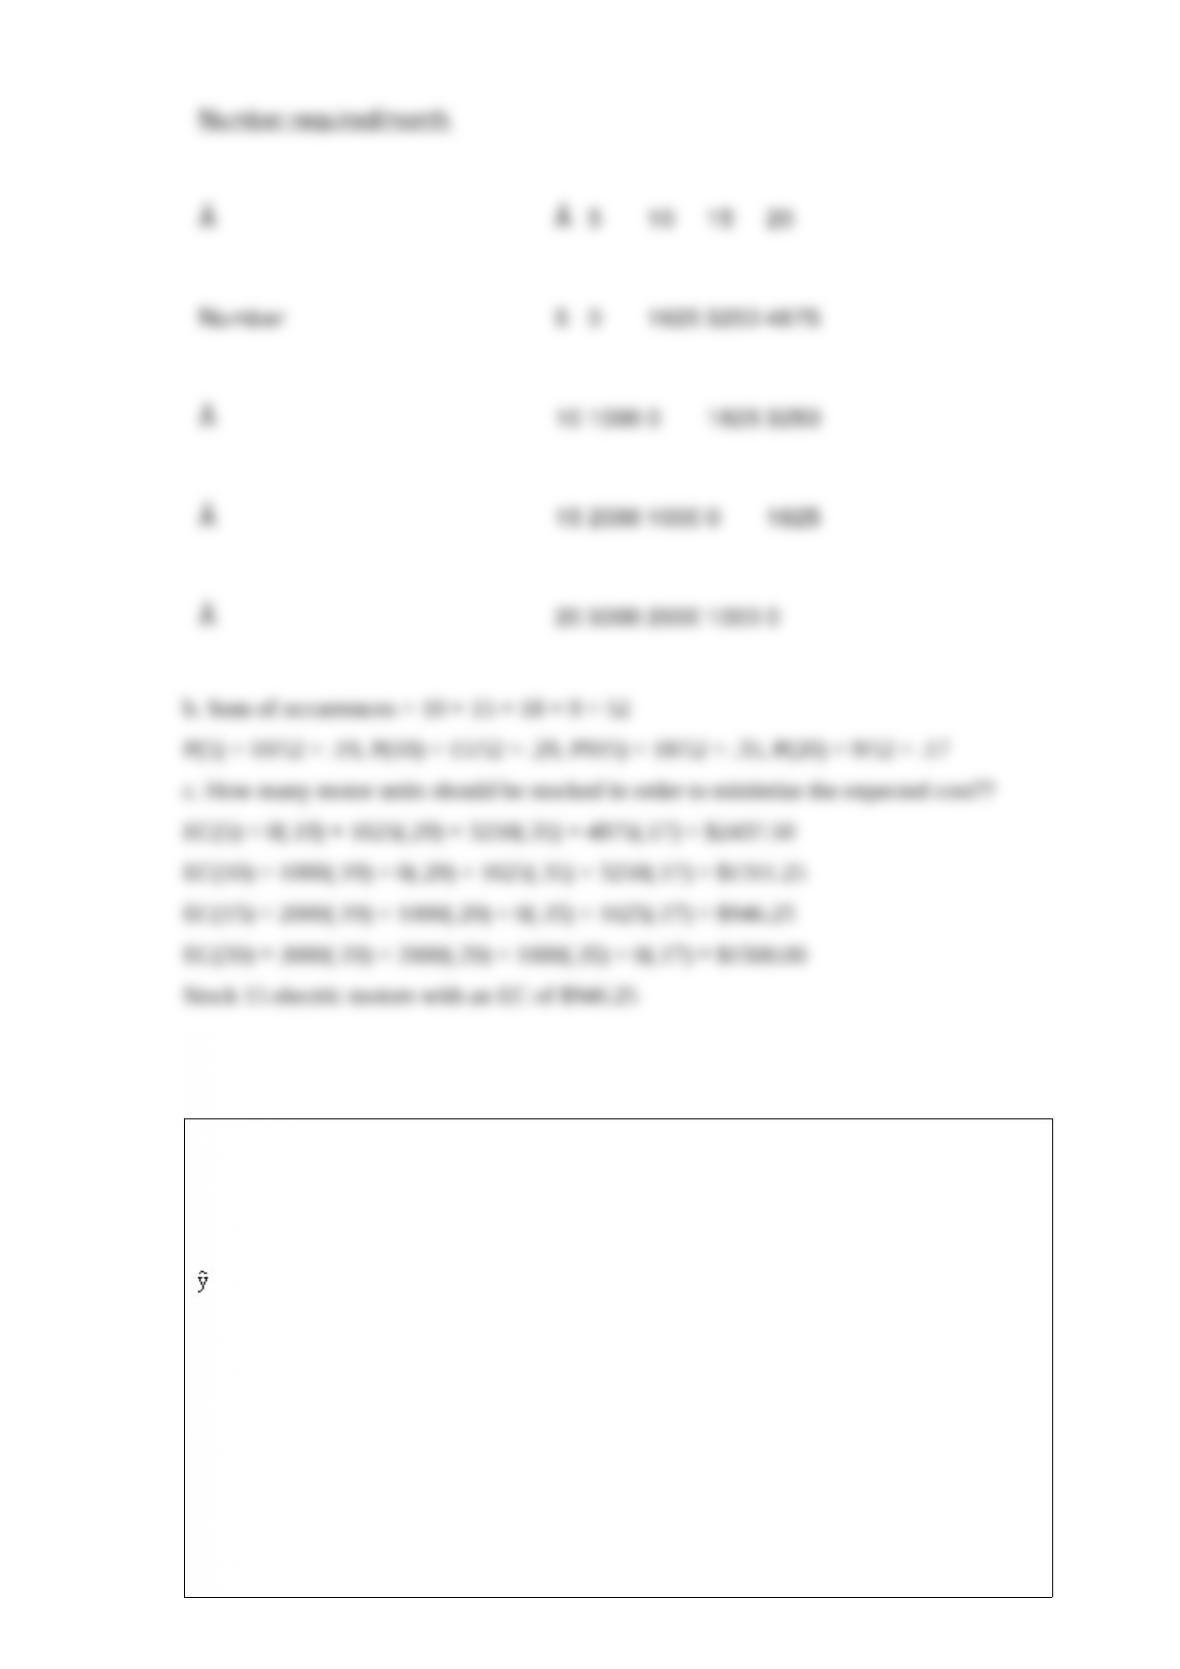
Exhibit 15-2
A regression model between sales (y in $1,000), unit price (x1 in dollars) and television
advertisement (x2 in dollars) resulted in the following function:
= 7 – 3x1 + 5x2
For this model SSR = 3500, SSE = 1500, and the sample size is 18.
Refer to Exhibit 15-2. The coefficient of x2 indicates that if television advertising is
increased by $1 (holding the unit price constant), sales are expected to
a. increase by $5
b. increase by $12,000
c. increase by $5,000
d. decrease by $2,000
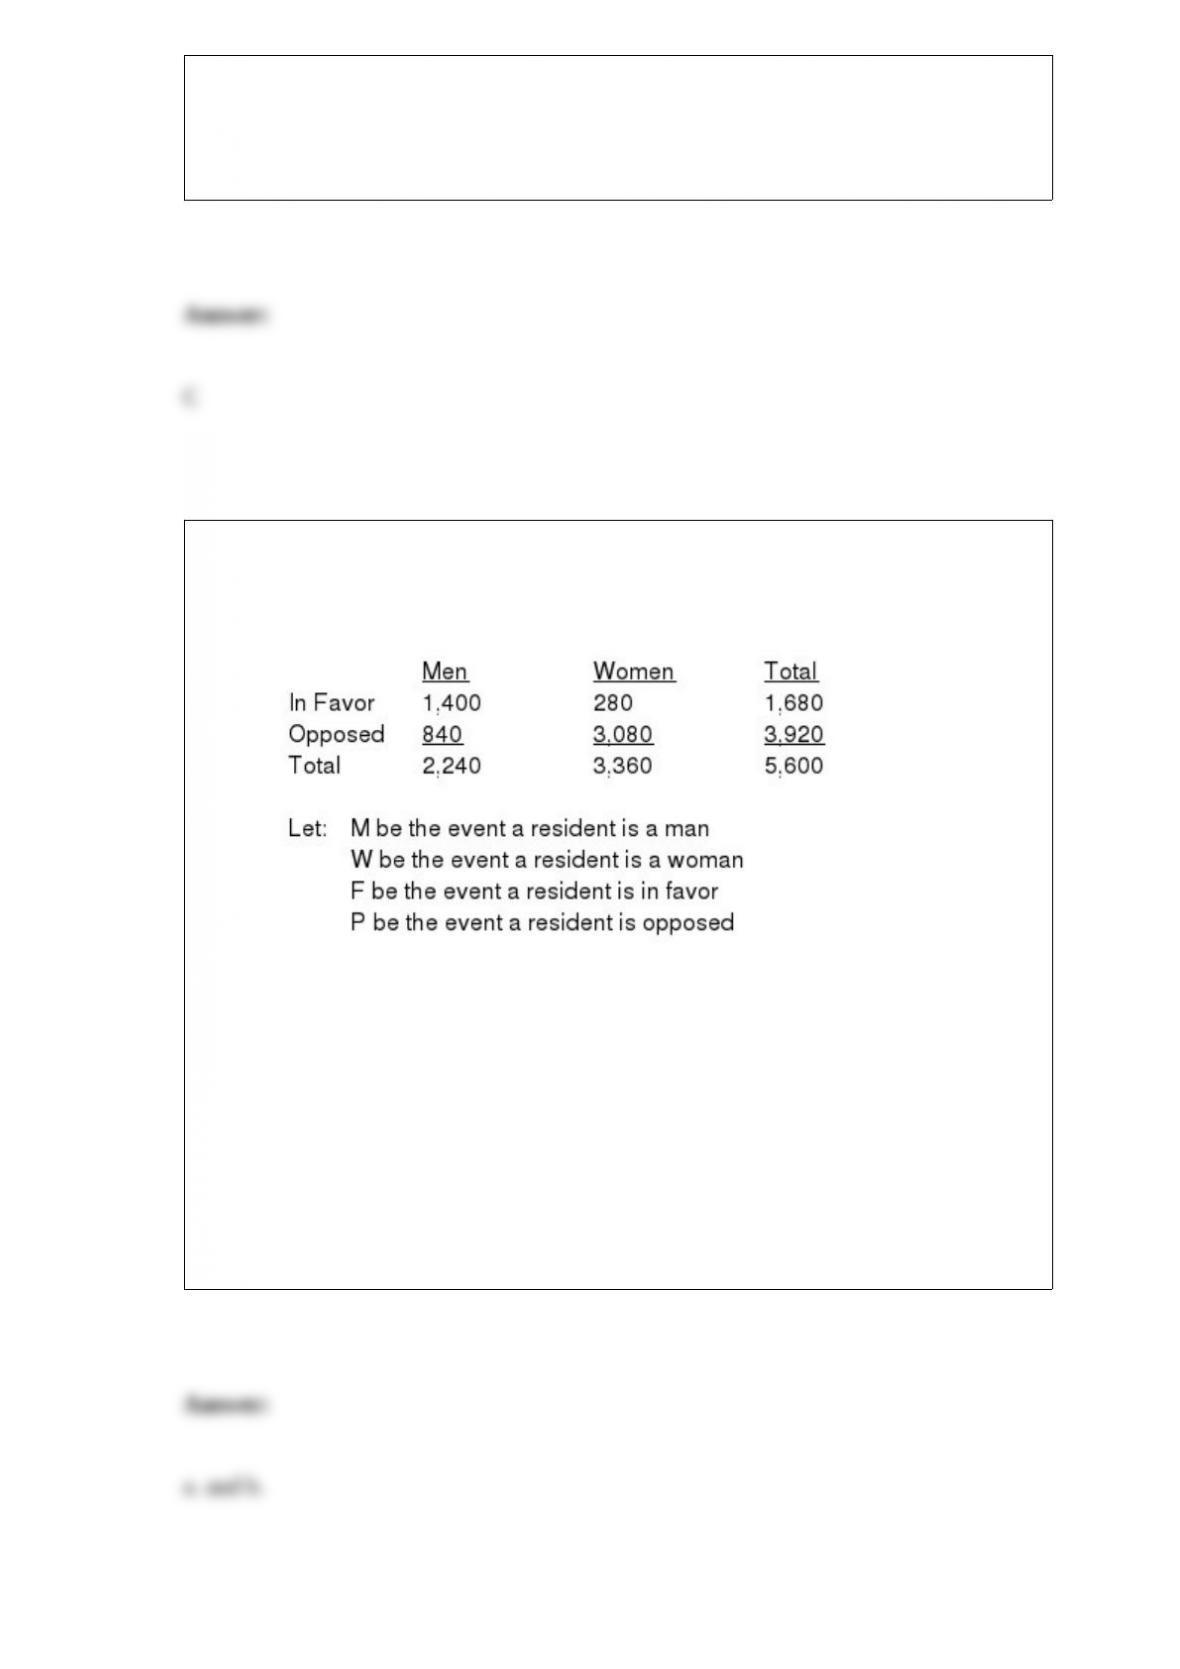
A small town has 5,600 residents. The residents in the town were asked whether or not
they favored building a new bridge across the river. You are given the following
information on the residents’ responses, broken down by gender.
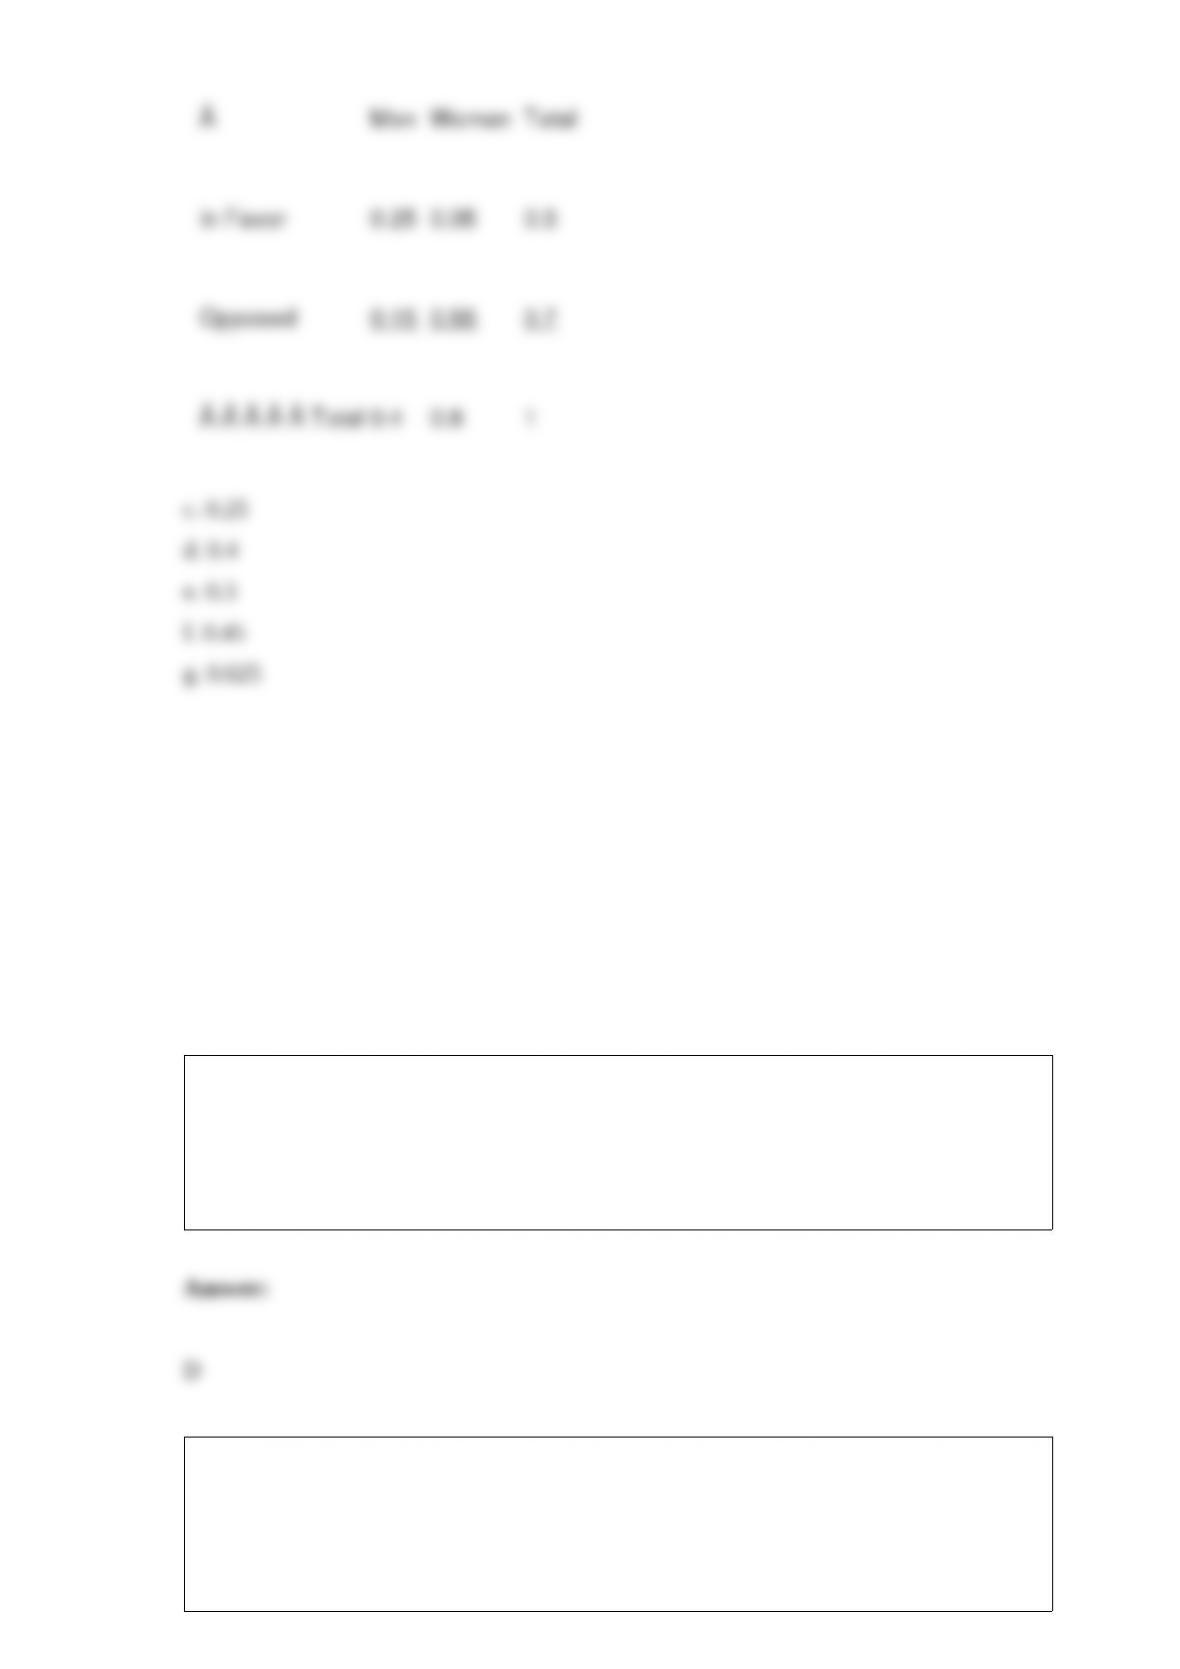
a. Find the joint probability table.
b. Find the marginal probabilities.
c. What is the probability that a randomly selected resident is a man and is in favor of
building the bridge?
d. What is the probability that a randomly selected resident is a man?
e. What is the probability that a randomly selected resident is in favor of building the
bridge?
f. What is the probability that a randomly selected resident is a man or in favor of
building the bridge or both?
g. A randomly selected resident turns out to be male. Compute the probability that he is
in favor of building the bridge.
Since the mode is the most frequently occurring data value, it
a. can never be larger than the mean
b. is always larger than the median
c. is always larger than the mean
d. None of the other answers are correct.
Exhibit 21-3
From a population of size 600, a simple random sample of size 58 is selected. The
sample mean is 400, and the sample standard deviation is 40.

Refer to Exhibit 21-3. The population total is
a. 3,944
b. 16,000
c. 240,000
d. 24,000
An example of statistical inference is
a. a population mean
b. descriptive statistics
c. calculating the size of a sample
d. hypothesis testing
The mean of a standard normal probability distribution
a. is always equal to 1
b. can be any value as long as it is positive
c. can be any value
d. None of the alternative answers is correct.

The correlation coefficient
a. is the same as the covariance
b. can be larger than 1
c. cannot be larger than 1
d. cannot be negative
The entity on which data are collected is
a. the sample
b. the element
c. the population
d. termed a census
For a decision alternative, the weighted average of the payoffs is known as
a. the expected value of perfect information
b. the expected value
c. the expected probability
d. perfect information
A sample of 100 cans of coffee showed an average weight of 13 ounces. The population
standard deviation is 0.8 ounces.
a. Construct a 95% confidence interval for the mean of the population.
b. Construct a 95.44% confidence interval for the mean of the population.
c. Discuss why the answers in parts a and b are different.
The Poisson probability distribution is used with
a. a continuous random variable
b. a discrete random variable
c. either a continuous or discrete random variable
d. any random variable
The binomial probability distribution is used with
a. a continuous random variable
b. a discrete random variable
c. any distribution, as long as it is not normal
d. All of these answers are correct.
In a random sample of 200 registered voters, 120 indicated they are Democrats.
Develop a 95% confidence interval for the proportion of registered voters in the
population who are Democrats.
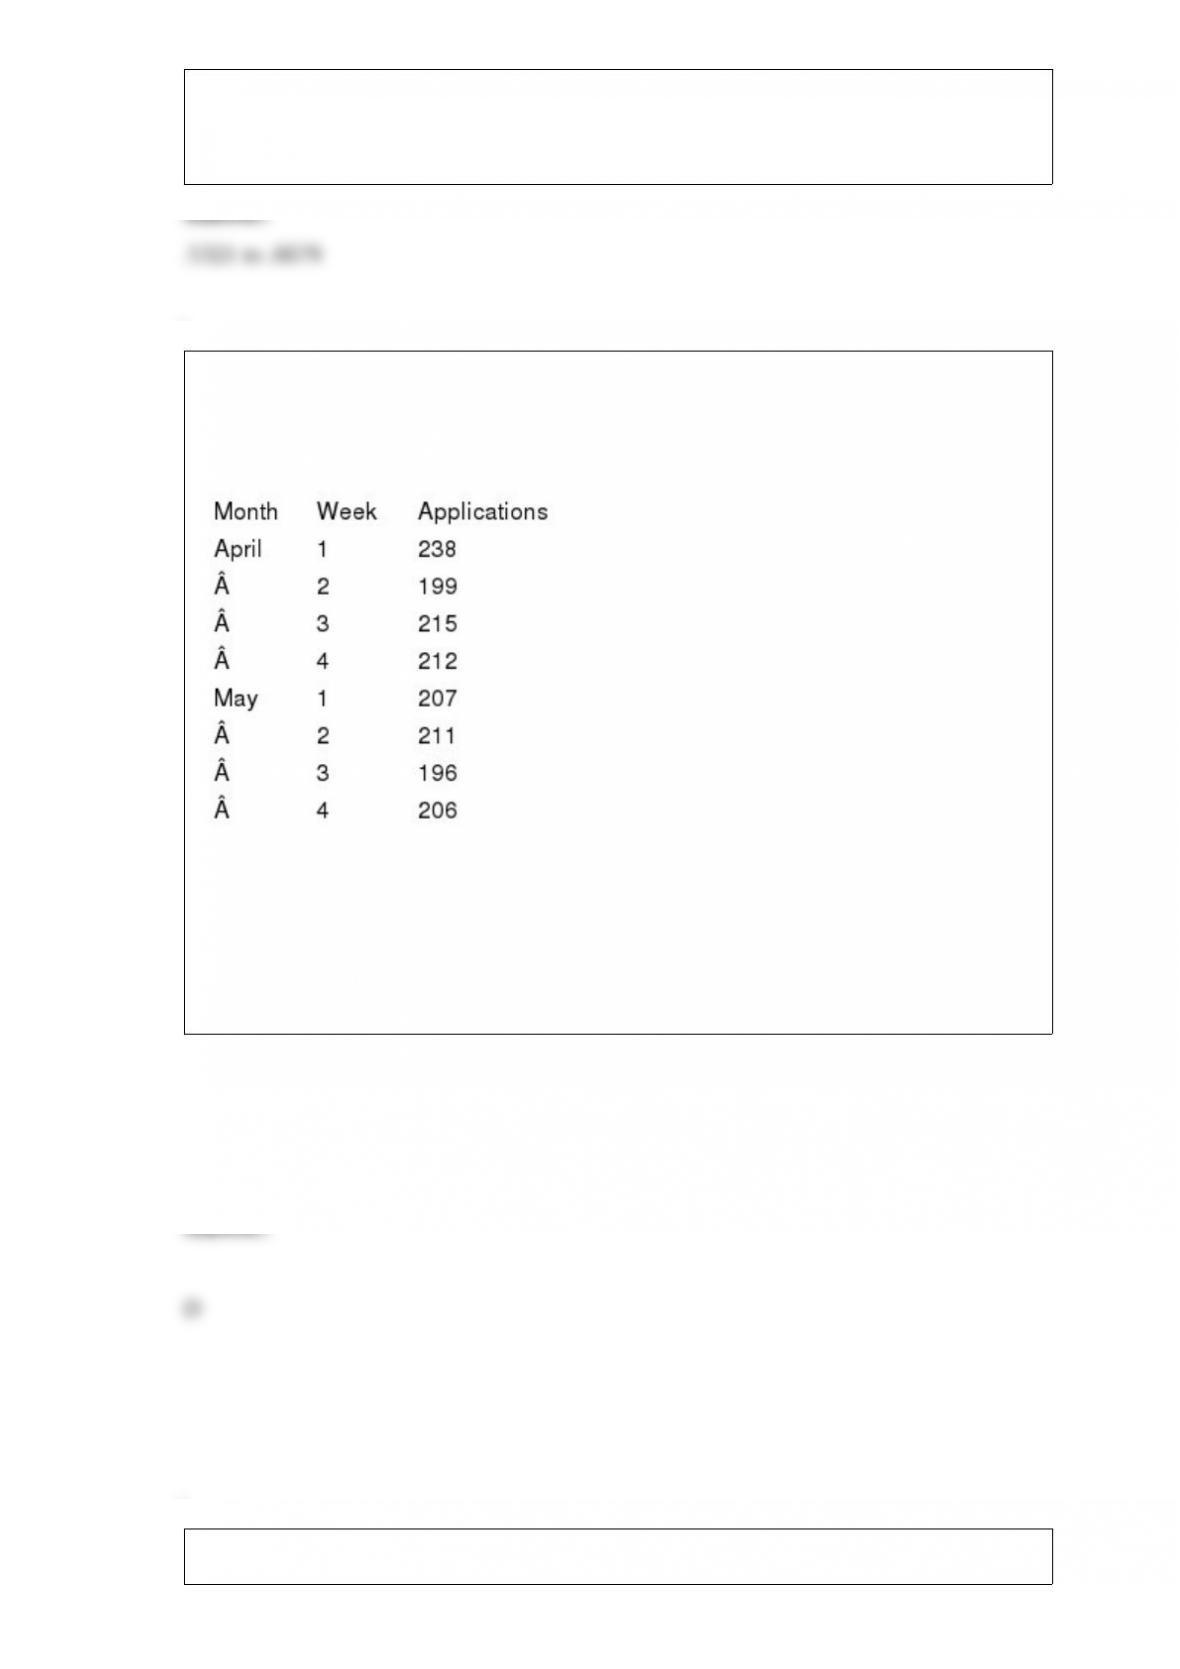
Exhibit 17-5
State Division of Motor Vehicles (DMV) statistics show the rate of new driver’s license
applications to be as shown below:
Refer to Exhibit 17-5. Using a 5-week moving average, what is the forecast for the first
week in April?
198.45
200.20
202.83
206.40
A lumber company has claimed that the standard deviation for the lengths of their 6 foot
boards is 0.5 inches or less. To test their claim, a random sample of 17 six-foot boards is
selected; and it is determined that the standard deviation of the sample is 0.43. Do the
results of the sample support the company’s claim? Use = 0.1.
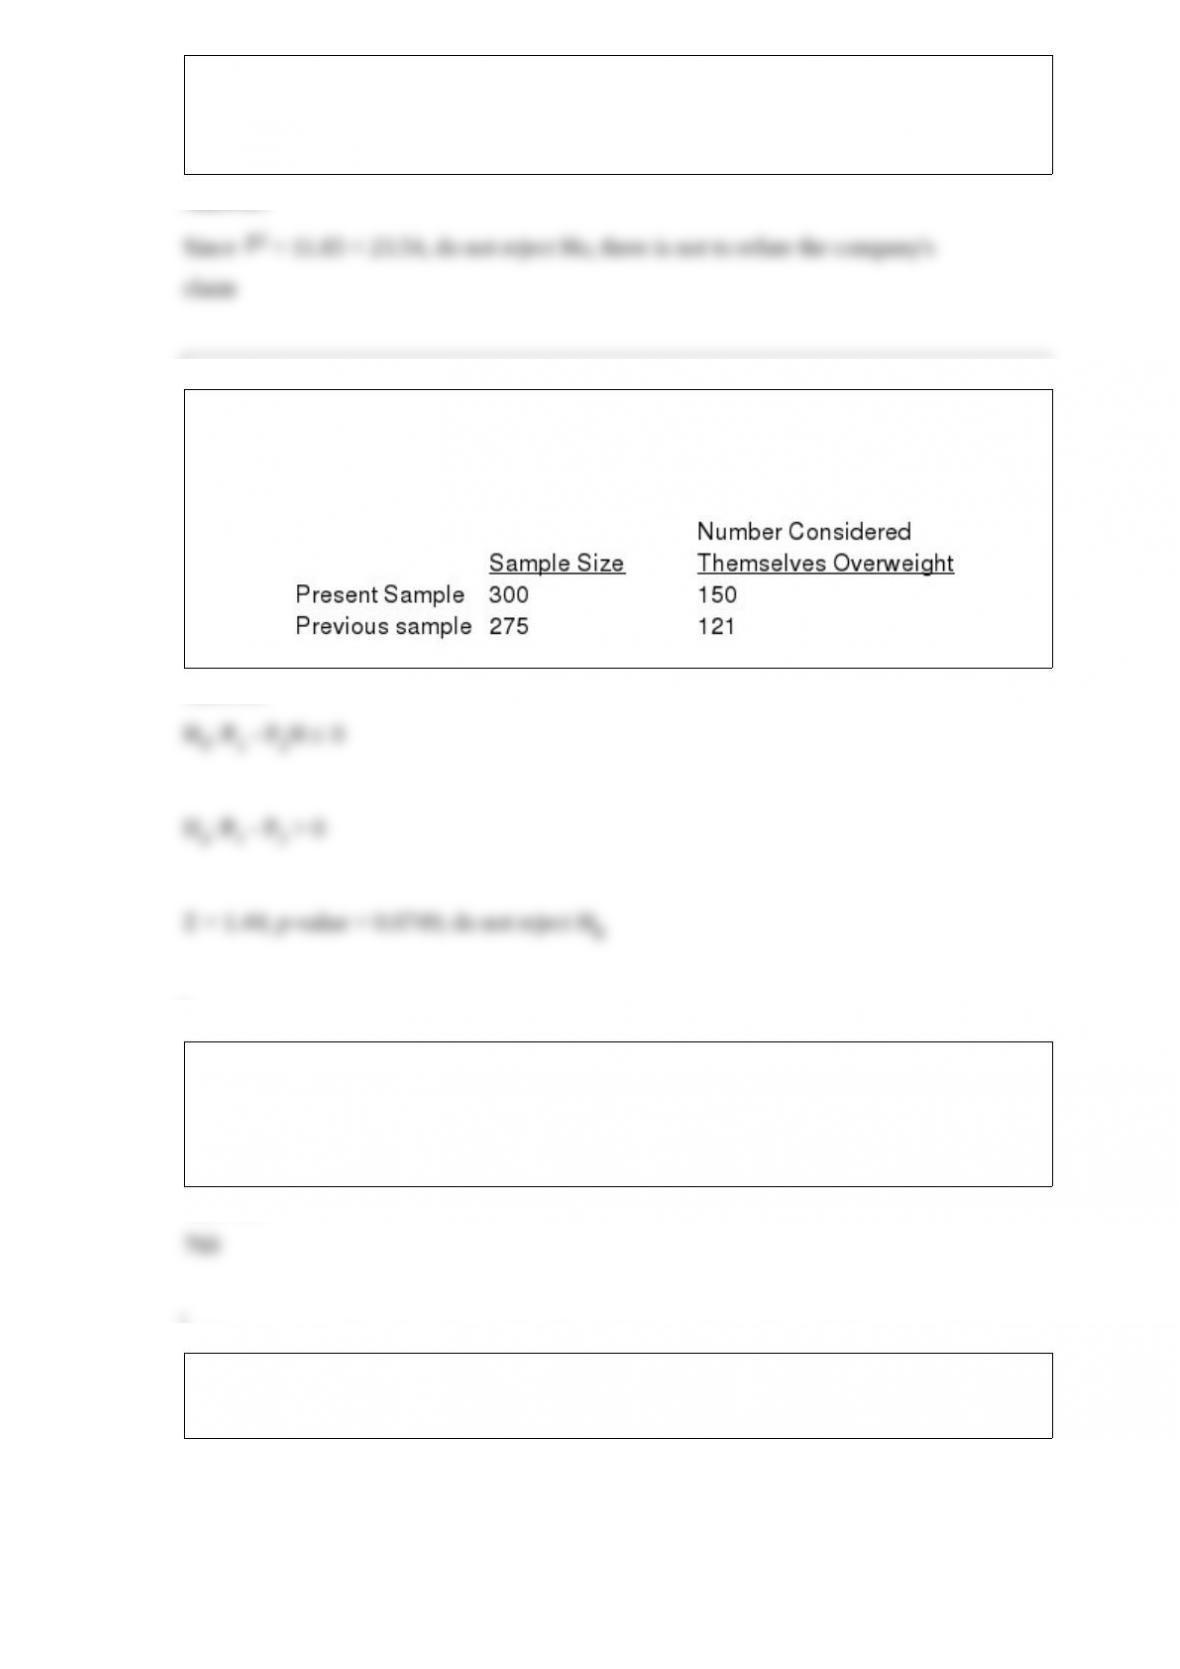
A poll was taken this year asking college students if they considered themselves
overweight. A similar poll was taken five years ago. Results are summarized below. Has
the proportion increased significantly? Let = 0.05.
A community has 2,000 registered voters. A pilot study revealed that 70% of the
individuals are planning to vote for the incumbent mayor. We are interested in selecting
a sample. So that the sampling error will not exceed 4%, what size sample should be
taken?
The test scores for selected samples of sociology students who took the course from
three different instructors are shown below.
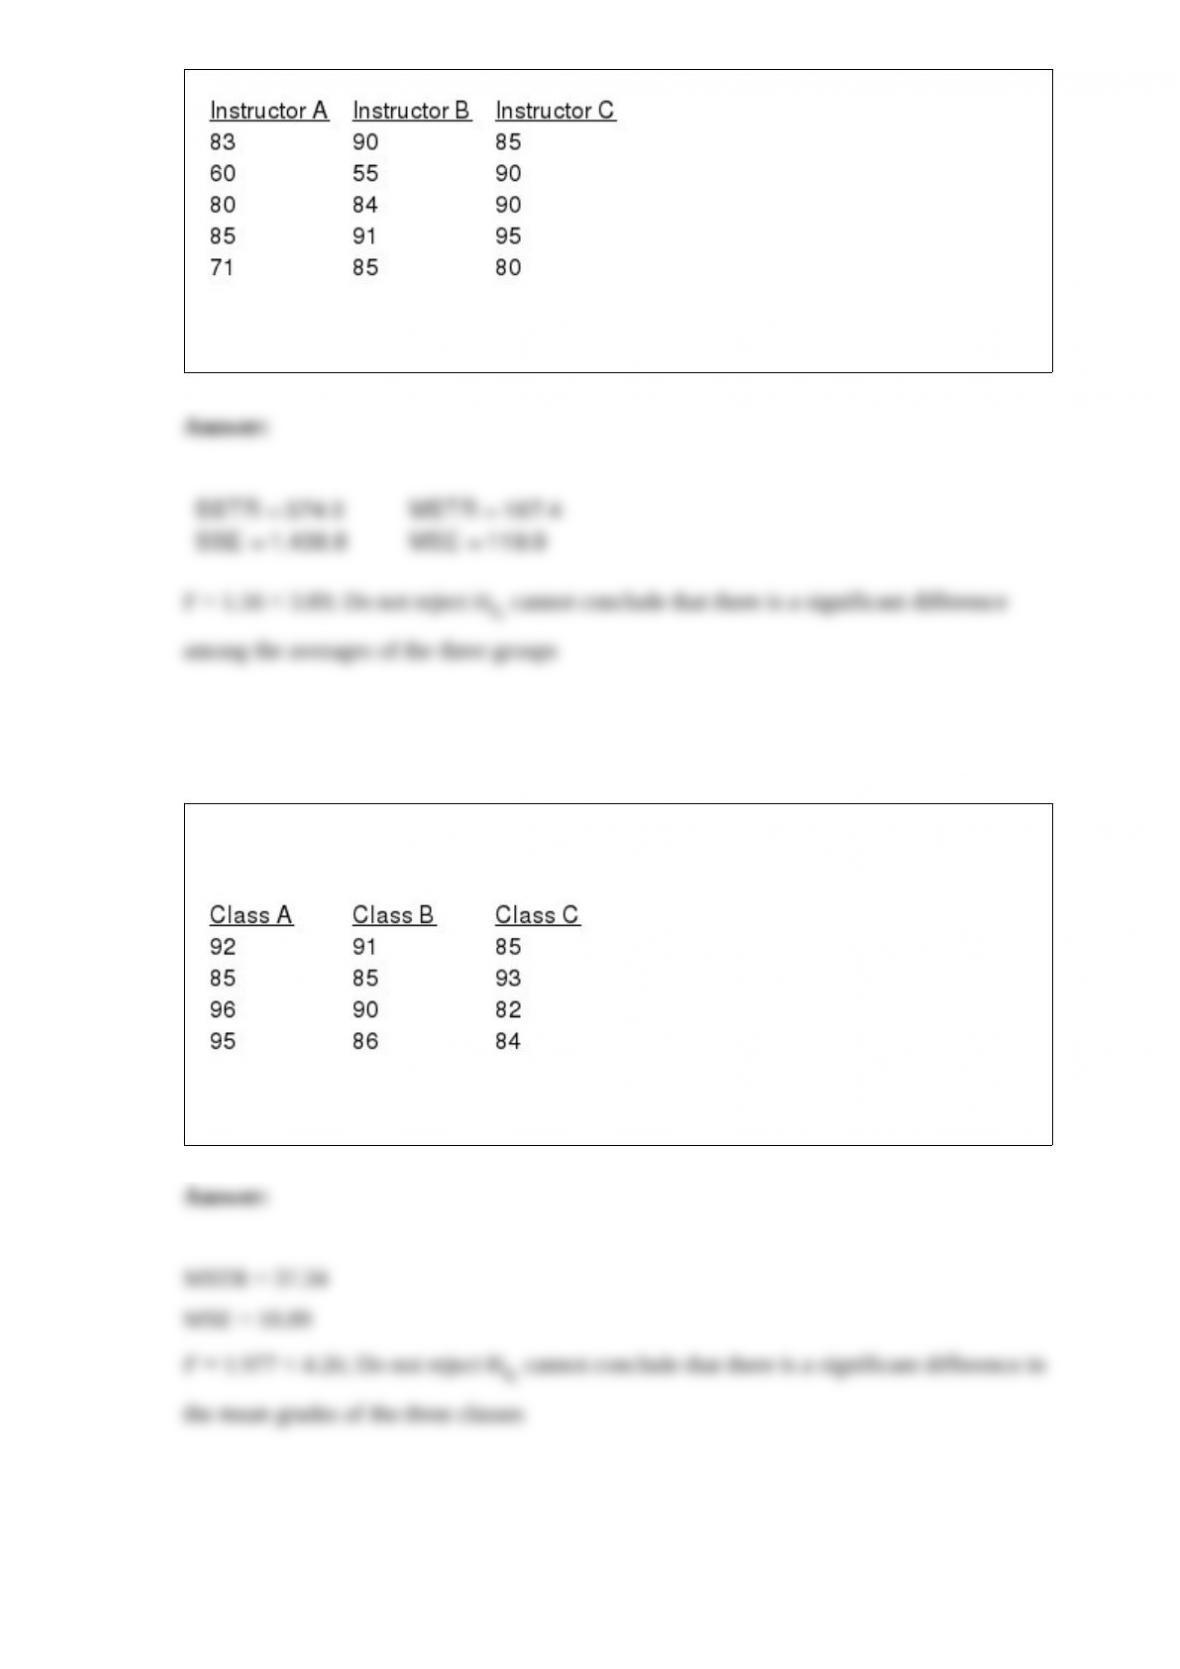
At = 0.05, test to see if there is a significant difference among the averages of the
three groups.
The final examination grades of random samples of students from three different classes
are shown below.
At the = .05 level of significance, is there any difference in the mean grades of the
three classes?
A reporter for a student newspaper is writing an article on the cost of off-campus
housing. A sample was taken of 10 one-bedroom units within a half-mile of campus and
the rents paid. The sample mean is $550 and the sample standard deviation is $60.05.
Provide a 95% confidence interval estimate of the mean rent per month for the
population of one-bedroom units within a half-mile of campus. We will assume this
population to be normally distributed.
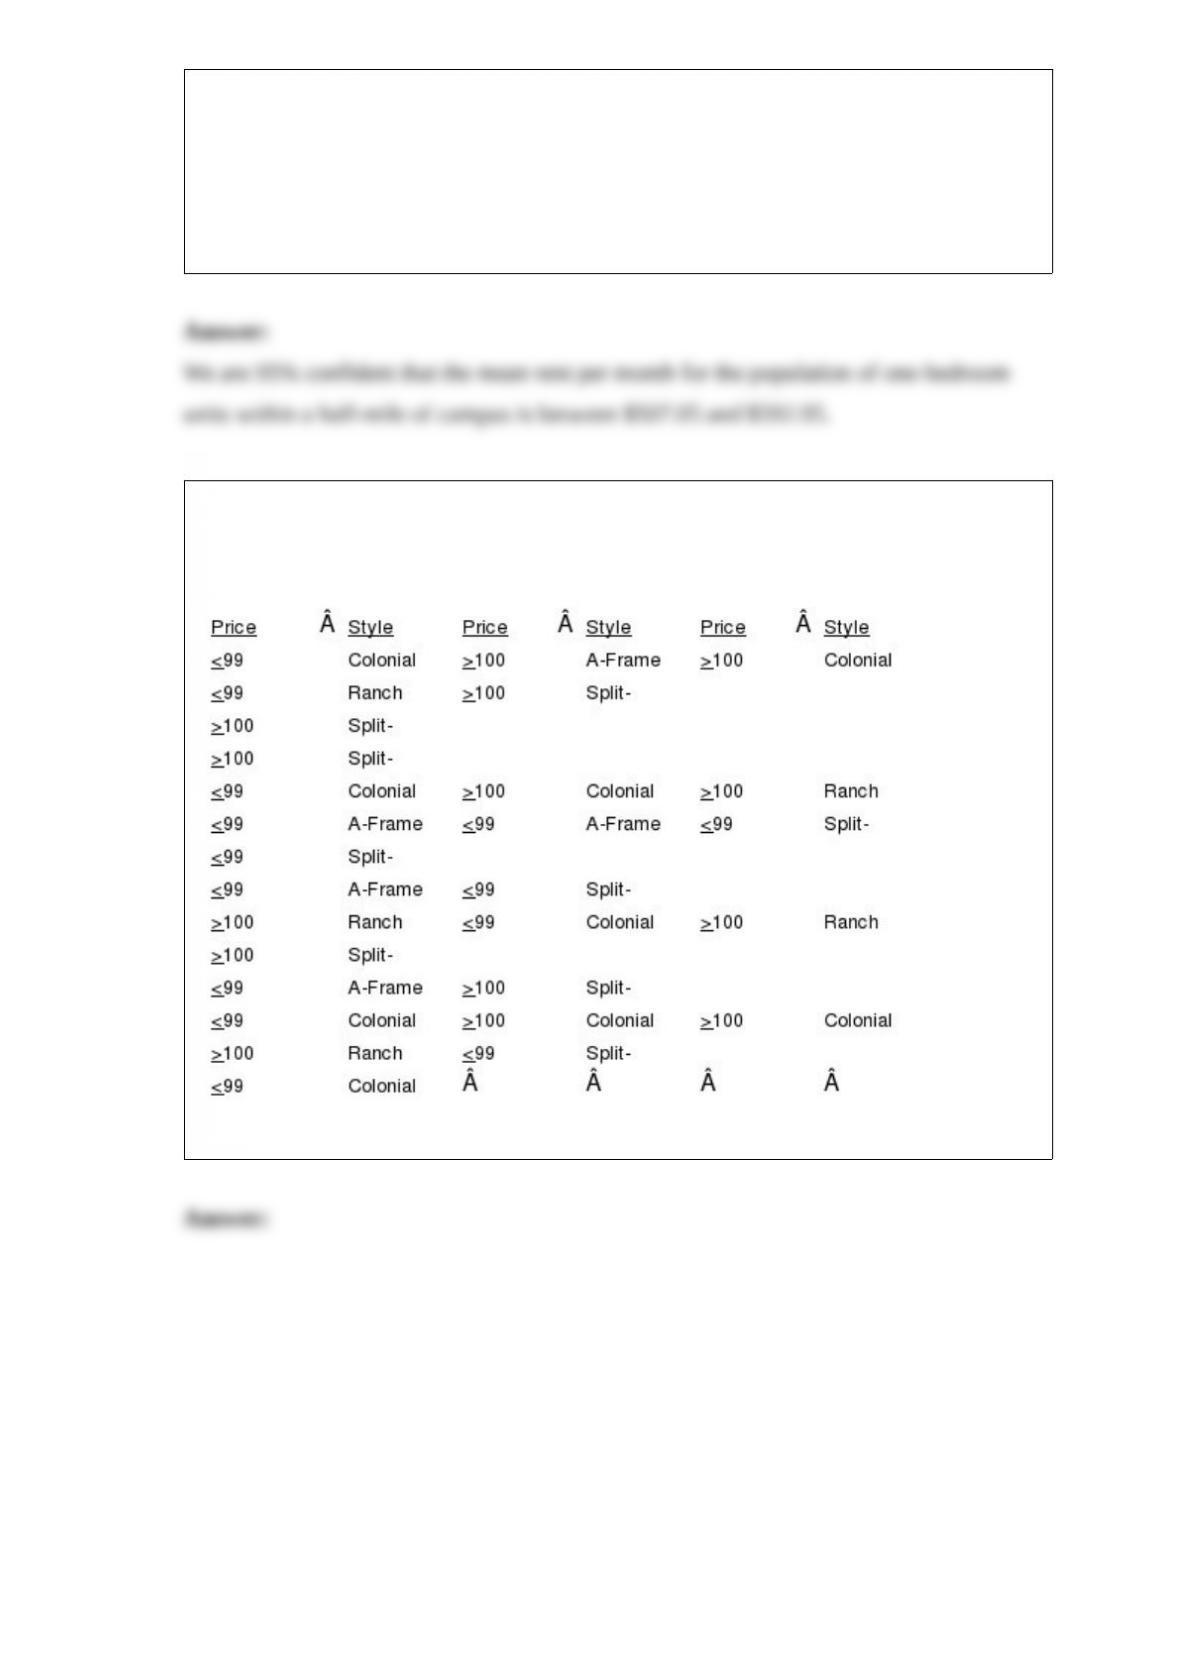
Ithaca Log Homes manufactures four styles of log houses that are sold in kits. The price
(in $000) and style of homes the company has sold in the past year are shown below.
Prepare a crosstabulation for the variables price and style.
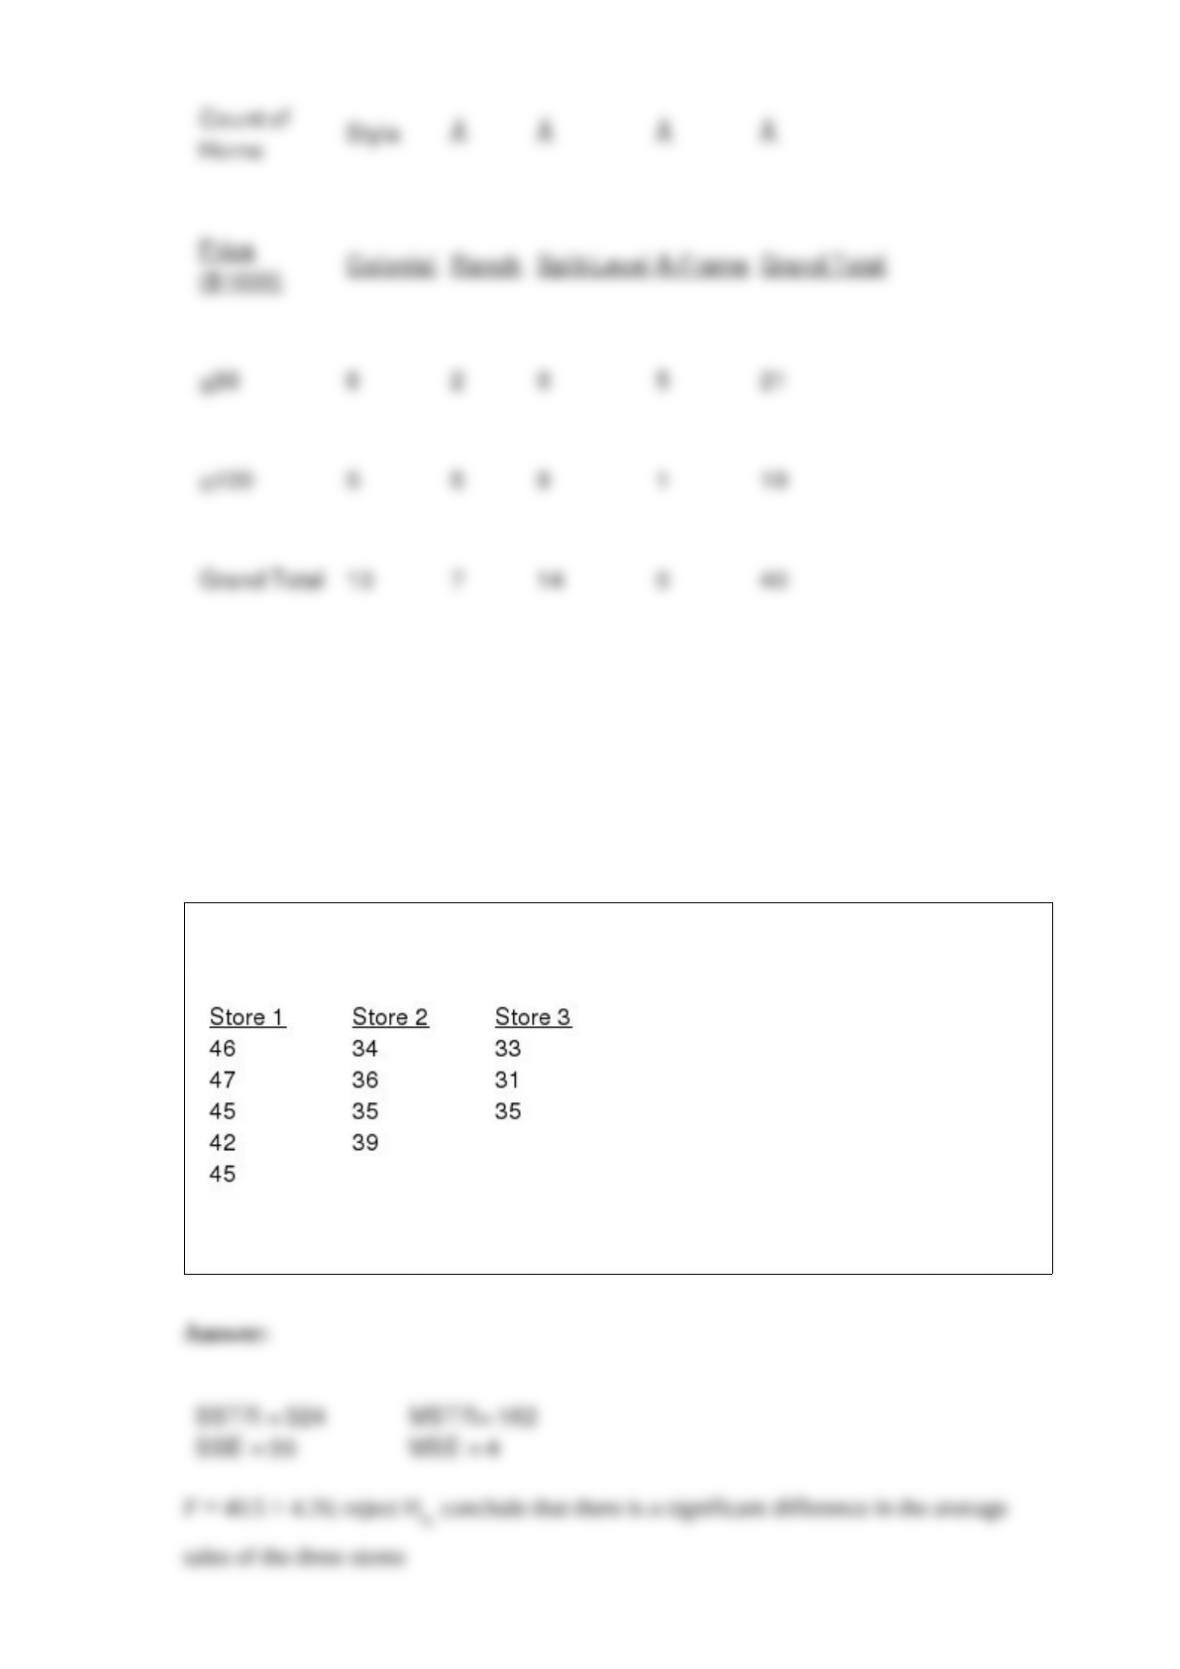
Halls, Inc. has three stores located in three different areas. Random samples of the sales
of the three stores (In $1,000) are shown below.
At a 5% level of significance, test to see if there is a significant difference in the
average sales of the three stores.