
Z is a standard normal random variable. The P(1.05 z 2.13) equals
a. 0.8365
b. 0.1303
c. 0.4834
d. None of the alternative answers is correct.
A population has a mean of 80 and a standard deviation of 7. A sample of 49
observations will be taken. The probability that the mean from that sample will be
larger than 82 is
a. 0.5228
b. 0.9772
c. 0.4772
d. 0.0228
The interval estimate of the mean value of y for a given value of x is the
a. confidence interval
b. prediction interval
c. residual interval
d. correlation interval
The makers of Compute-All know that in the past, 40% of their sales were from people
under 30 years old, 45% of their sales were from people who are between 30 and 50
years old, and 15% of their sales were from people who are over 50 years old. A sample
of 300 customers was taken to see if the market shares had changed. In the sample, 100
of the people were under 30 years old, 150 people were between 30 and 50 years old,
and 50 people were over 50 years old.
a. State the null and alternative hypotheses to be tested.
b. Compute the test statistic.
c. The null hypothesis is to be tested at the 1% level of significance. Determine the
critical value from the table.
d. What do you conclude?
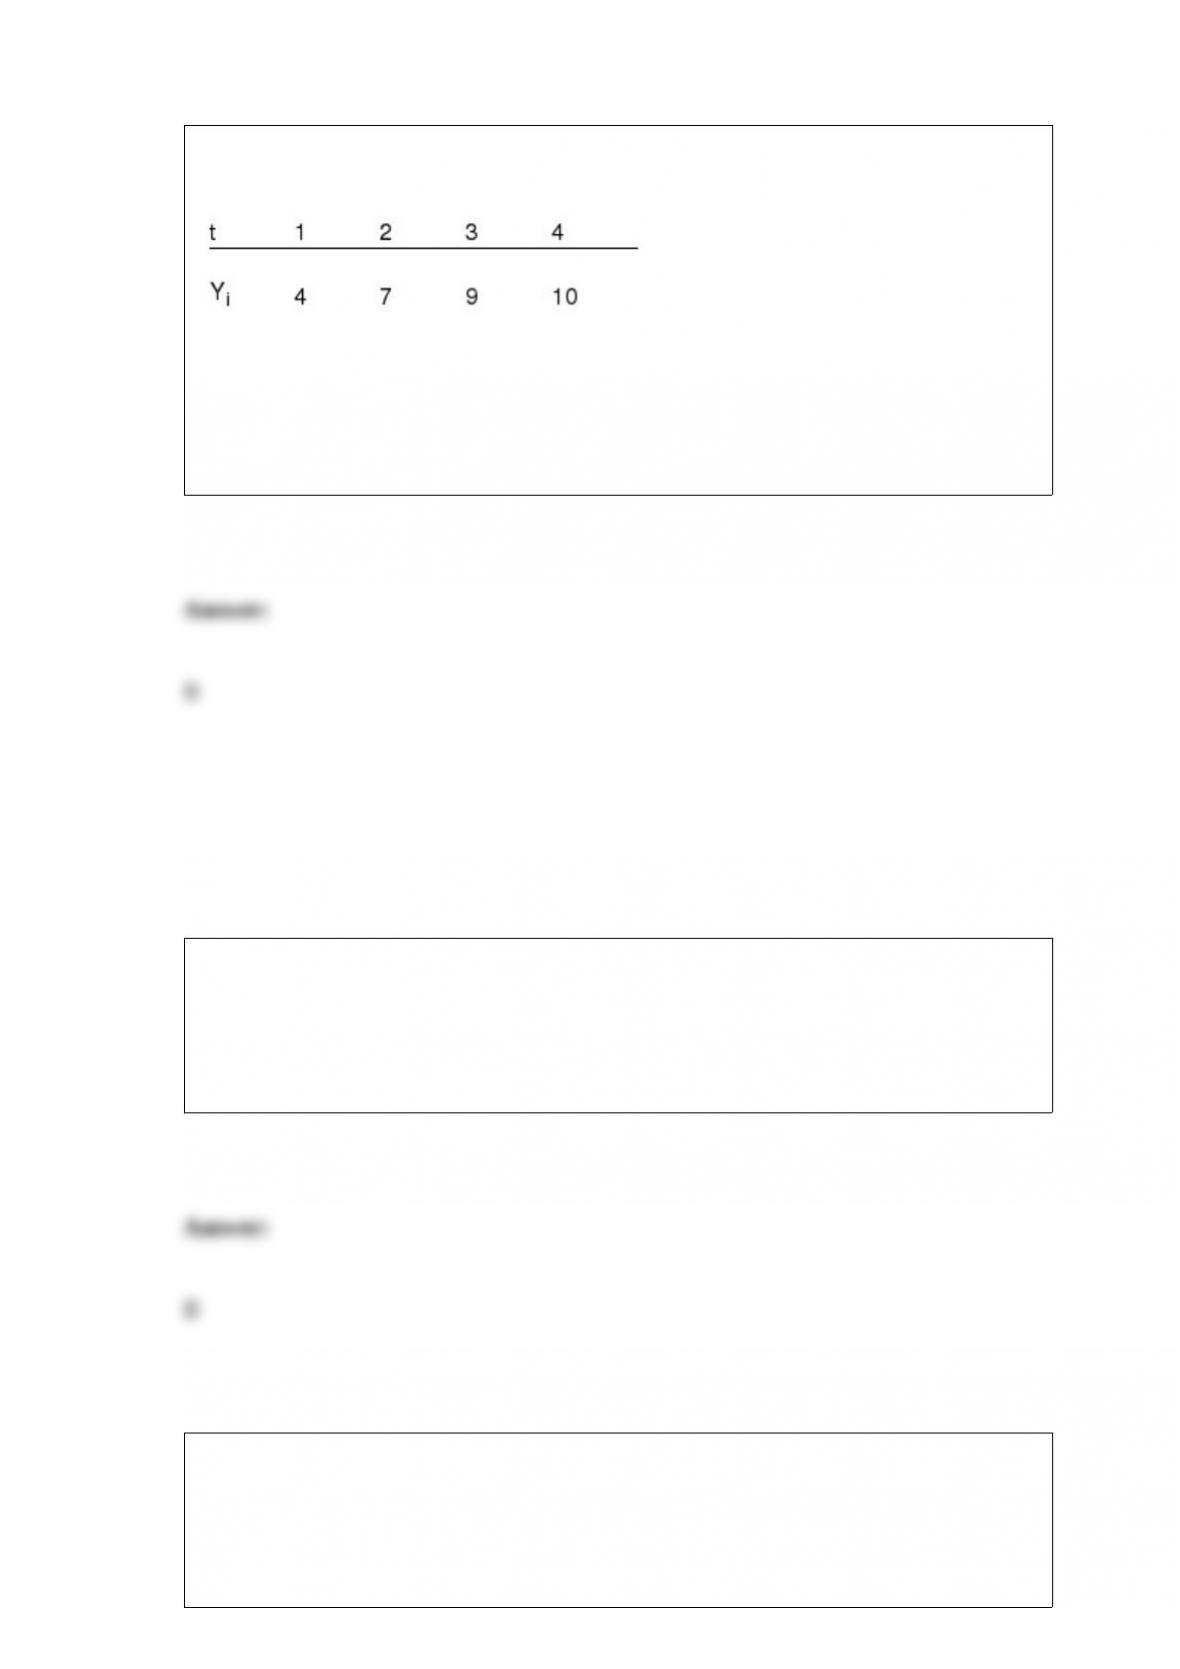
Exhibit 17-2
Consider the following time series.
Refer to Exhibit 17-2. The slope of linear trend equation, b1, is
a. 2.5
b. 2.0
c. 1.0
d. 1.25
A numerical measure of linear association between two variables is the
a. variance
b. covariance
c. standard deviation
d. coefficient of variation
Errors such as measurement error, processing error, and interviewer error are
a. sampling errors
b. nonsampling errors

c. could be either sampling or nonsampling errors
d. impossible to detect
The expected value of information that would tell the decision maker exactly which
state of nature is going to occur is
a. the expected value of sample information
b. the expected value of perfect information
c. the maximum information
d. the expected value
Excel’s __________ function can be used to compute the population standard deviation.
a. MAX
b. MODE
c. STDEV
d. None of the other answers are correct.
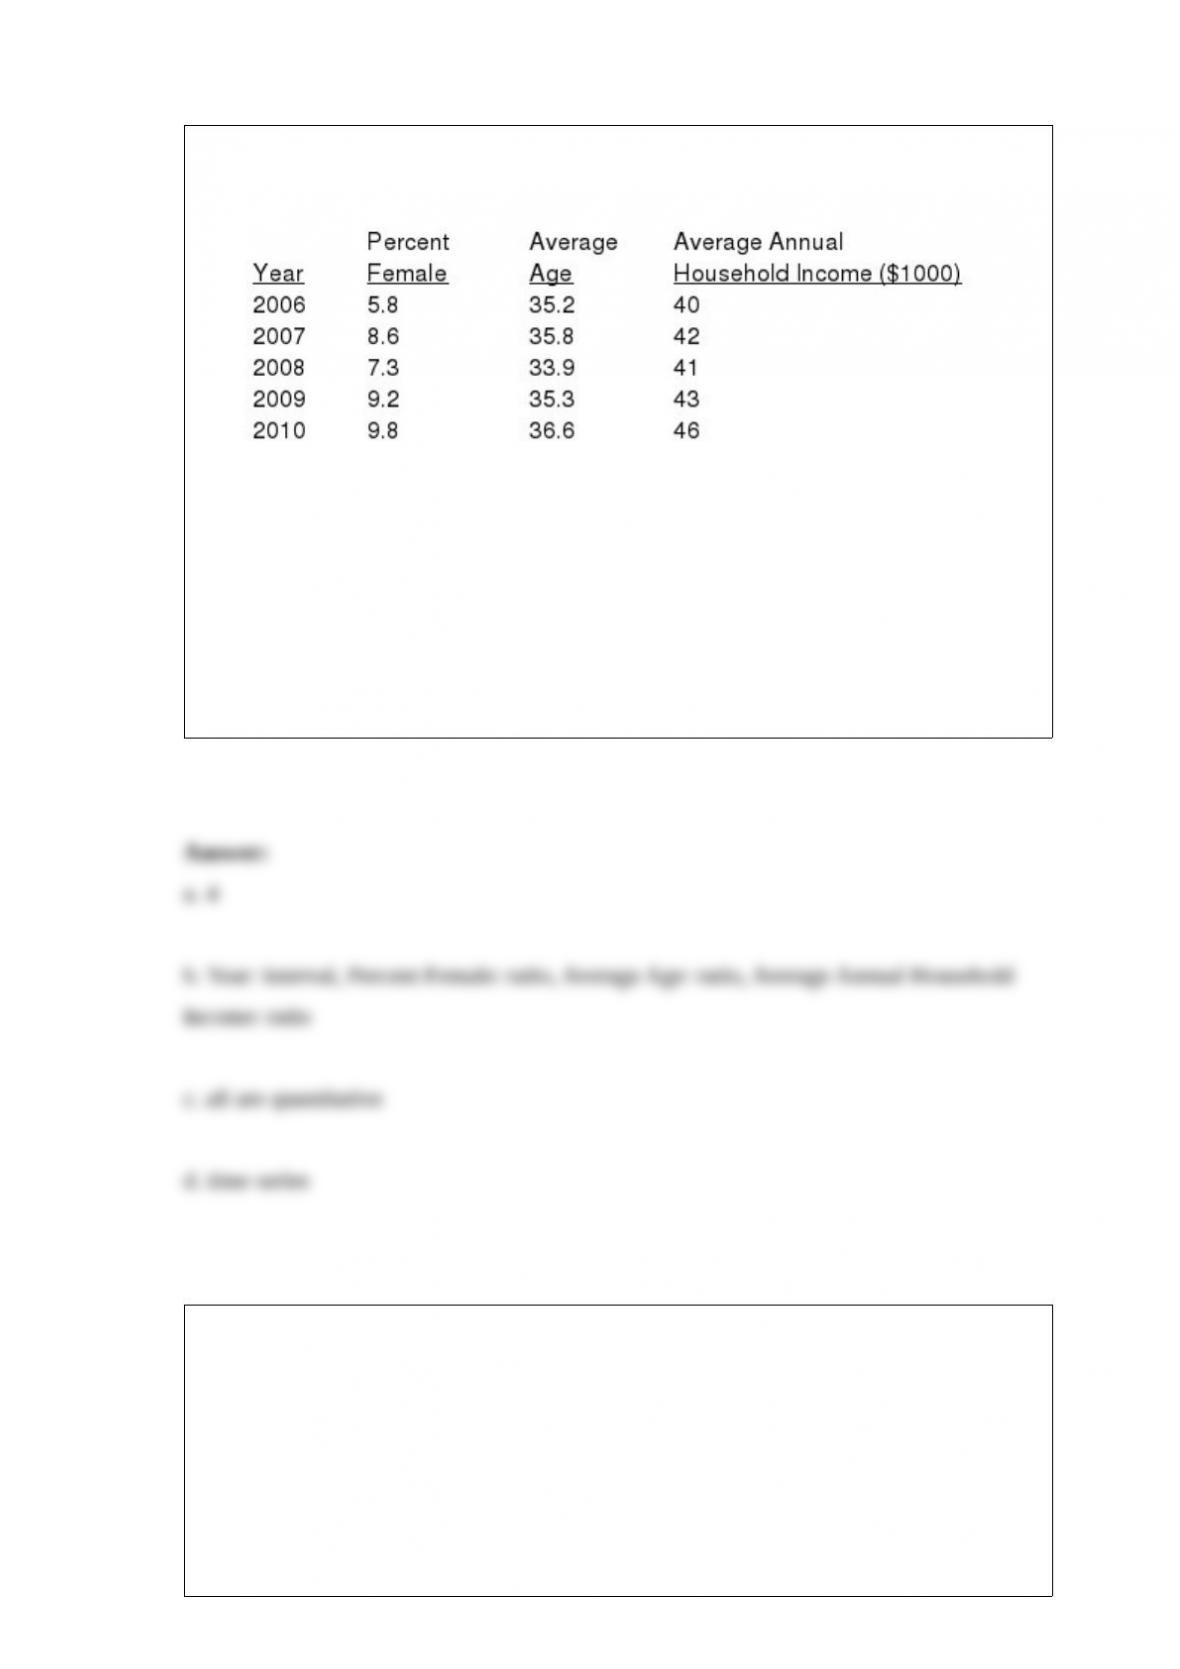
A magazine surveys a sample of its subscribers every year. Some of the responses are
shown below.
a. How many variables are in the data set?
b. Name the scale of measurement for each variable.
c. Which of the above (Year, Percent Female, Average Age, Average Annual Household
Income) are categorical and which are quantitative?
d. Are the data time series or cross-sectional?
Twenty percent of the students in a class of 100 are planning to go to graduate school.
The standard deviation of this binomial distribution is
a. 20
b. 16
c. 4

d. 2
Since the sample size is always smaller than the size of the population, the sample mean
must
a. always be smaller than the population mean
b. be larger than the population mean
c. be equal to the population mean
d. None of the alternative ANSWERS is correct.
43. The test for goodness of fit
a. is always a lower-tail test
b. is always an upper-tail test
c. is always a two-tailed test
d. can be a lower- or upper-tail test

Exhibit 1-1
In a recent study based upon an inspection of 200 homes in Daisy City, 120 were found
to violate one or more city codes.
Refer to Exhibit 1-1. The manager’s statement that 60% of Daisy City’s 3,000 homes are
in violation of city codes is
a. an exactly correct statement
b. only an approximation, since it is based upon sample information
c. obviously wrong, since it is based upon a study of only 200 homes
d. None of the other answers are correct.
A manager is thinking of providing, on a regular basis, in-house training for employees
preparing for an inventory management certification exam. In the past, some employees
received the in-house training before taking the exam, while others did not. Independent
random samples taken from the company’s records provided the following exam scores
for 10 workers who did not receive in-house training and 8 workers who did receive
training. (The manager is confident that the distributions of both populations’ exam
scores are approximately normal.)
No Training Training
76 80
80 66
60 71
91 79
73 94
77 74
82 83
68 78
75
86
a. Develop a 95% confidence interval estimate for the difference between the average
test scores for the two populations of employees.
b. Using
= .05, test for any difference between the average test scores for the two
populations of employees.