
The mean of a sample is
a. always equal to the mean of the population
b. always smaller than the mean of the population
c. computed by summing the data values and dividing the sum by (n 1)
d. computed by summing all the data values and dividing the sum by the number of
items
Z is a standard normal random variable. The P(1.20 z 1.85) equals
a. 0.4678
b. 0.3849
c. 0.8527
d. 0.0829
Exhibit 10-3
A statistics teacher wants to see if there is any difference in the abilities of students
enrolled in statistics today and those enrolled five years ago. A sample of final
examination scores from students enrolled today and from students enrolled five years
ago was taken. You are given the following information.

Refer to Exhibit 10-3. The 95% confidence interval for the difference between the two
population means is
a. -9.92 to -2.08
b. -3.92 to 3.92
c. -13.84 to 1.84
d. -24.228 to 12.23
The minimum number of variables represented in a histogram is
a. 1
b. 2
c. 3
d. 4
The __________ denotes the number of standard deviations xi is from the mean .
a. range
b. median
c. z-score
d. third quartile
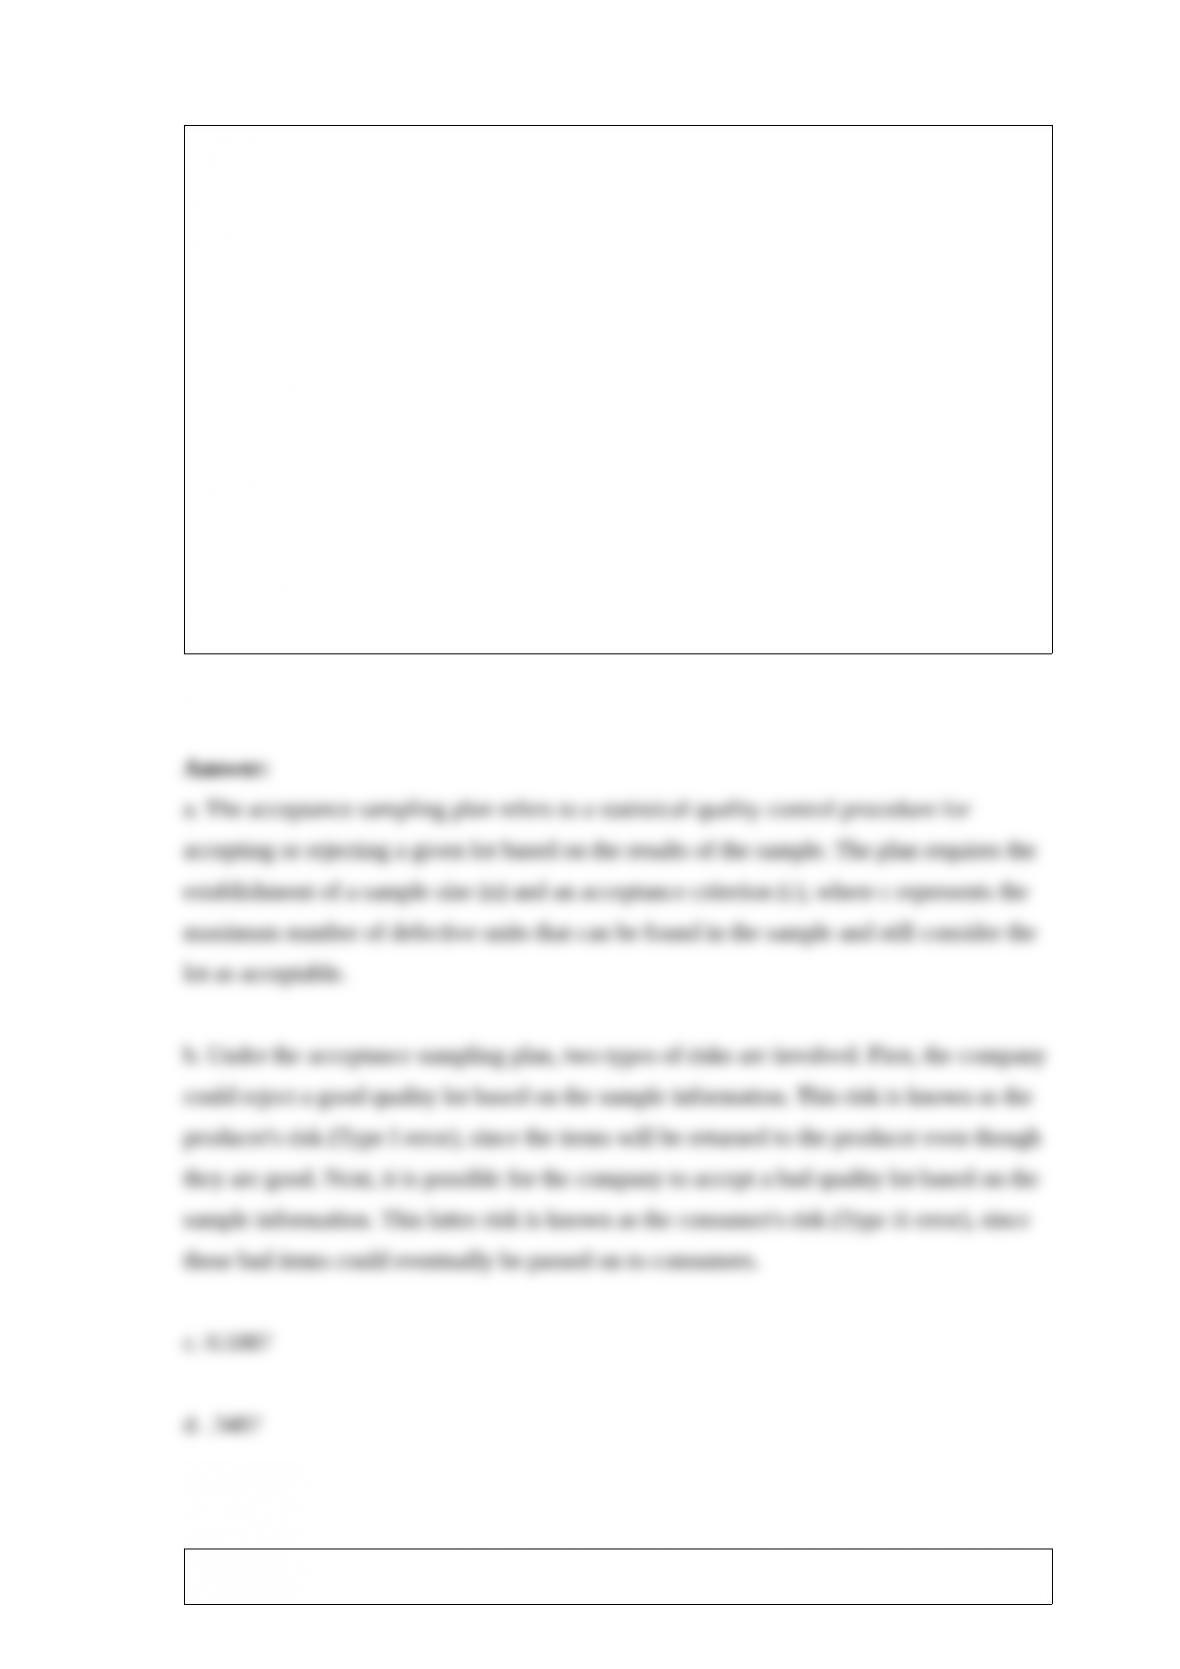
Brakes Shop, Inc. is a franchise that specializes in repairing brake systems of
automobiles. The company purchases brake shoes from a national supplier. Currently,
lots of 1,000 brake shoes are purchased, and each shoe is inspected before being
installed on an automobile. The company has decided, instead of 100% inspection, to
adopt an acceptance sampling plan.
a. Explain what is meant by the acceptance sampling plan.
b. If the company decides to adopt an acceptance sampling plan, what kinds of risks are
there?
c. The quality control department of the company has decided to select a sample of 10
shoes and inspect them for defects. Furthermore, it has been decided that if the sample
contains no defective parts, the entire lot will be accepted. If there are 50 defective
shoes in a shipment, what is the probability that the entire lot will be accepted?
d. What is the probability of accepting the lot if there are 100 defective units in the lot?
When the assumption of equally likely outcomes is used to assign probability values,
the method used to assign probabilities is referred to as the
a. relative frequency method
b. subjective method
c. probability method
d. classical method
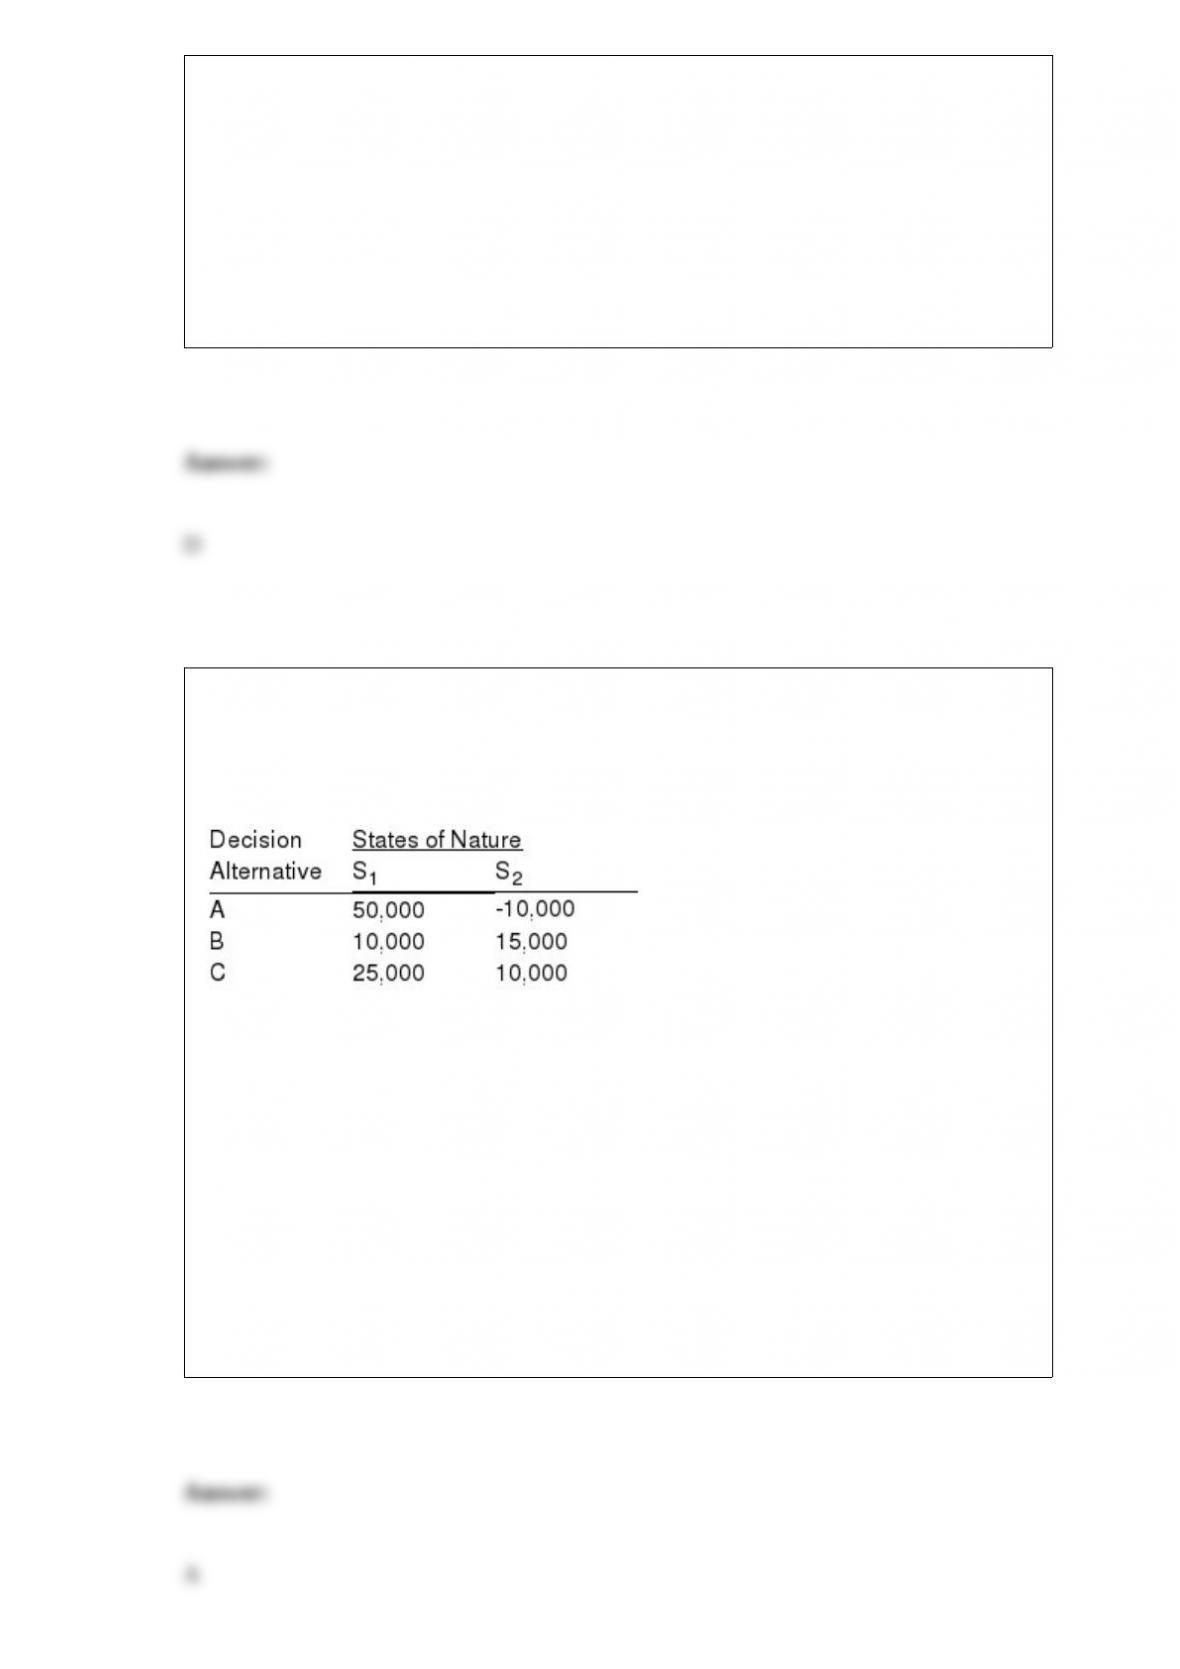
Exhibit 20-3
Below you are given a payoff table involving two states of nature and three decision
alternatives.
The probability of the occurrence of state of nature S1 is 0.4.
Refer to Exhibit 20-3. The expected value of perfect information equals
a. 13,000
b. 14,000
c. 15,000
d. 16,000

Exhibit 15-8
The following estimated regression model was developed relating yearly income (y in
$1,000s) of 30 individuals with their age (x1) and their gender (x2) (0 if male and 1 if
female).
= 30 + 0.7x1 + 3x2
Also provided are SST = 1,200 and SSE = 384.
Refer to Exhibit 15-8. The yearly income of a 24-year-old female individual is
a. $19.80
b. $19,800
c. $49.80
d. $49,800
Exhibit 7-5
Random samples of size 17 are taken from a population that has 200 elements, a mean
of 36, and a standard deviation of 8.
Refer to Exhibit 7-5. Which of the following best describes the form of the sampling
distribution of the sample mean for this situation?
a. Approximately normal because the sample size is small relative to the population
size.
b. Approximately normal because of the central limit theorem.
c. exactly normal
d. None of the alternative answers is correct.
If a hypothesis is rejected at a 5% level of significance, it
a. will always be rejected at the 1% level
b. will always be accepted at the 1% level
c. will never be tested at the 1% level
d. may be rejected or not rejected at the 1% level
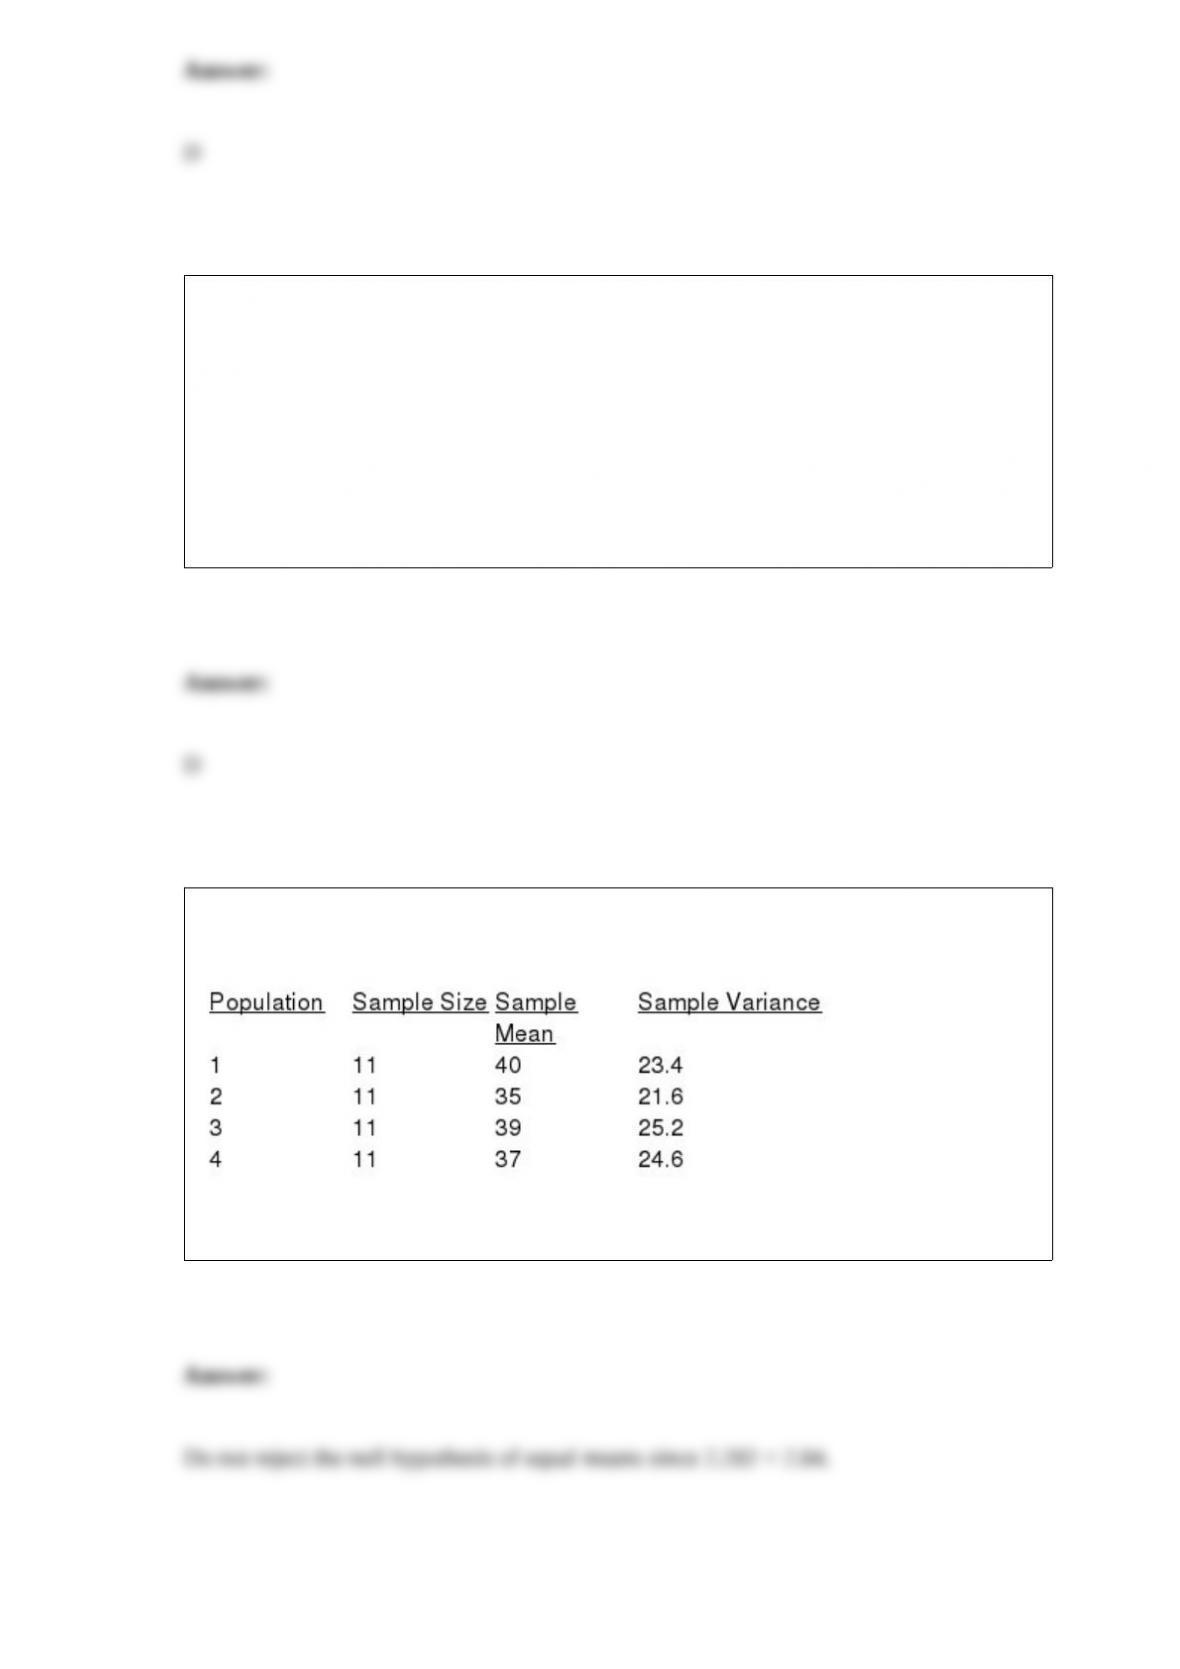
For four populations, the population variances are assumed to be equal. Random
samples from each population provide the following data.
Using a .05 level of significance, test to see if the means for all four populations are the
same.

The daily production rates for a sample of factory workers before and after a training
program are shown below. Let d = After – Before.
We want to determine if the training program was effective.
a. Give the hypotheses for this problem.
b. Compute the test statistic.
c. At 95% confidence, test the hypotheses. That is, did the training program actually
increase the production rates?
Random samples of size 36 are taken from a process (an infinite population) whose
mean and standard deviation are 20 and 15, respectively. The distribution of the
population is unknown. The mean and the standard error of the distribution of sample
mean are
a. 36 and 15
b. 20 and 15
c. 20 and 0.417
d. 20 and 2.5

The probability that the interval estimation procedure will generate an interval that does
not contain the actual value of the population parameter being estimated is the
a. level of significance
b. confidence level
c. confidence coefficient
d. error factor
Exhibit 6-1
Consider the continuous random variable x, which has a uniform distribution over the
interval from 20 to 28.
Refer to Exhibit 6-1. The probability that x will take on a value of at least 26 is
a. 0.000
b. 0.125
c. 0.250
d. 1.000

A simple random sample of 64 observations was taken from a large population. The
population standard deviation is 120. The sample mean was determined to be 320. The
standard error of the mean is
a. 1.875
b. 40
c. 5
d. 15
Exhibit 6-7
Refer to Exhibit 6-7. The mean of x is
a. 0.10
b. 10
c. 100
d. 1,000

Exhibit 2-1
The numbers of hours worked (per week) by 400 statistics students are shown below.
Refer to Exhibit 2-1. The cumulative relative frequency for the class of 20 29
a. is 300
b. is 0.25
c. is 0.75
d. is 0.5
Variance is
a. a measure of the average, or central value of a random variable
b. a measure of the dispersion of a random variable
c. the square root of the standard deviation
d. the sum of the deviation of data elements from the mean
In the last presidential election before the candidates began their major campaigns, the
percentages of registered voters who favored the various candidates were as follows:
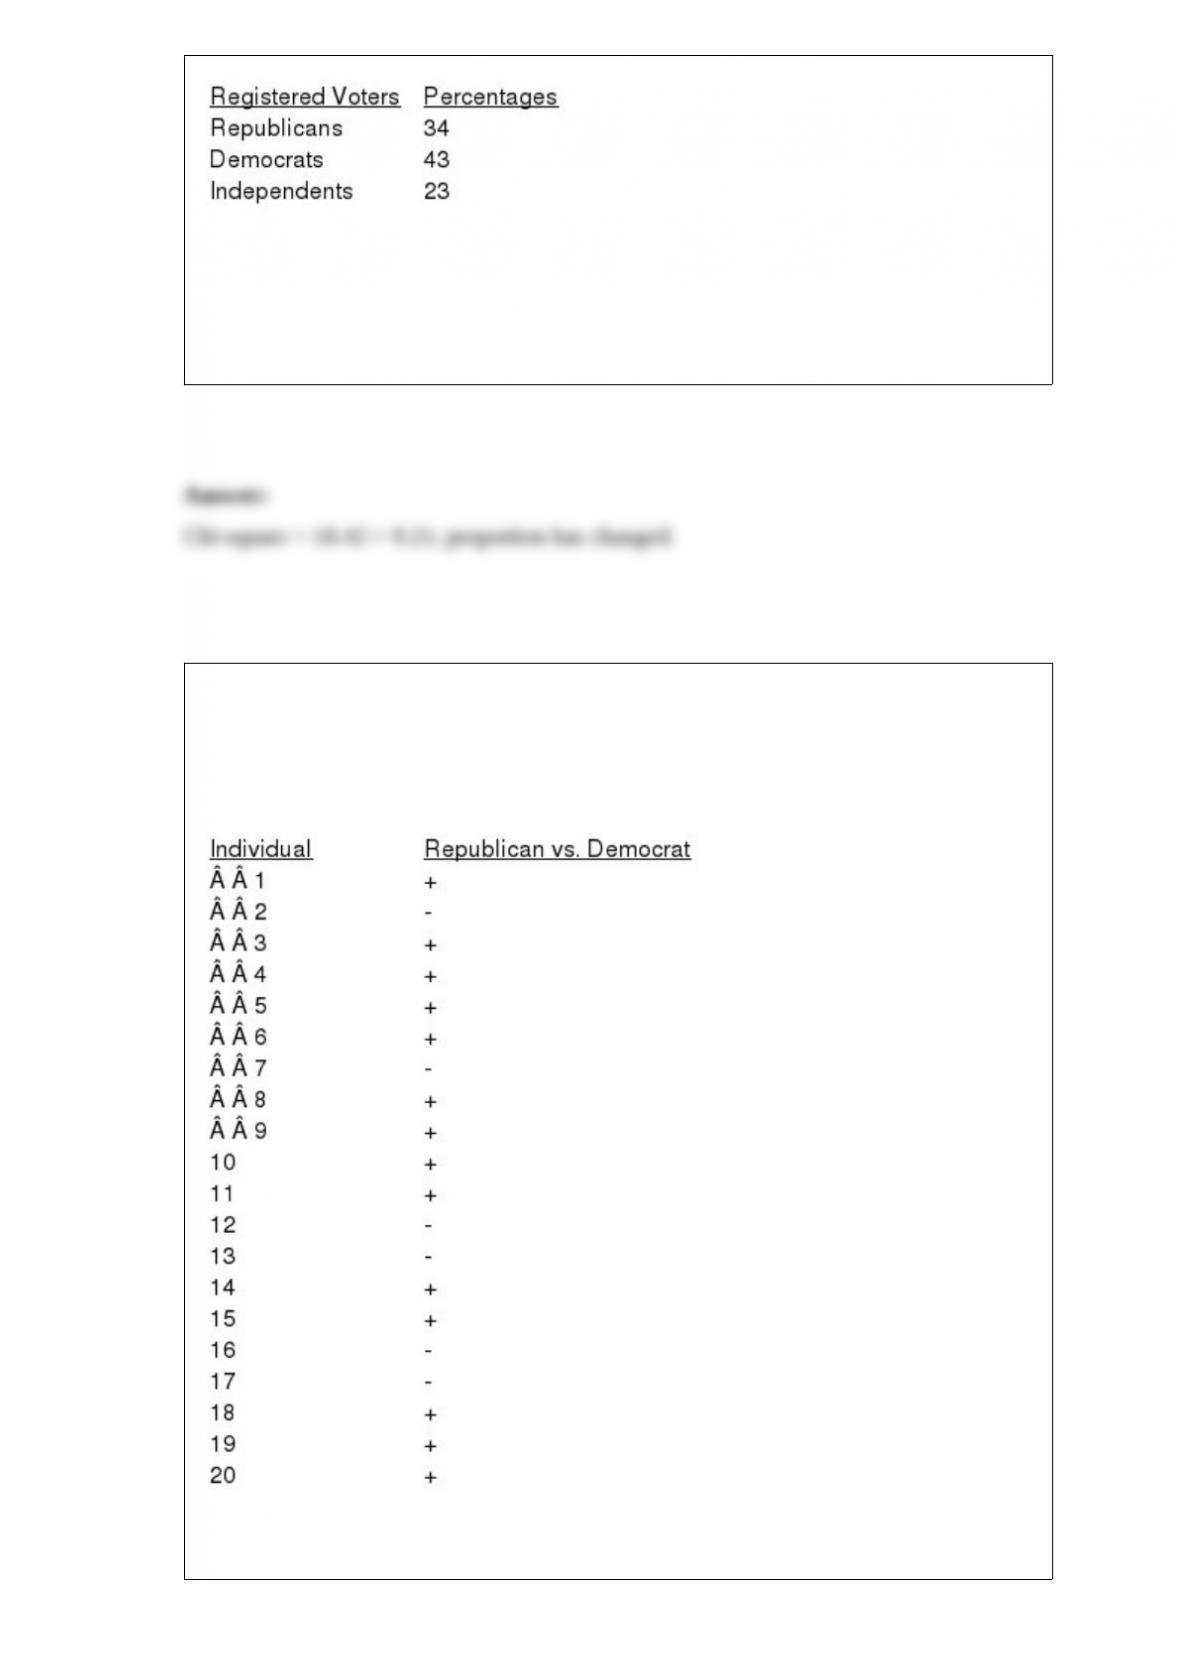
After the major campaigns began, a random sample of 400 voters showed that 172
favored the Republican candidate; 164 were in favor of the Democratic candidate; and
64 favored the Independent candidate. Test with = .01 to see if the proportion of
voters who favored the various candidates changed.
The following data show the preference of 20 people for a candidate to a public office.
A “+” indicates a preference for the Democratic candidate, and a “” indicates a
preference for the Republican candidate.
With = 0.05, test for a significant difference in the preference for the candidates.
You are given the following data on times (in minutes) to complete a race. Construct a
stem-and-leaf display. Specify the leaf unit for the display.
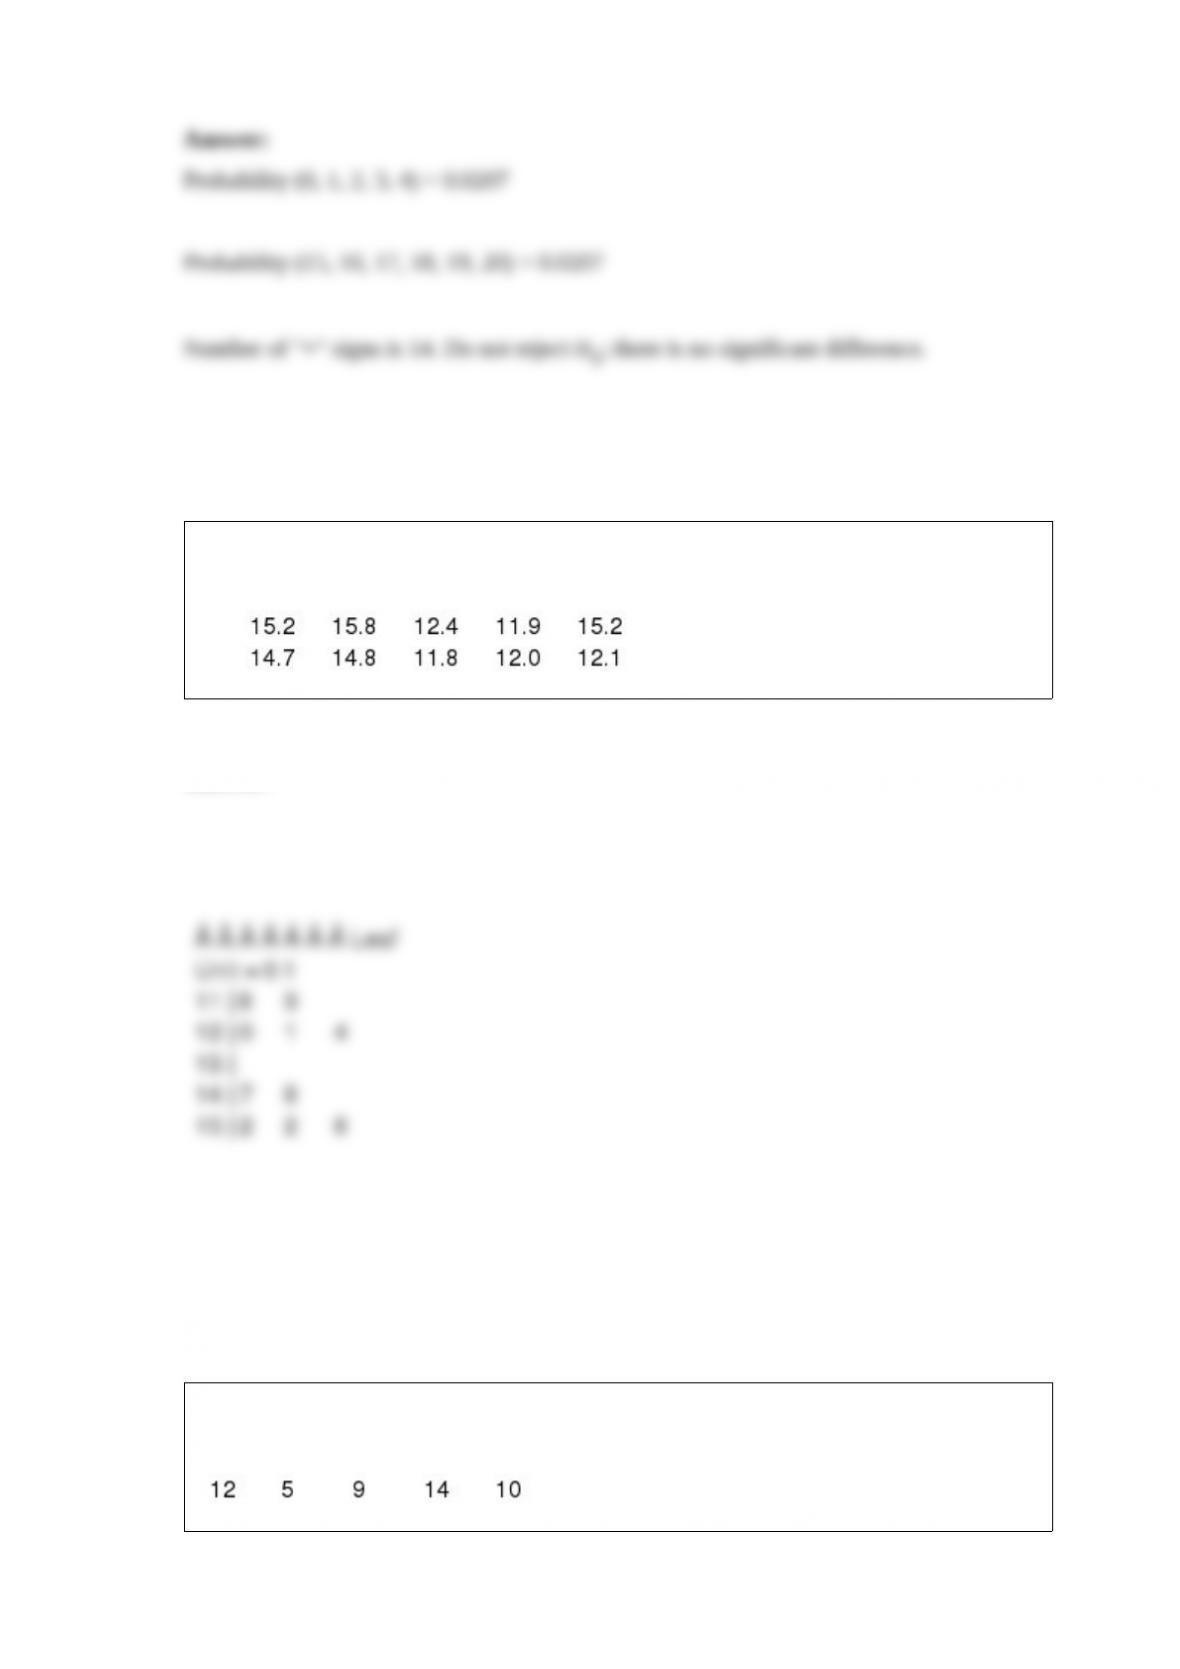
Do the following data indicate that the variance of the population from which this
sample has been drawn is 17? Use = 0.05.
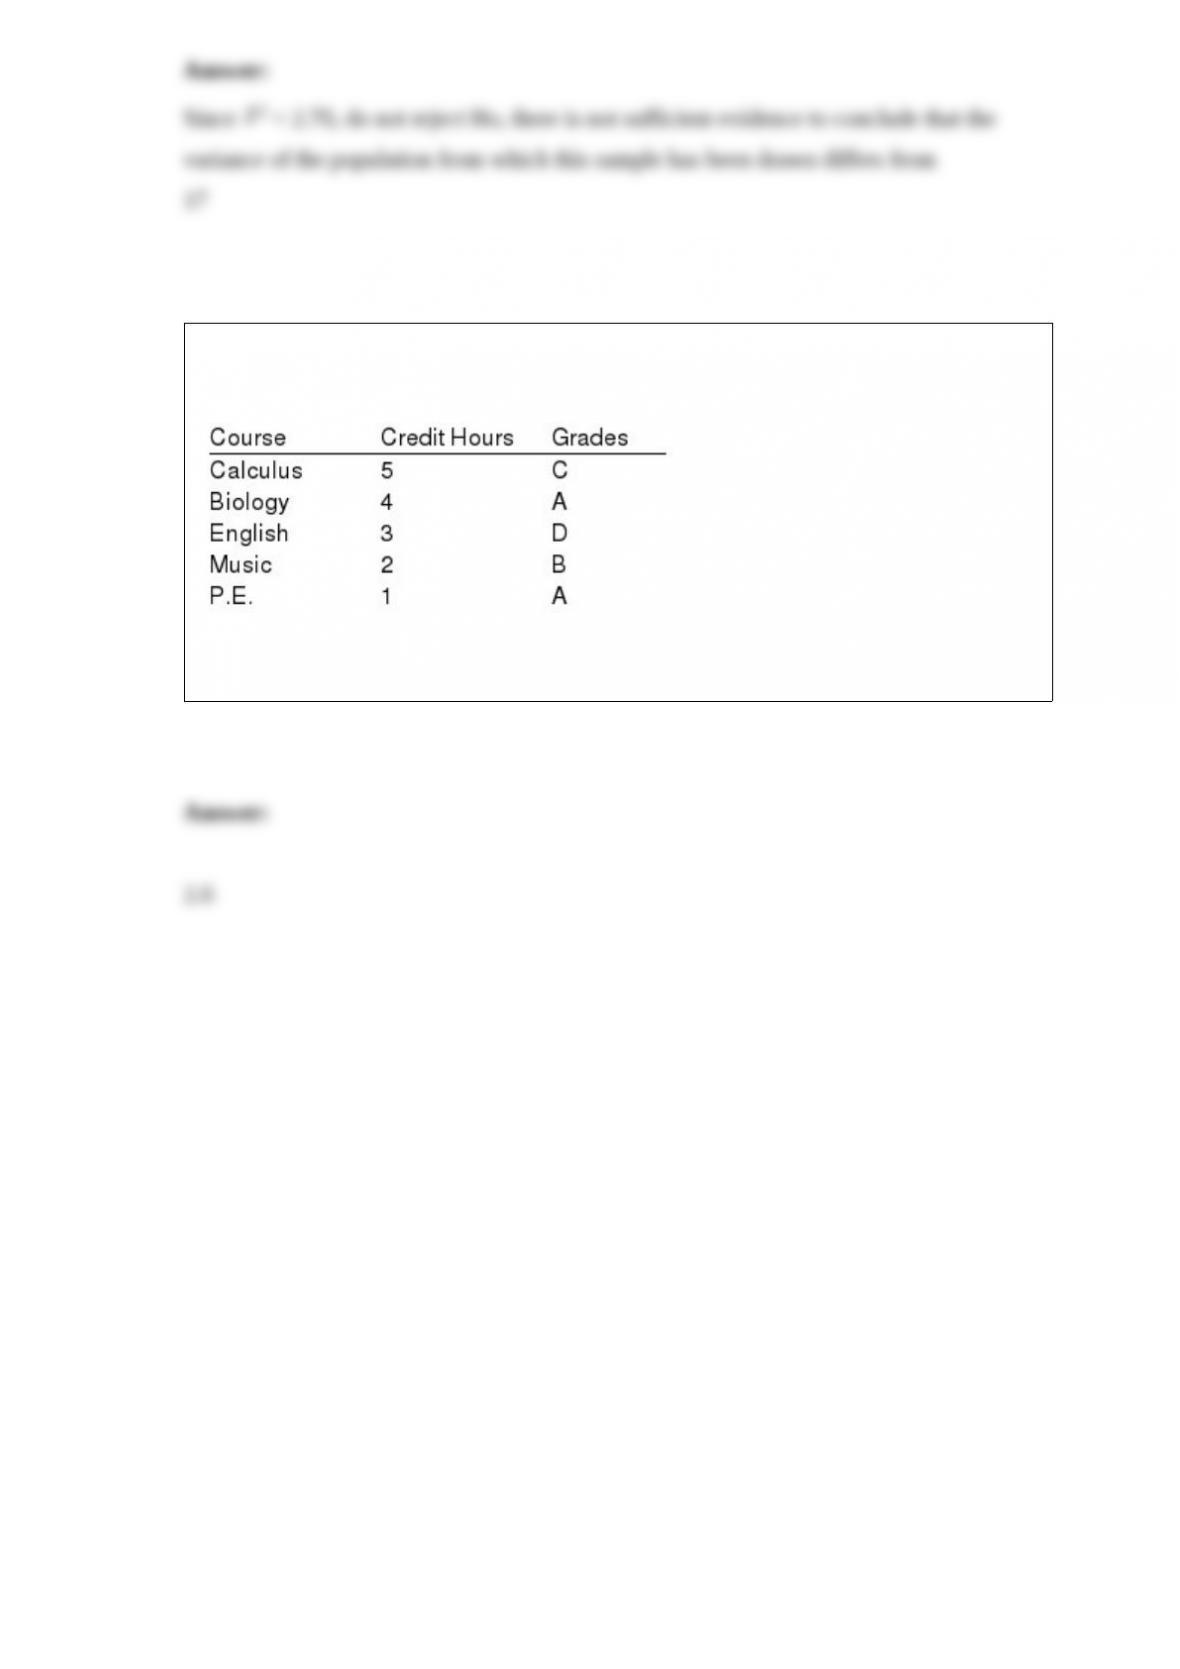
Paul, a freshman at a local college just completed 15 credit hours. His grade report is
presented below.
The local university uses a 4 point grading system, i.e., A 4, B 3, C 2, D 1, F
0. Compute Paul’s semester grade point average.