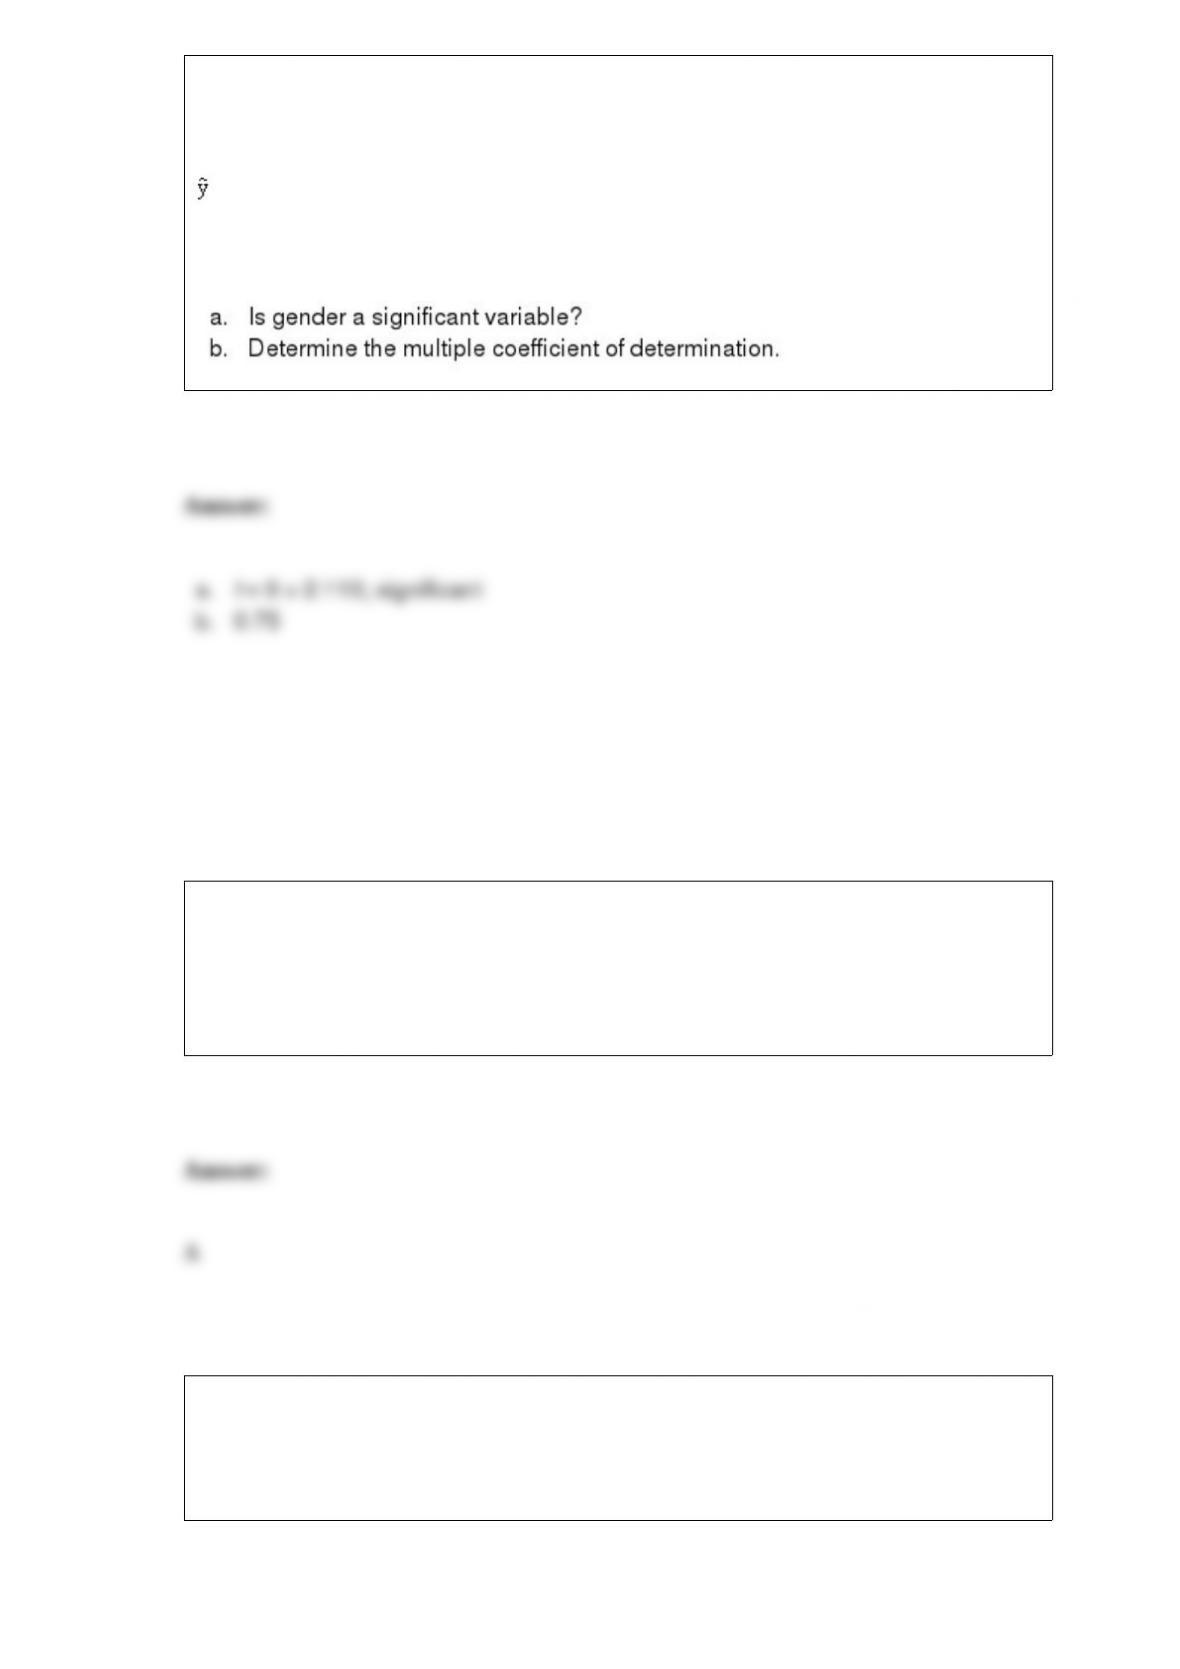
A regression model relating the yearly income (y), age (x1), and the gender of the
faculty member of a university (x2 = 1 if female and 0 if male) resulted in the following
information.
= 5,000 + 1.2x1 + 0.9x2
n = 20 SSE = 500 SSR = 1,500
Sb1 = 0.2 Sb2 = 0.1
Data that provide labels or names for groupings of like items are known as
a. categorical data
b. quantitative data
c. label data
d. generic data
Exhibit 20-4
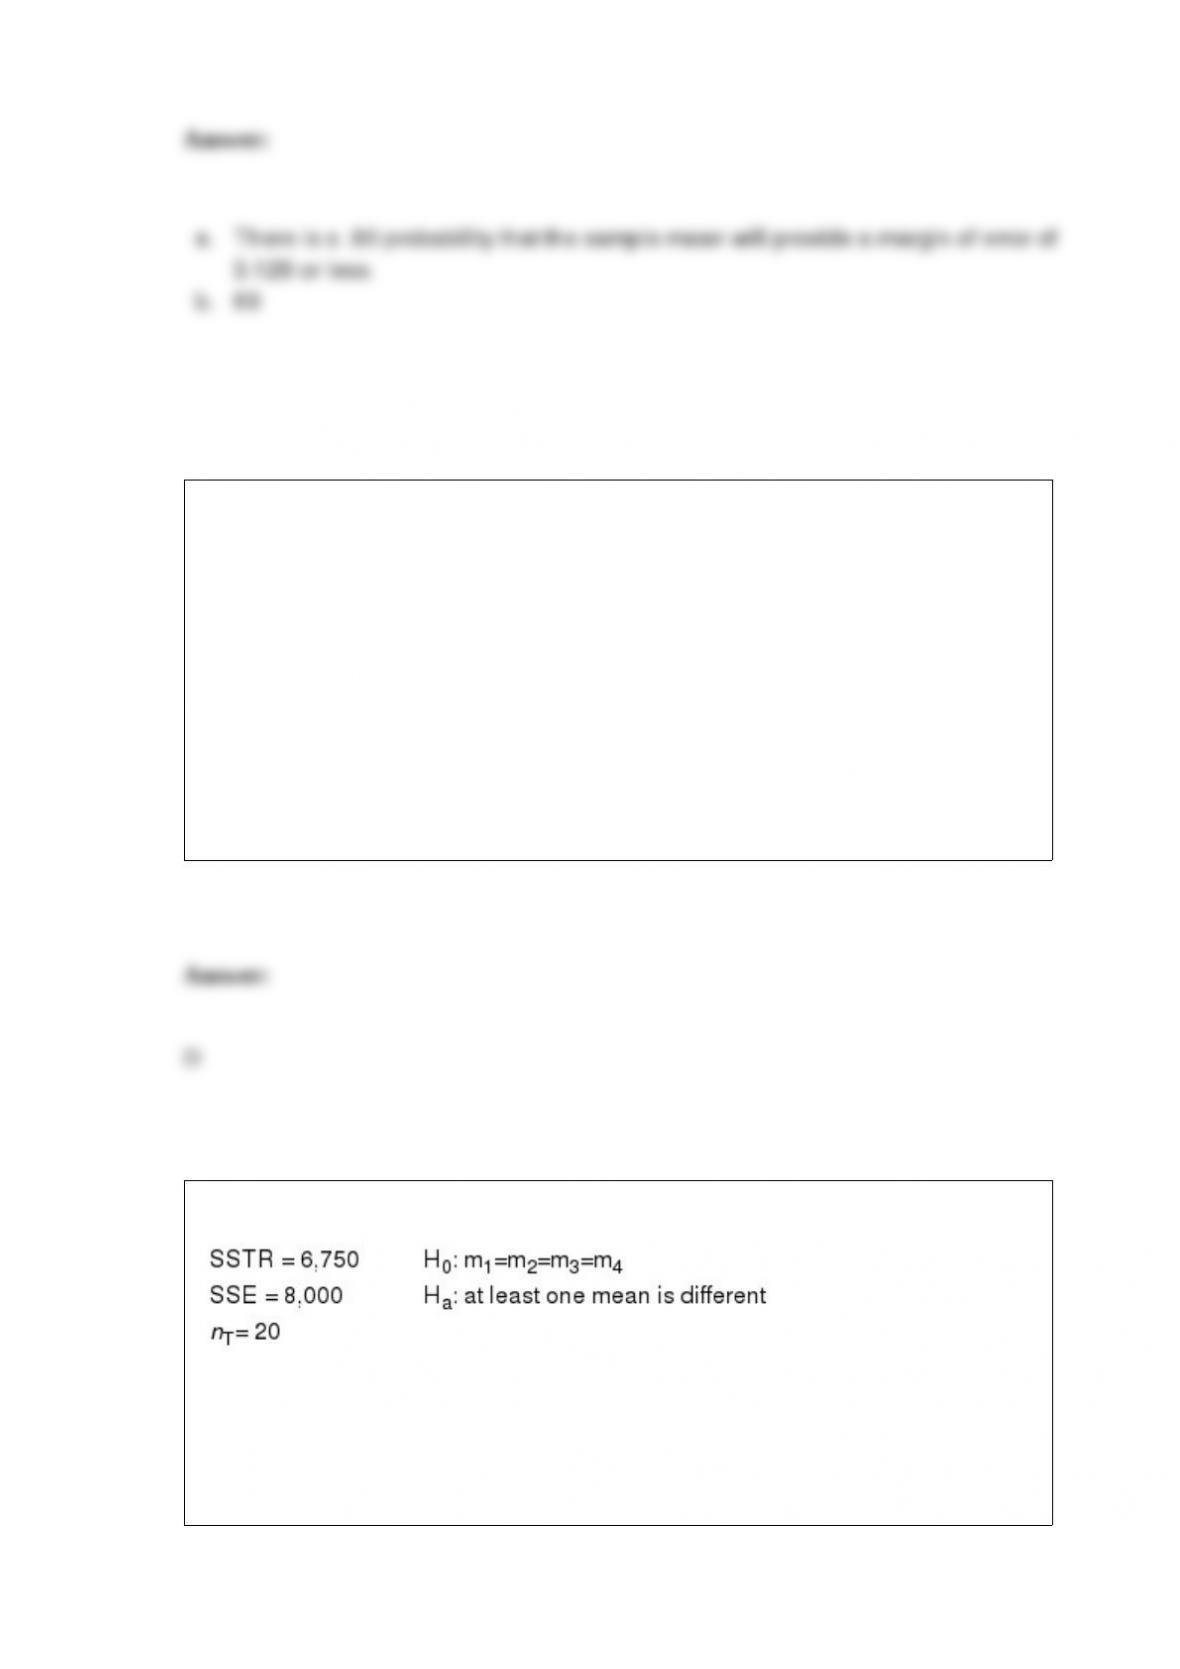
Below you are given a payoff table involving two states of nature and three decision
alternatives.

The probability of occurrence of S1 = 0.3.
Refer to Exhibit 20-4. The expected value of alternative C is
a. 10.2
b. 13.2
c. 12.9
d. 26
A method that uses a weighted average of past values for arriving at smoothed time
series values is known as
a. regression analysis
b. deseasonalization
c. decomposition
d. exponential smoothing

The profits earned by a particular Fortune 500 company, measured in millions of
dollars, is an example of
a. categorical data
b. either categorical or quantitative data
c. neither categorical nor quantitative data
d. quantitative data
In a binomial experiment, the
a. probability of success does not change from trial to trial
b. probability of success does change from trial to trial
c. probability of success could change from trial to trial, depending on the situation
under consideration
d. All of these answers are correct.
It is known that the variance of a population equals 484. A random sample of 81
observations is going to be taken from the population.
Each customer entering a department store will either buy or not buy some
merchandise. An experiment consists of following 3 customers and determining
whether or not they purchase any merchandise. The number of sample points in this
experiment is
a. 2
b. 4
c. 6
d. 8
Exhibit 13-1
Refer to Exhibit 13-1. The test statistic to test the null hypothesis equals
a. 0.22
b. 0.84
c. 4.22
d. 4.5

If two events are independent, then
a. they must be mutually exclusive
b. the sum of their probabilities must be equal to one
c. the probability of their intersection must be zero
d. None of the other answers is correct.
A numerical description of the outcome of an experiment is called a
a. descriptive statistic
b. probability function
c. variance
d. random variable
In a questionnaire, respondents are asked to mark their gender as male or female.
Gender is an example of a
a. categorical variable
b. quantitative variable
c. categorical or quantitative variable, depending on how the respondents answered the
question
d. ratio variable
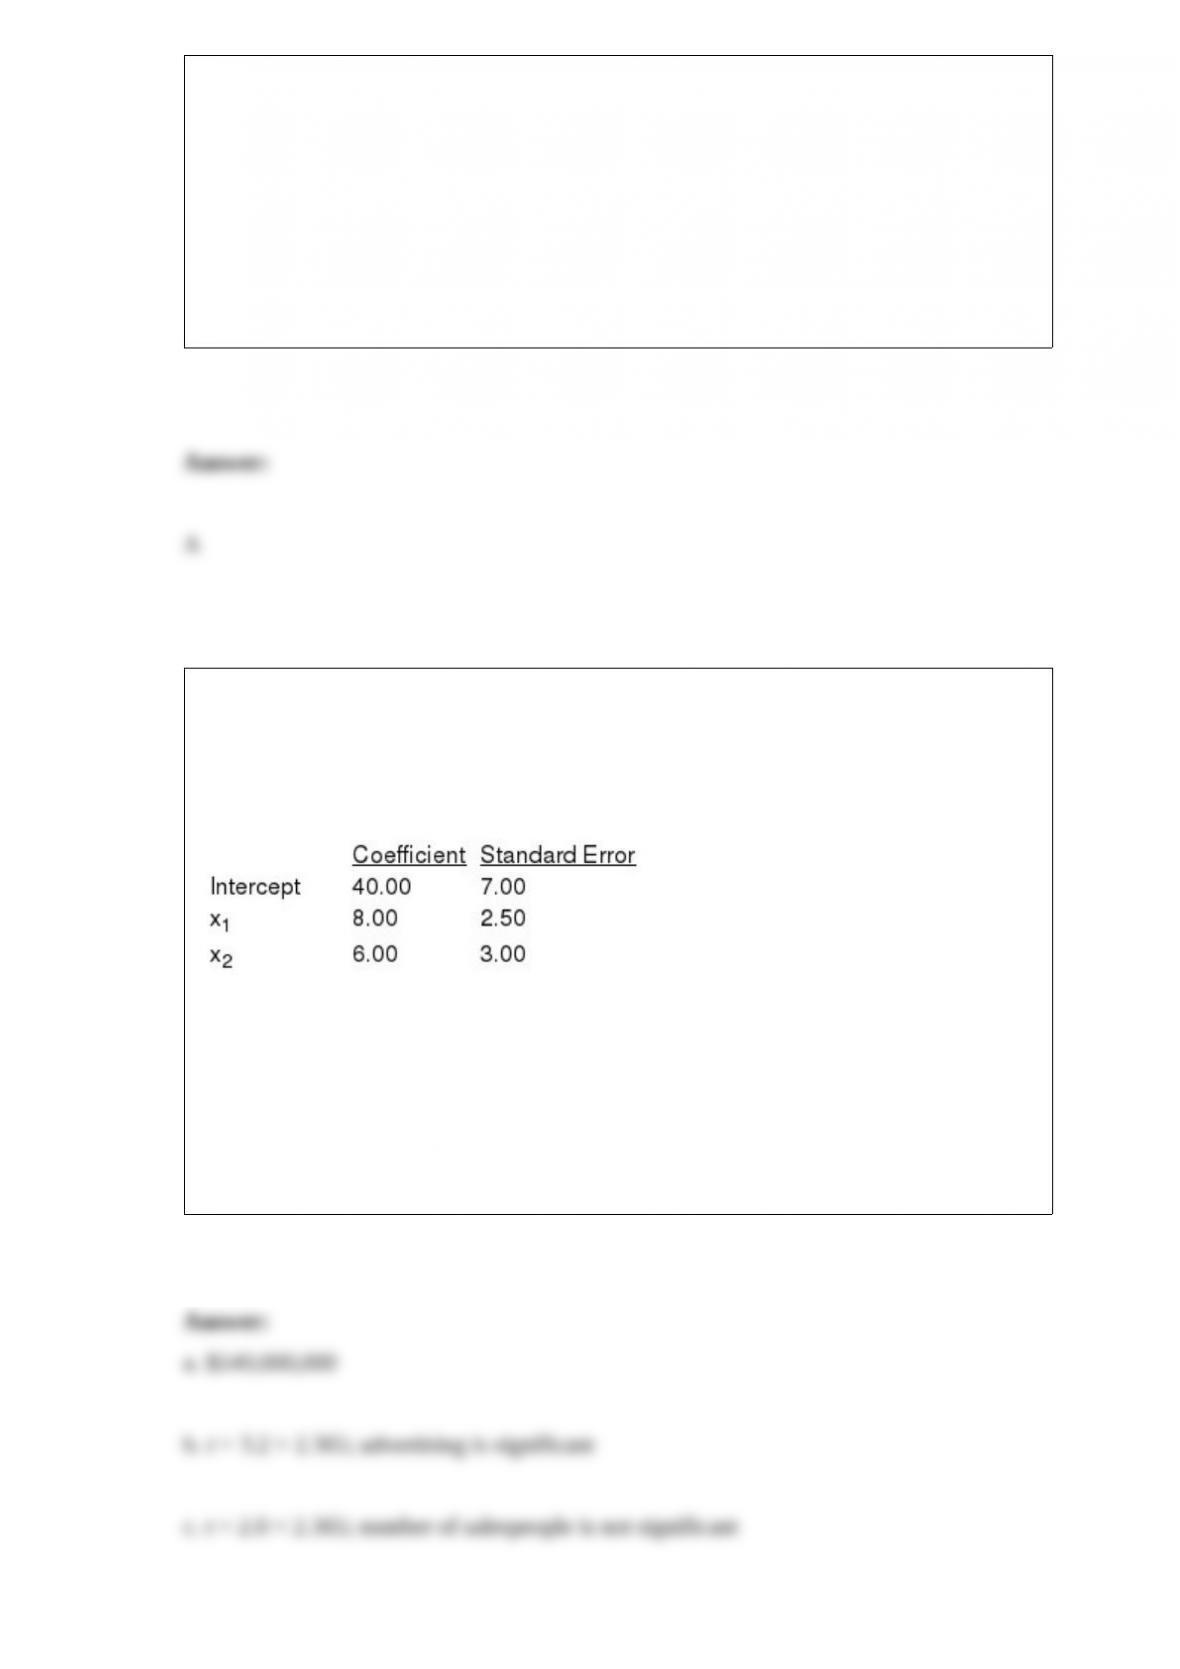
The following is part of the results of a regression analysis involving sales (y in
millions of dollars), advertising expenditures (x1 in thousands of dollars), and number
of salespeople (x2) for a corporation. The regression was performed on a sample of 10
observations.
a. If the company uses $40,000 in advertisement and has 30 salespersons, what are the
expected sales? Give your answer in dollars.
b. At = 0.05, test for the significance of the coefficient of advertising.
c. At = 0.05, test for the significance of the coefficient of the number of salespeople.

__________ can be used to make statements about the proportion of data values that
must be within a specified number of standard deviations of the mean.
a. Chebyshev’s theorem
b. The empirical rule
c. A five-number summary
d. A box plot
If A and B are independent events with P(A) 0.4 and P(B) 0.6, then P(A ‡ B)
a. 0.76
b. 1.00
c. 0.24
d. 0.2
Exhibit 16-4
In a laboratory experiment, data were gathered on the life span (y in months) of 33 rats,
units of daily protein intake (x1), and whether or not agent x2 (a proposed life extending
agent) was added to the rats diet (x2 = 0 if agent x2 was not added, and x2 = 1 if agent
was added.) From the results of the experiment, the following regression model was
developed.
= 36 + 0.8x1 – 1.7x2

Also provided are SSR = 60 and SST = 180.
Refer to Exhibit 16-4. The model
a. is significant
b. is not significant
c. Not enough information is provided to answer this question.
d. None of these alternatives is correct.
The 50th percentile is the
a. mode
b. median
c. mean
d. third quartile
The error of rejecting a true null hypothesis is
a. a Type I error
b. a Type II error
c. can be either a or b, depending on the situation
d. committed when not enough information is available

For a one-tailed test (upper tail) with a sample size of 900, the null hypothesis will be
rejected at the .05 level of significance if the test statistic is
a. less than or equal to -1.645
b. greater than or equal to 1.645
c. less than 1.645
d. less than -1.96
44. The number of categories of outcomes per trial for a multinomial probability
distribution is
a. two or more
b. three or more
c. four or more
d. five or more