Prior probabilities are the probabilities of the states of nature
a. after obtaining sample information
b. prior to obtaining of perfect information
c. prior to obtaining sample information
d. after obtaining perfect information
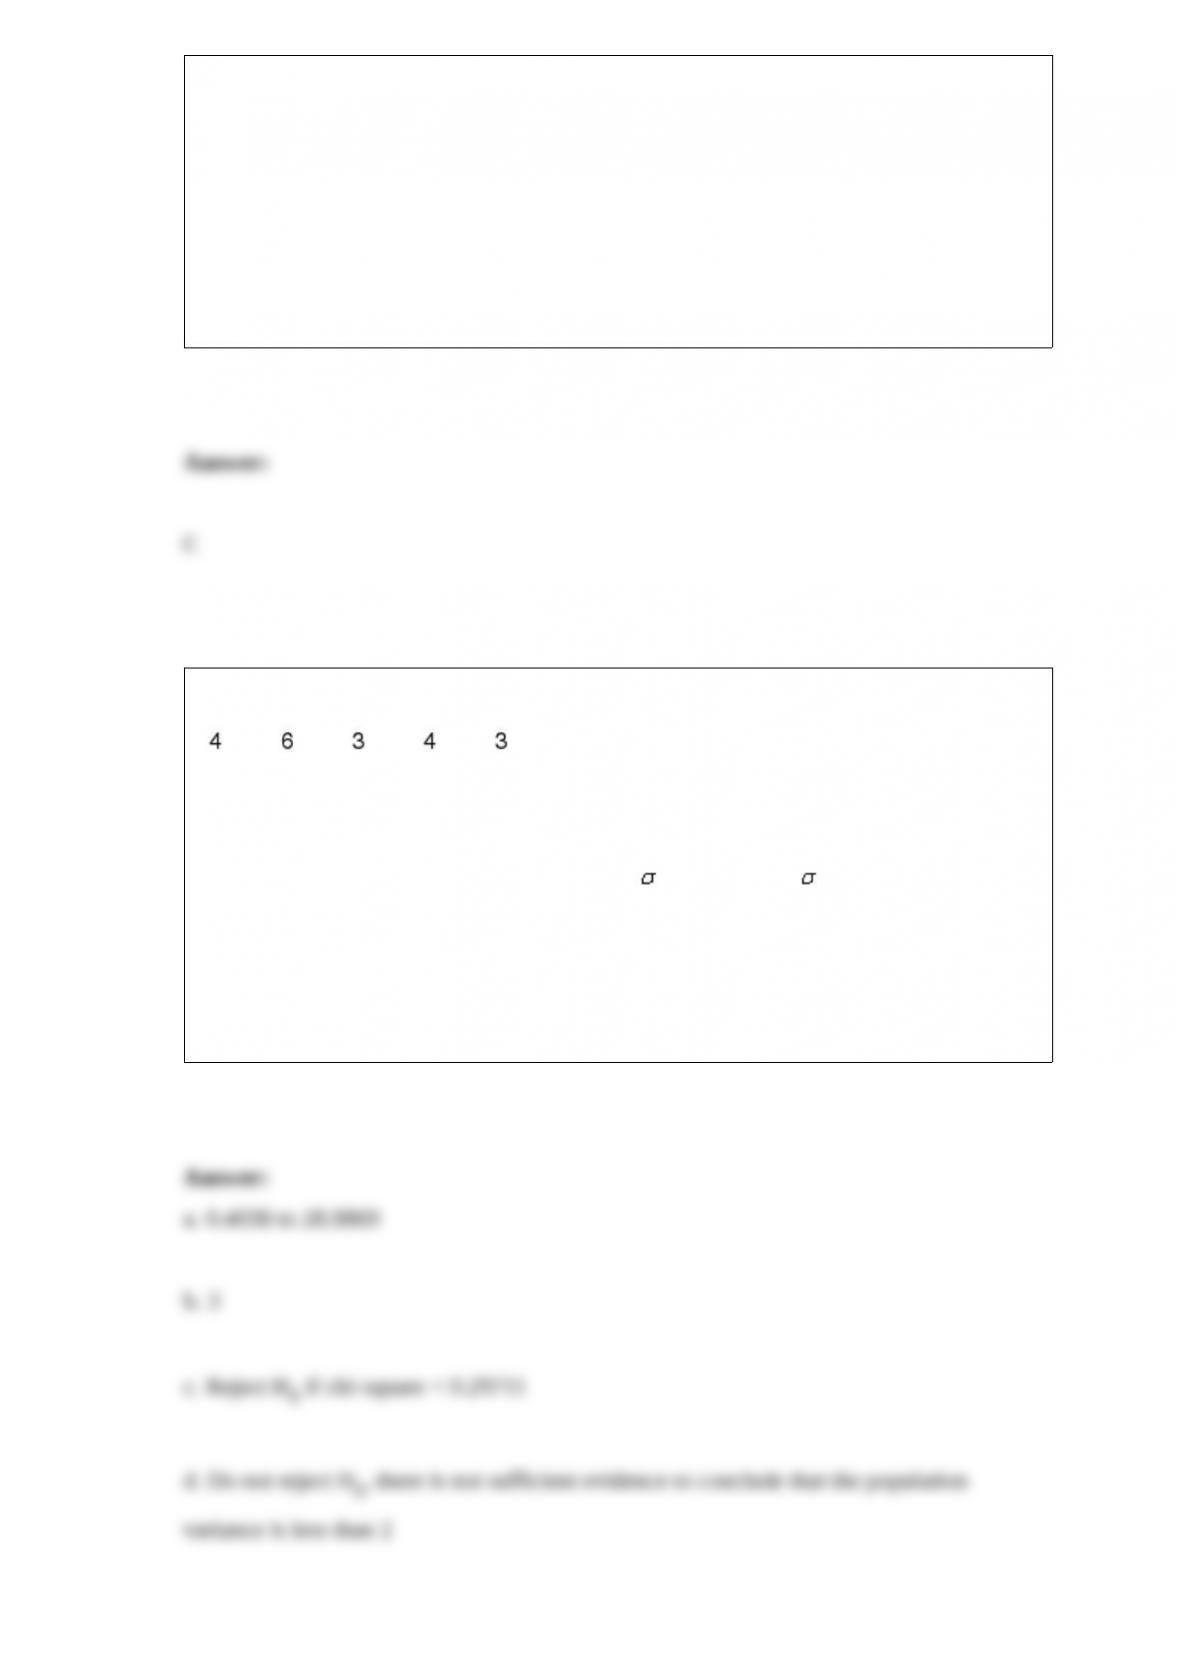
You are given the following results from a sample of 5 observations.
a. Construct a 99% confidence interval for the population variance.
b. The null and alternative hypotheses are H0: 2 2 and Ha: 2 < 2. Compute the test
statistic.
c. Perform the test of the hypothesis at the 1% level.
d. What do you conclude about the population variance?

Exhibit 16-4
In a laboratory experiment, data were gathered on the life span (y in months) of 33 rats,
units of daily protein intake (x1), and whether or not agent x2 (a proposed life extending
agent) was added to the rats diet (x2 = 0 if agent x2 was not added, and x2 = 1 if agent
was added.) From the results of the experiment, the following regression model was
developed.
= 36 + 0.8x1 – 1.7x2
Also provided are SSR = 60 and SST = 180.
Refer to Exhibit 16-4. From the above function, it can be said that the life expectancy of
rats that were given agent x2 is
a. 1.7 months more than those who did not take agent x2
b. 1.7 months less than those who did not take agent x2
c. 0.8 months less than those who did not take agent x2
d. 0.8 months more than those who did not take agent x2
From a population of 200 elements, the standard deviation is known to be 14. A sample
of 49 elements is selected. It is determined that the sample mean is 56. The standard
error of the mean is
a. 3
b. 2
c. greater than 2
d. less than 2
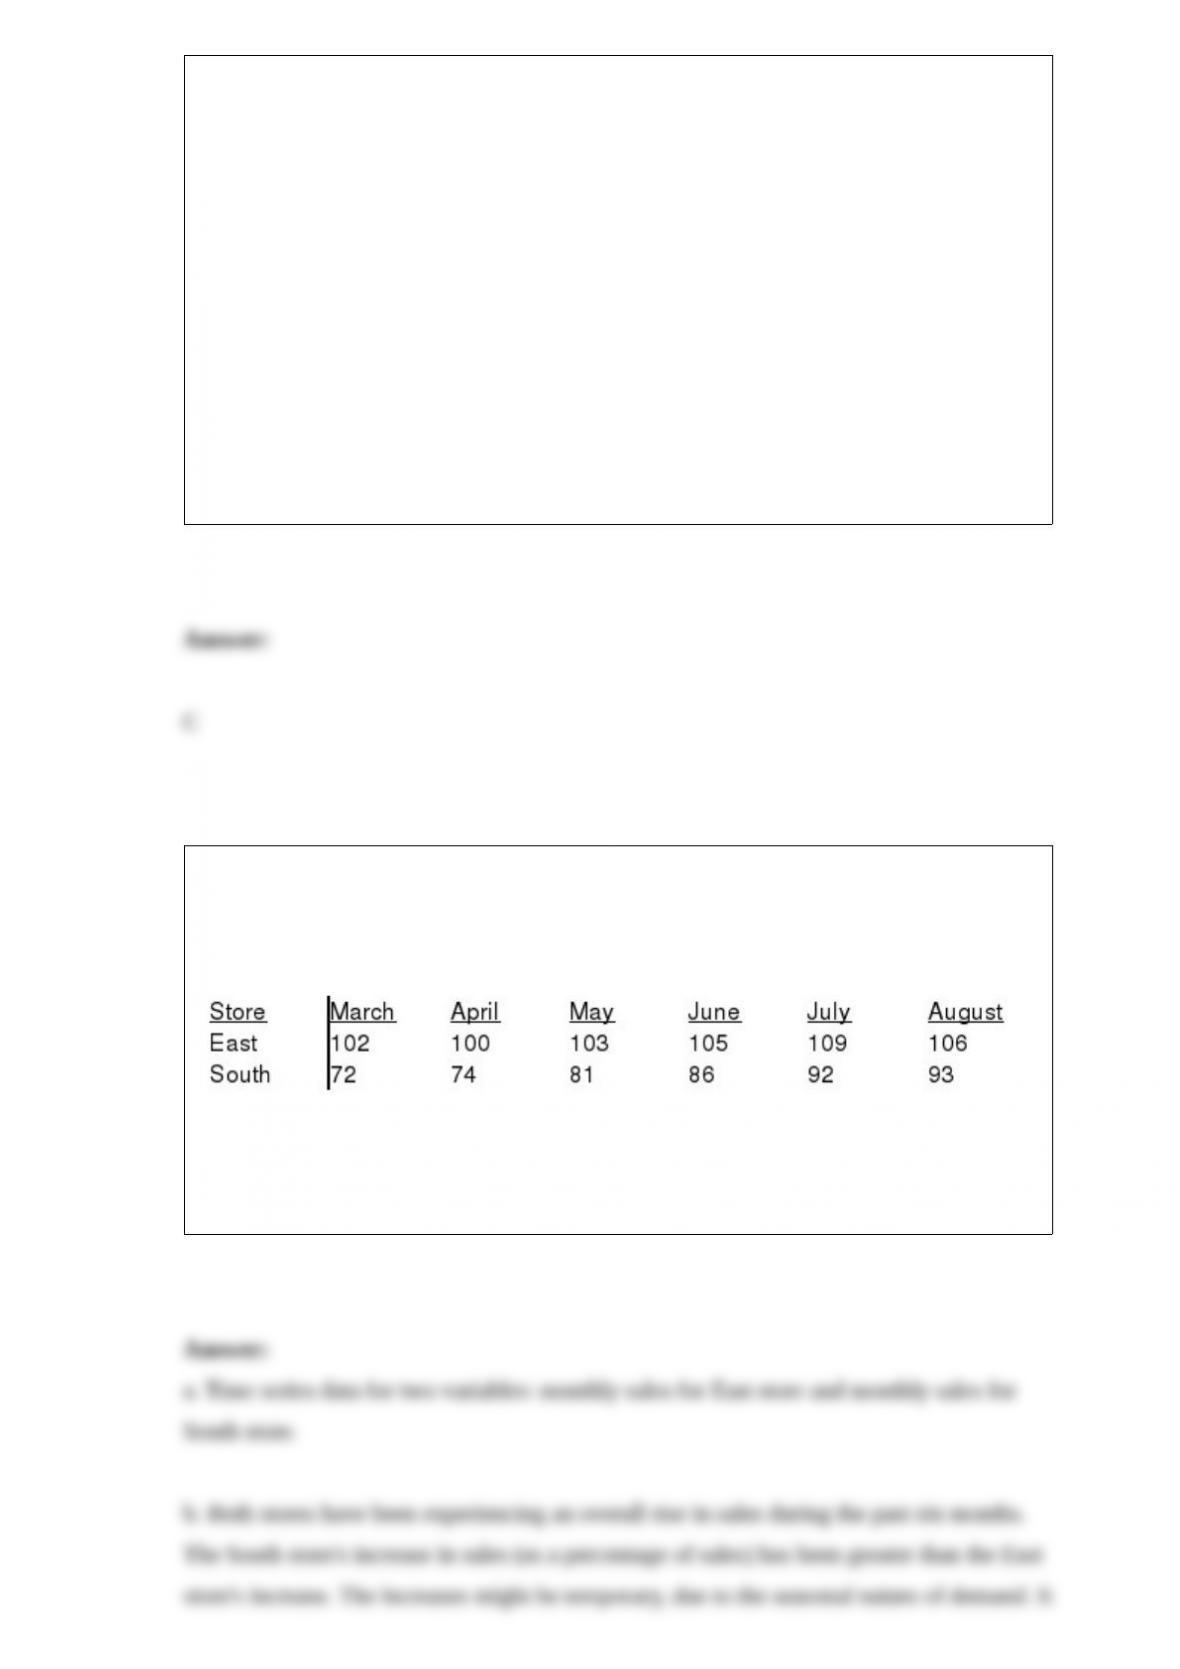
Exhibit 11-3
The contents of a sample of 26 cans of apple juice showed a standard deviation of 0.06
ounces. We are interested in testing to determine whether the variance of the population
is significantly more than 0.003.
Refer to Exhibit 11-3. The test statistic is
a. 1.2
b. 31.2
c. 30
d. 500
Molly Porter owns and operates two convenience stores, one on the East side of the city
and the other on the South side. She has workforce-planning decisions to make and has
collected some recent sales data that are relevant to her decisions. Listed below are the
monthly sales ($000) at her two stores for the past six months.
a. Is the data set cross-sectional or time series data? Explain.
b. Comment on any apparent patterns you see in the data.
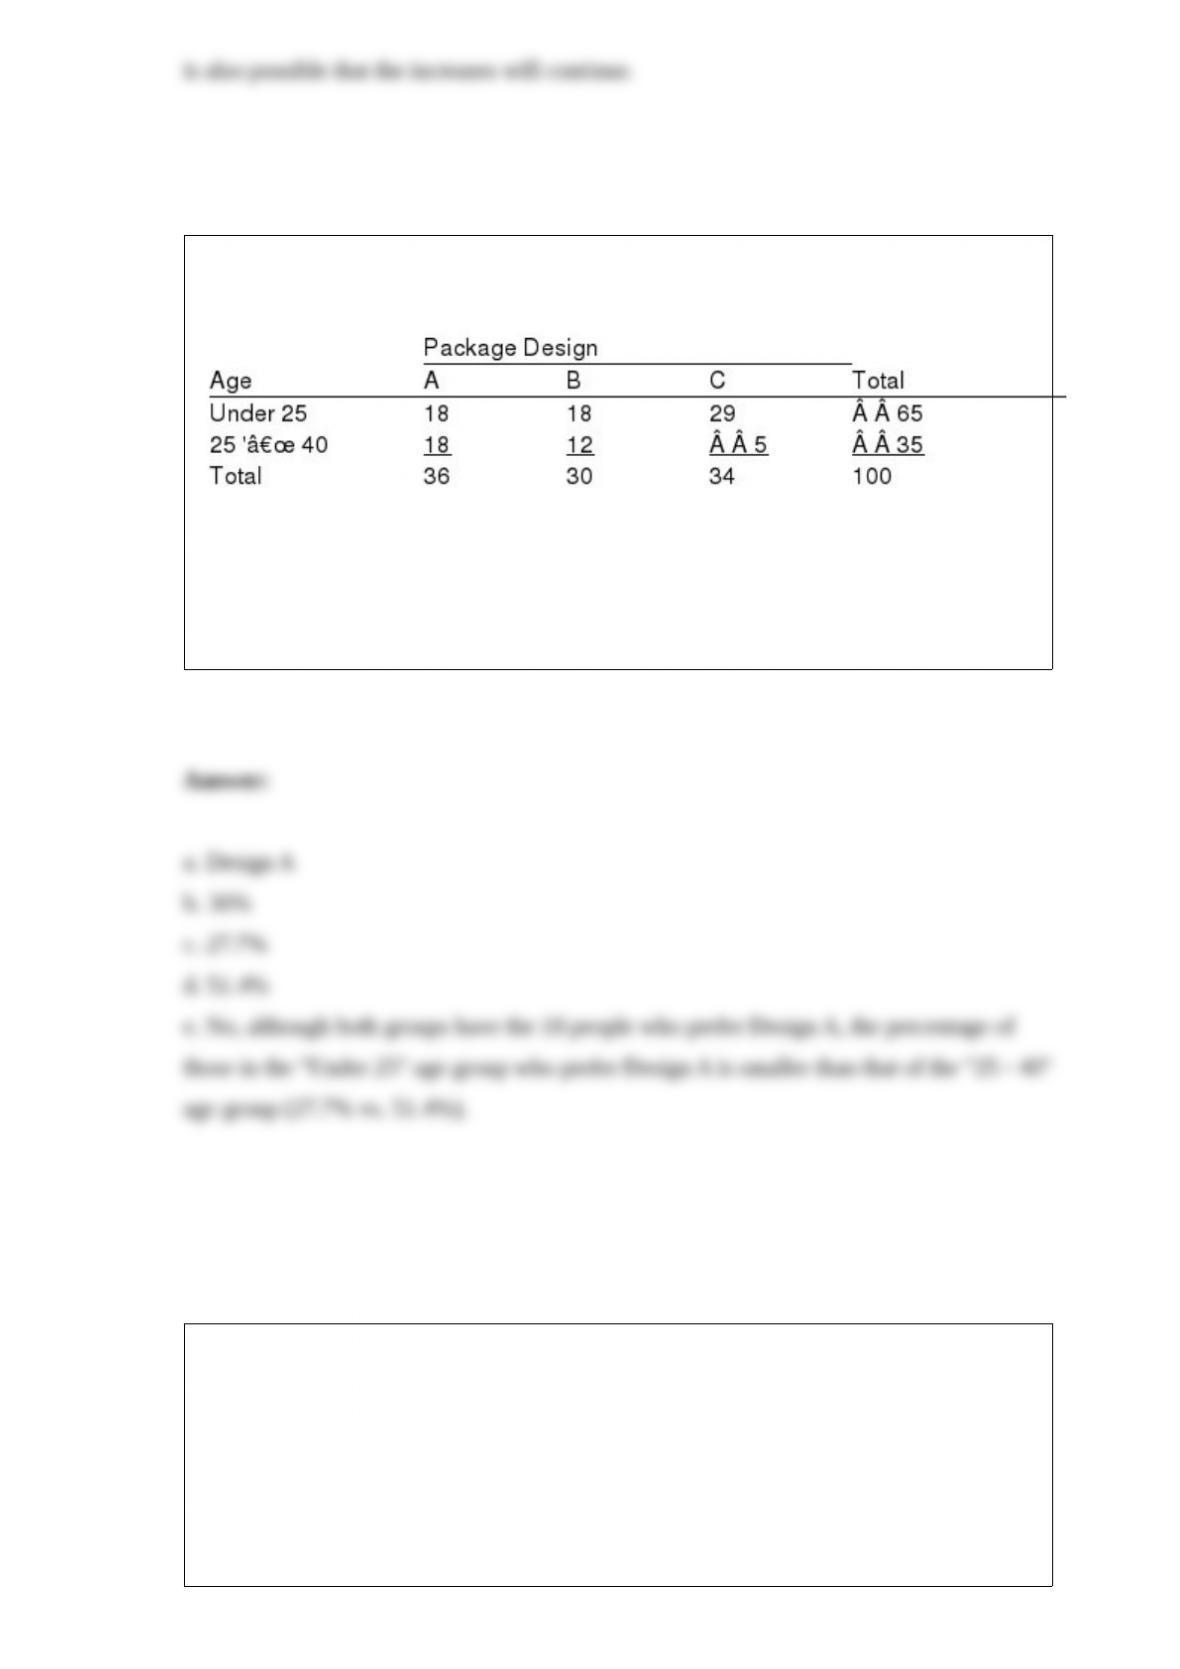
A market research firm has conducted a study to determine consumer preference for a
new package design for a particular product. The consumers, ages were also noted.
a. Which package design was most preferred overall?
b. What percent of those participating in the study preferred package A?
c. What percent of those less than 25 years of age preferred package A?
d. What percent of those aged 25 40 preferred package A?
e. Is the preference for package A the same for both age groups?
A graphic presentation of the expected gain from the various options open to the
decision maker is called
a. a payoff table
b. a decision tree
c. the expected opportunity loss

d. the expected value of perfect information
If a coin is tossed three times, the likelihood of obtaining three heads in a row is
a. zero
b. 0.500
c. 0.875
d. 0.125
Exhibit 18-3
A company advertises that food preparation time can be significantly reduced with the
Handy Dandy Slicer. A sample of 12 individuals prepared the ingredients for a meal
with and without the slicer. You are given the preparation times below.
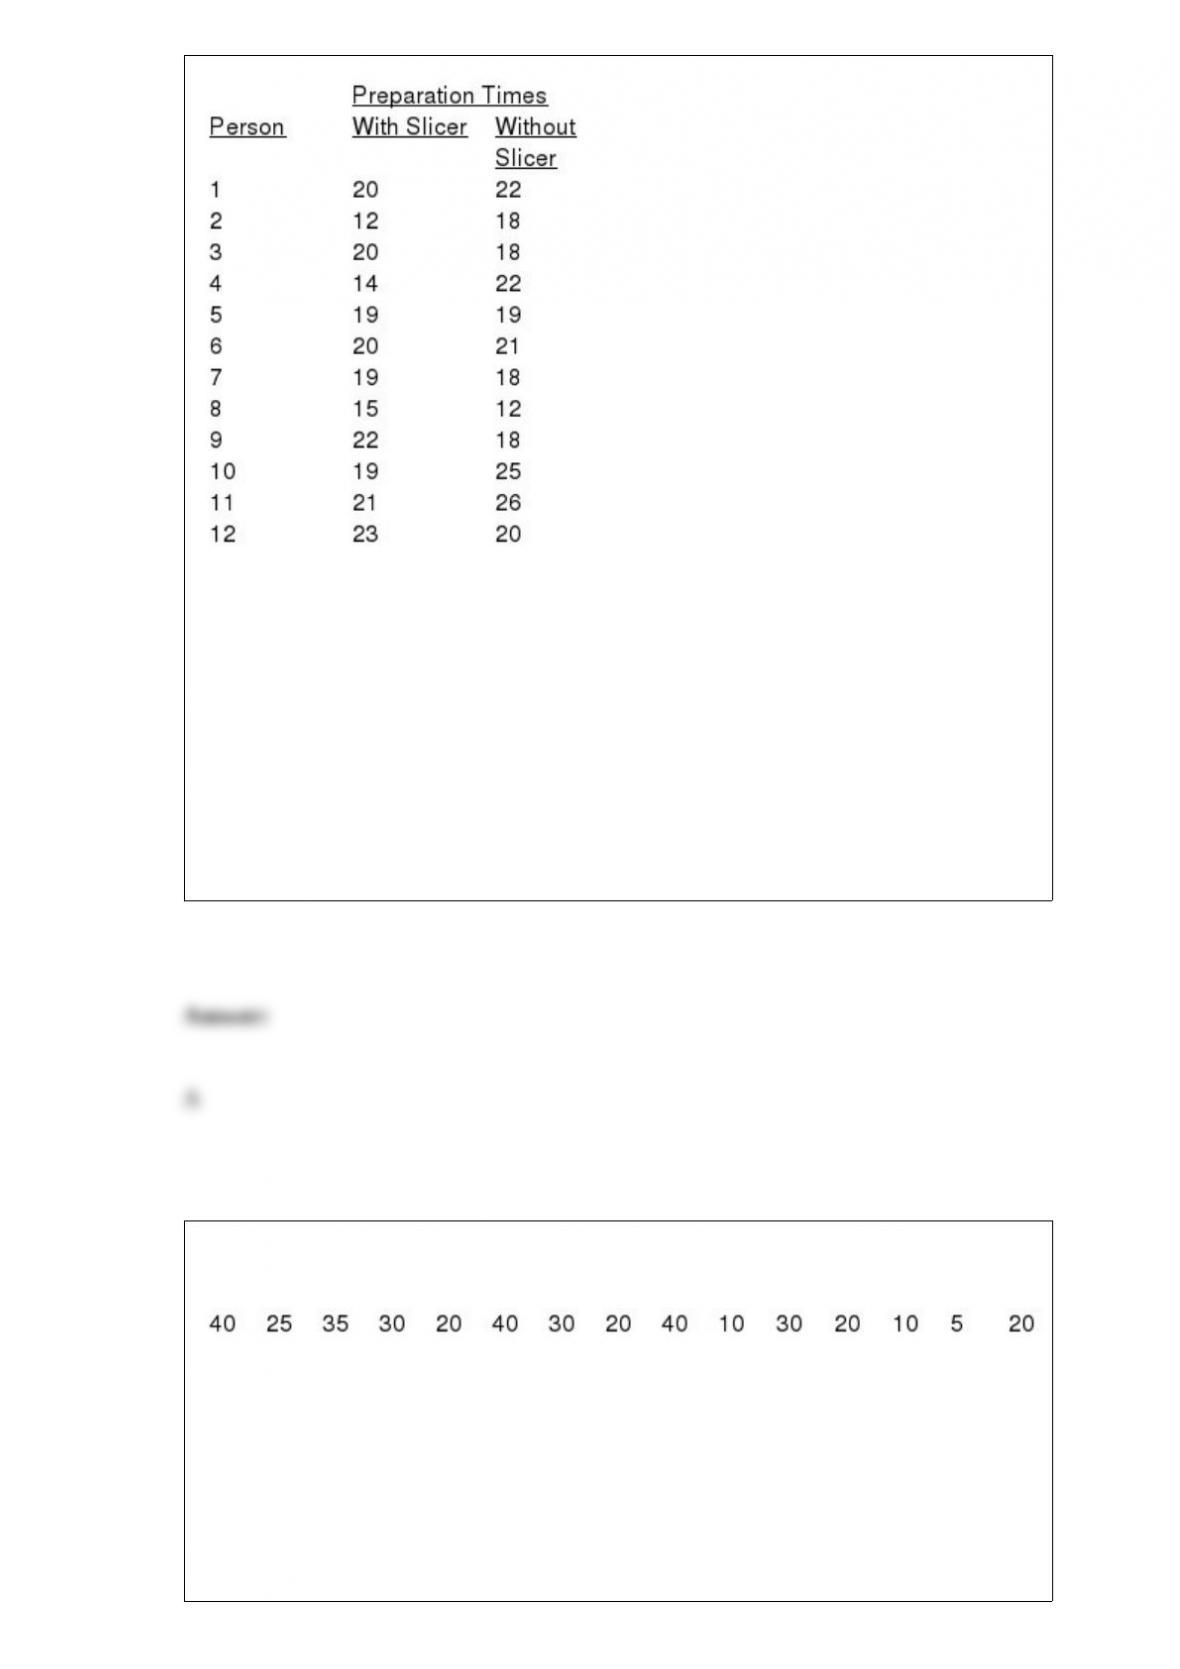
Refer to Exhibit 18-3. The hypothesis is to be tested at the 5% level of significance. The
decision rule is not to reject the null hypothesis if
a. -1.96 < z < 1.96
b. -1.645 < z < 1.645
c. z > 1.96 or z < -1.96
d. the number of “+” signs is greater than or equal to 2 but less than or equal to 8
A researcher has obtained the number of hours worked per week during the summer for
a sample of fifteen students.
Using this data set, compute the
a. median
b. mean
c. mode
d. 40th percentile
e. range
f. sample variance
g. standard deviation
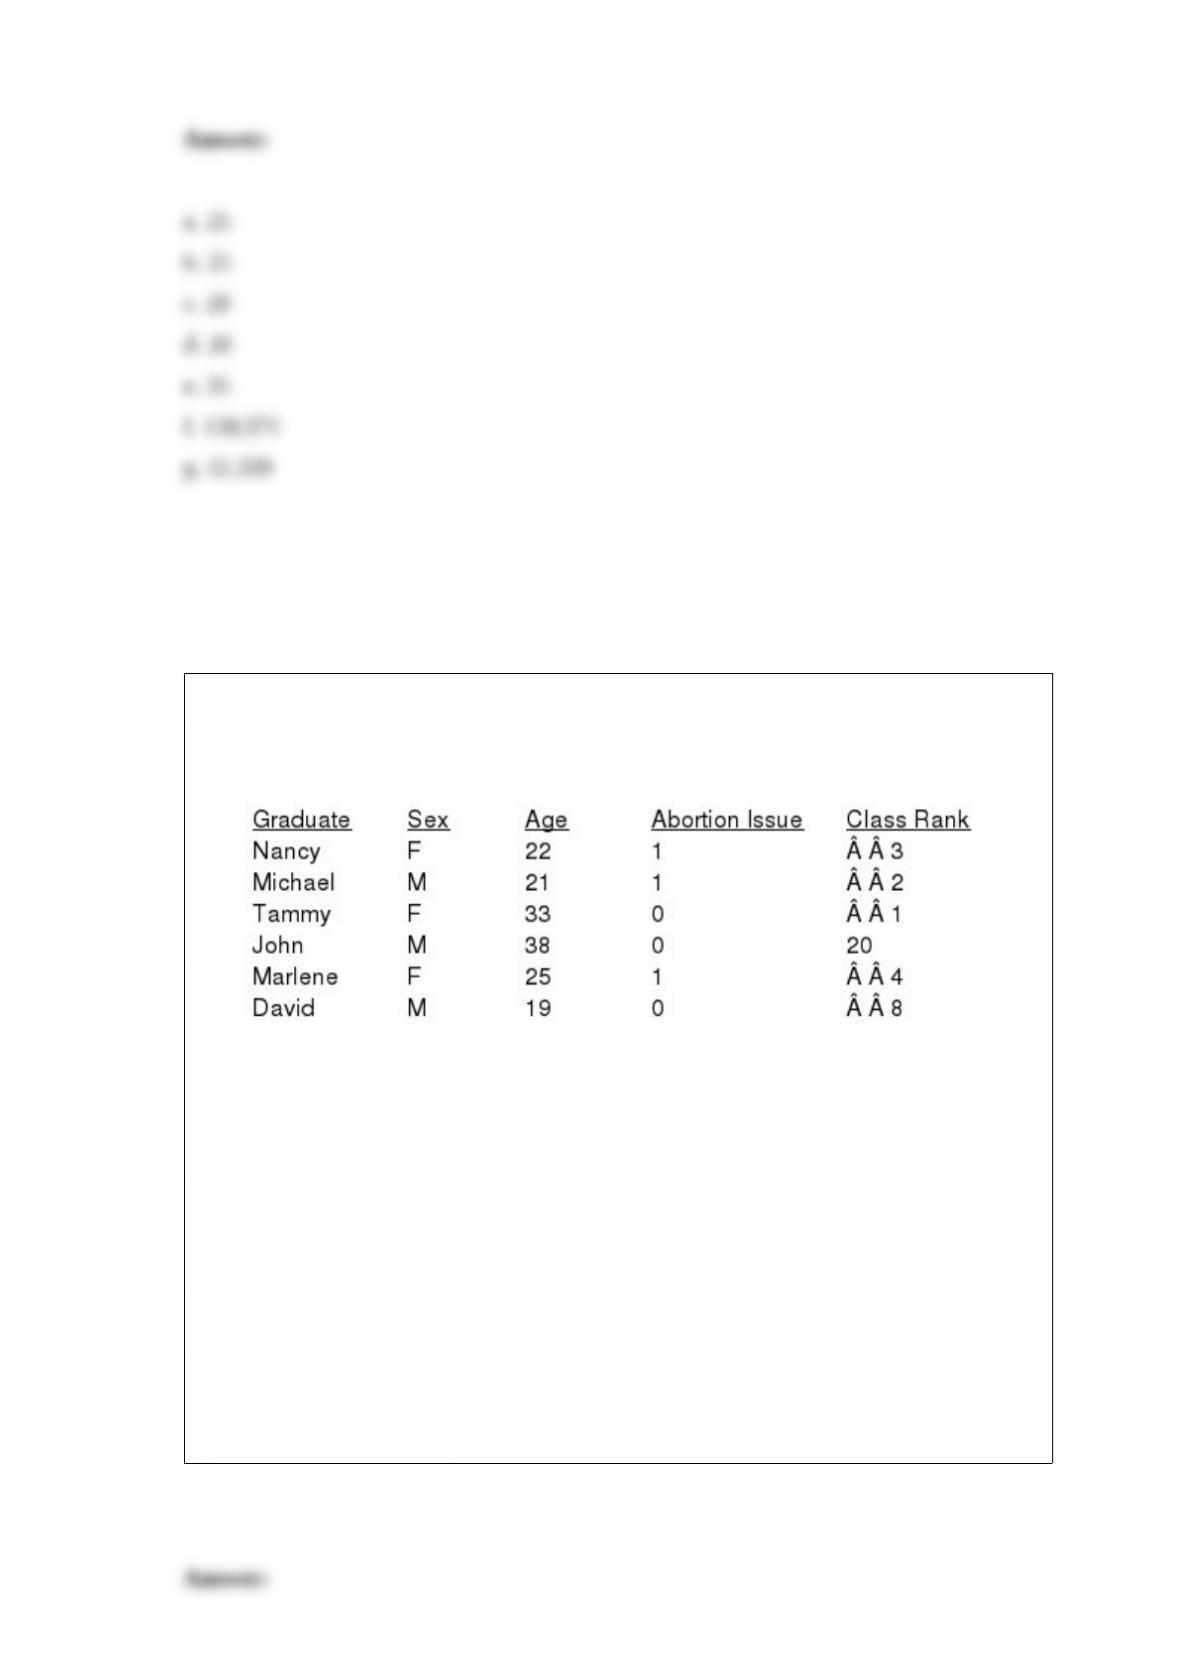
After the graduation ceremonies at a university, six graduates were asked whether they
were in favor of (identified by 1) or against (identified by 0) abortion. Some
information about these graduates is shown below.
a. How many elements are in the data set?
b. How many variables are in the data set?
c. How many observations are in the data set?
d. Name the scale of measurement for each of the above (Sex, Age, Abortion Issue,
Class rank).
e. Which of the above (Sex, Age, Abortion Issue, Class rank) are categorical and which
are quantitative variables?
f. Are arithmetic operations appropriate for the variable “abortion issue”?
The mean, median, and mode have the same value for which of the following
probability distributions?
a. uniform
b. normal
c. exponential
d. Poisson

To estimate a population mean, the sample size needed to provide a margin of error of 2
or less with a .95 probability when the population standard deviation equals 11 is
a. 10
b. 11
c. 116
d. 117
In the linear trend equation, T = b0 + b1t, b0 represents the
a. time
b. slope of the trend line
c. trend value in period 1
d. the Y intercept
Six hundred residents of a city are polled to obtain information on voting intentions in
an upcoming city election. The six hundred residents in this study is an example of a(n)
a. census

b. sample
c. observation
d. population
We are interested in determining the relationship between daily supply (y) and the unit
price (x) for a particular item. A sample of ten days supply and associated price resulted
in the following data.
a. Develop the least square estimated regression equation.
b. Compute the coefficient of determination and fully explain its meaning.
c. At 0.05, perform a t-test and determine if the slope is significantly different from
zero.
The average lifetime of a light bulb is 3,000 hours with a standard deviation of 696
hours. A simple random sample of 36 bulbs is taken.
a. What are the expected value, standard deviation, and shape of the sampling

distribution of ?
b. What is the random variable in this problem? Define it in words.
c. What is the probability that the average life in the sample will be between 2,670.56
and 2,809.76 hours?
d. What is the probability that the average life in the sample will be greater than
3,219.24 hours?
e. What is the probability that the average life in the sample will be less than 3,180.96
hours?
The standard deviation of a binomial distribution is
a. E(x) np(1 n)
b. E(x) np(1 p)
c. E(x) np
d. None of the alternative answers is correct.
The mean of the t distribution is
a. 0
b. .5
c. 1
d. problem specific
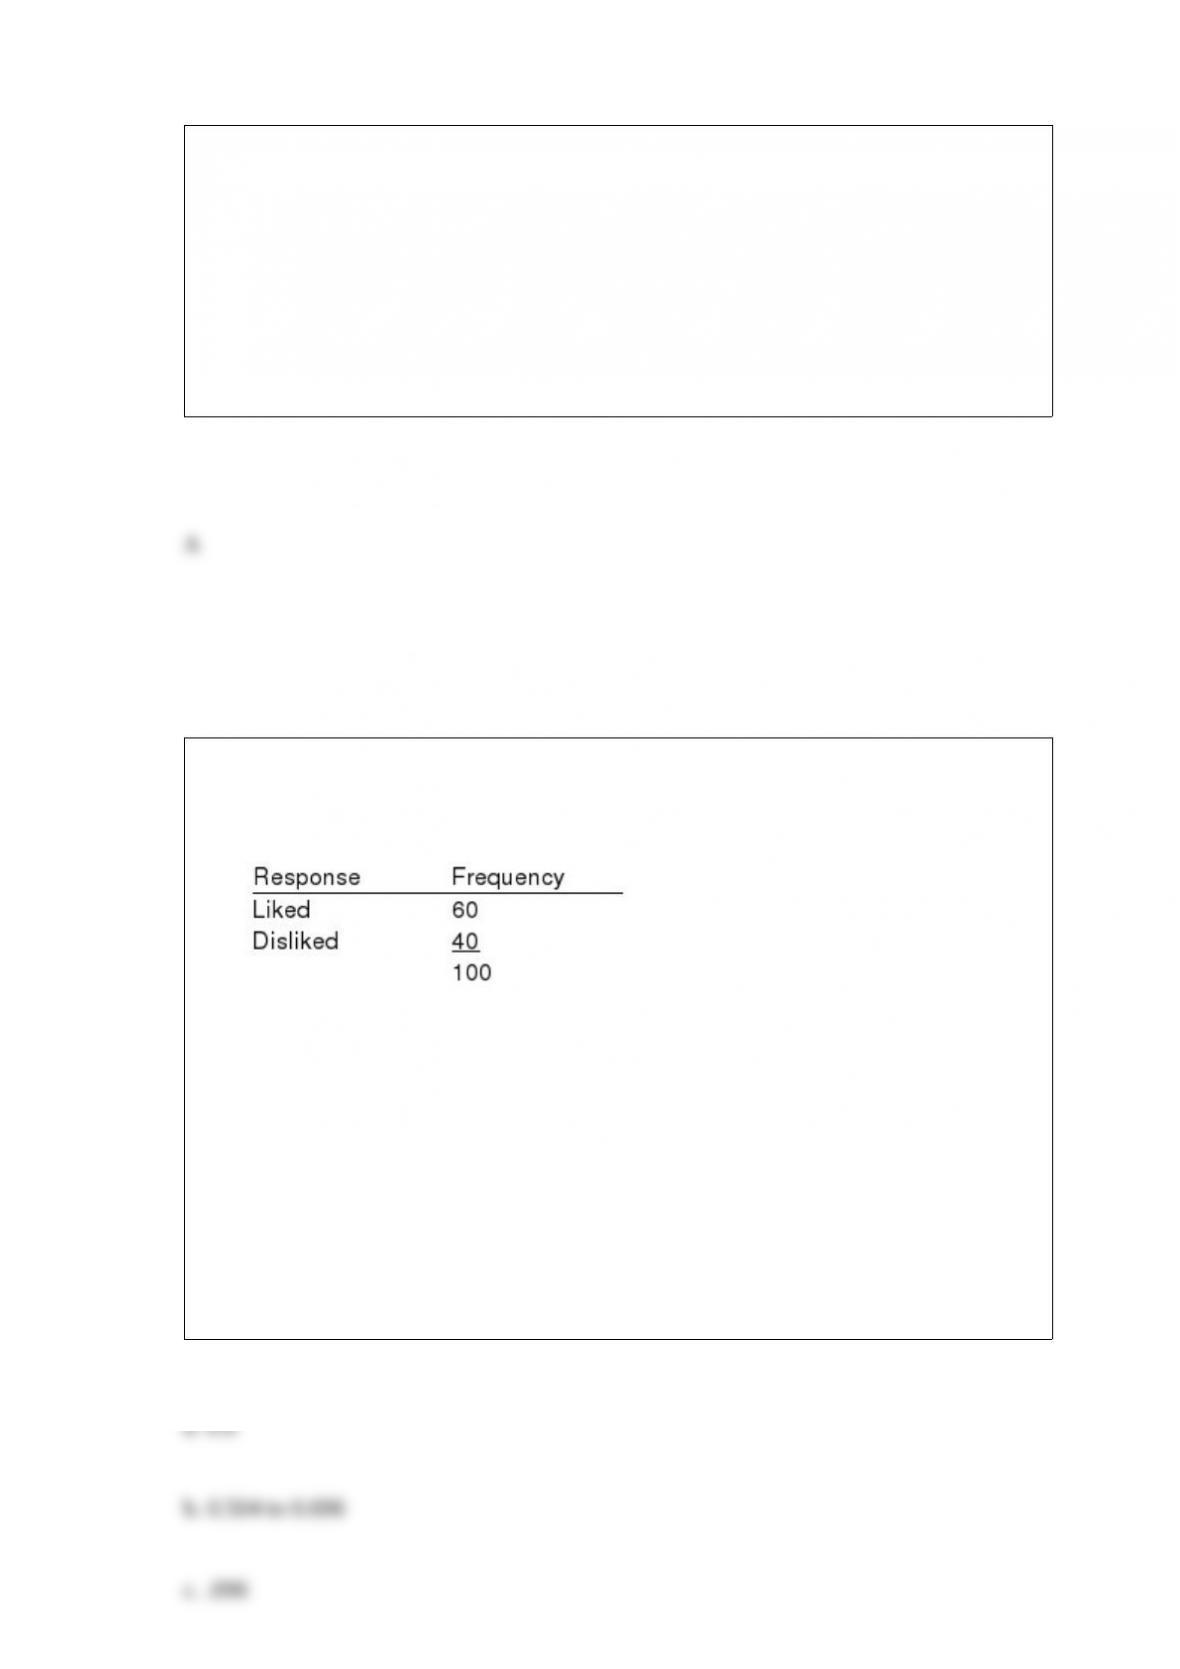
A new brand of breakfast cereal is being market tested. One hundred boxes of the cereal
were given to consumers to try. The consumers were asked whether they liked or
disliked the cereal. You are given their responses below.
a. What is the point estimate of the proportion of people who will like the cereal?
b. Construct a 95% confidence interval for the proportion of all consumers who will
like the cereal.
c. What is the margin of error for the 95% confidence interval that you constructed in
part b?
d. With a .95 probability, how large of a sample needs to be taken to provide a margin
of error of .09 or less?
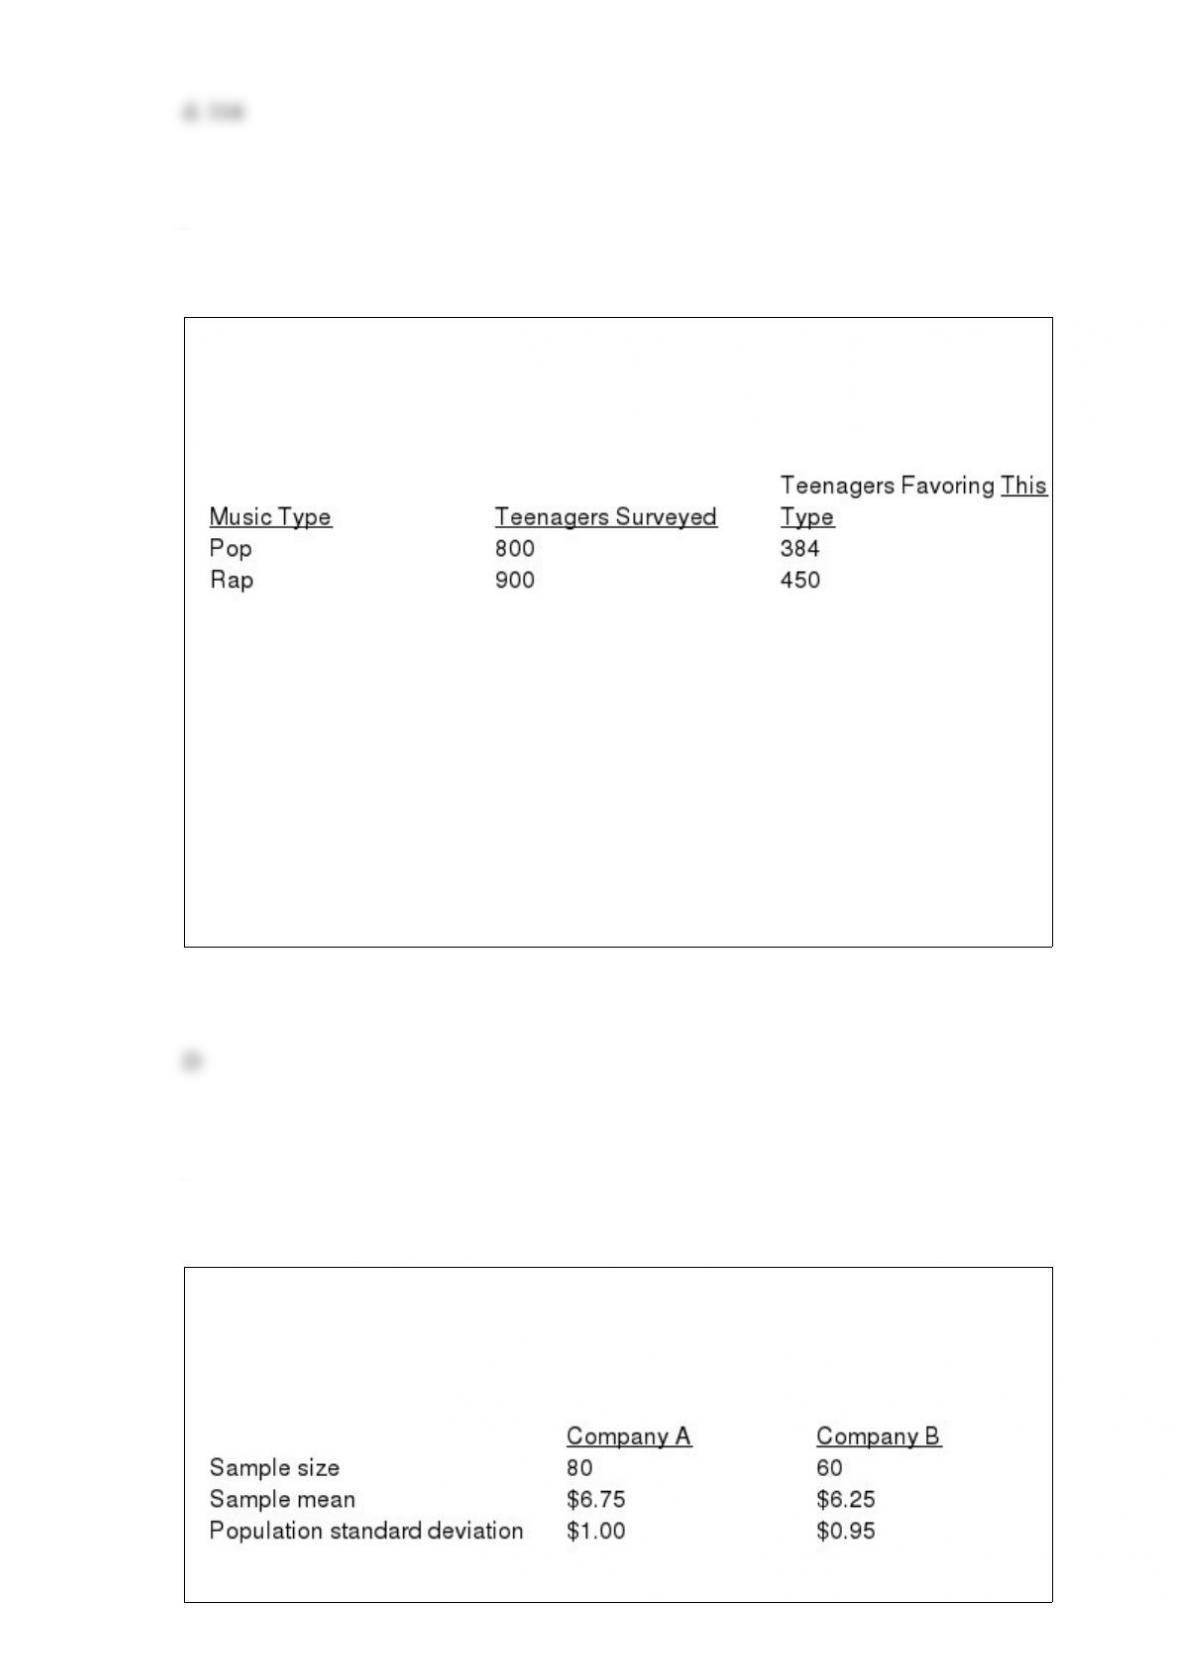
Exhibit 10-12
The results of a recent poll on the preference of teenagers regarding the types of music
they listen to are shown below.
Refer to Exhibit 10-12. The 95% confidence interval for the difference between the two
proportions is
a. 384 to 450
b. 0.48 to 0.5
c. 0.028 to 0.068
d. -0.068 to 0.028
Exhibit 10-8
In order to determine whether or not there is a significant difference between the hourly
wages of two companies, the following data have been accumulated.

Refer to Exhibit 10-8. The null hypothesis
a. should be rejected
b. should not be rejected
c. should be revised
d. None of these alternatives is correct.