
In simple linear regression analysis, which of the following is not true?
a. The F test and the t test yield the same results.
b. The F test and the t test may or may not yield the same results.
c. The relationship between x and y is represented by means of a straight line.
d. The value of F t2.
As a general guideline, the research hypothesis should be stated as the
a. null hypothesis
b. alternative hypothesis
c. tentative assumption
d. hypothesis the researcher wants to disprove
A carpet company advertises that it will deliver your carpet within 15 days of purchase.
A sample of 49 past customers is taken. The average delivery time in the sample was
16.2 days. The population standard deviation is 5.6 days.
a. State the null and alternative hypotheses.
b. Using a critical value, test the null hypothesis at the 5% level of significance.
c. Using a p-value, test the hypothesis at the 5% level of significance.
d. Compute the probability of a Type II error if the true average delivery time is 17 days
after purchase.
An insurance company has determined that each week an average of nine claims is filed
in their Atlanta branch. What is the probability that during the next week
a. exactly seven claims will be filed?
b. no claims will be filed?
c. less than four claims will be filed?
d. at least eighteen claims will be filed?
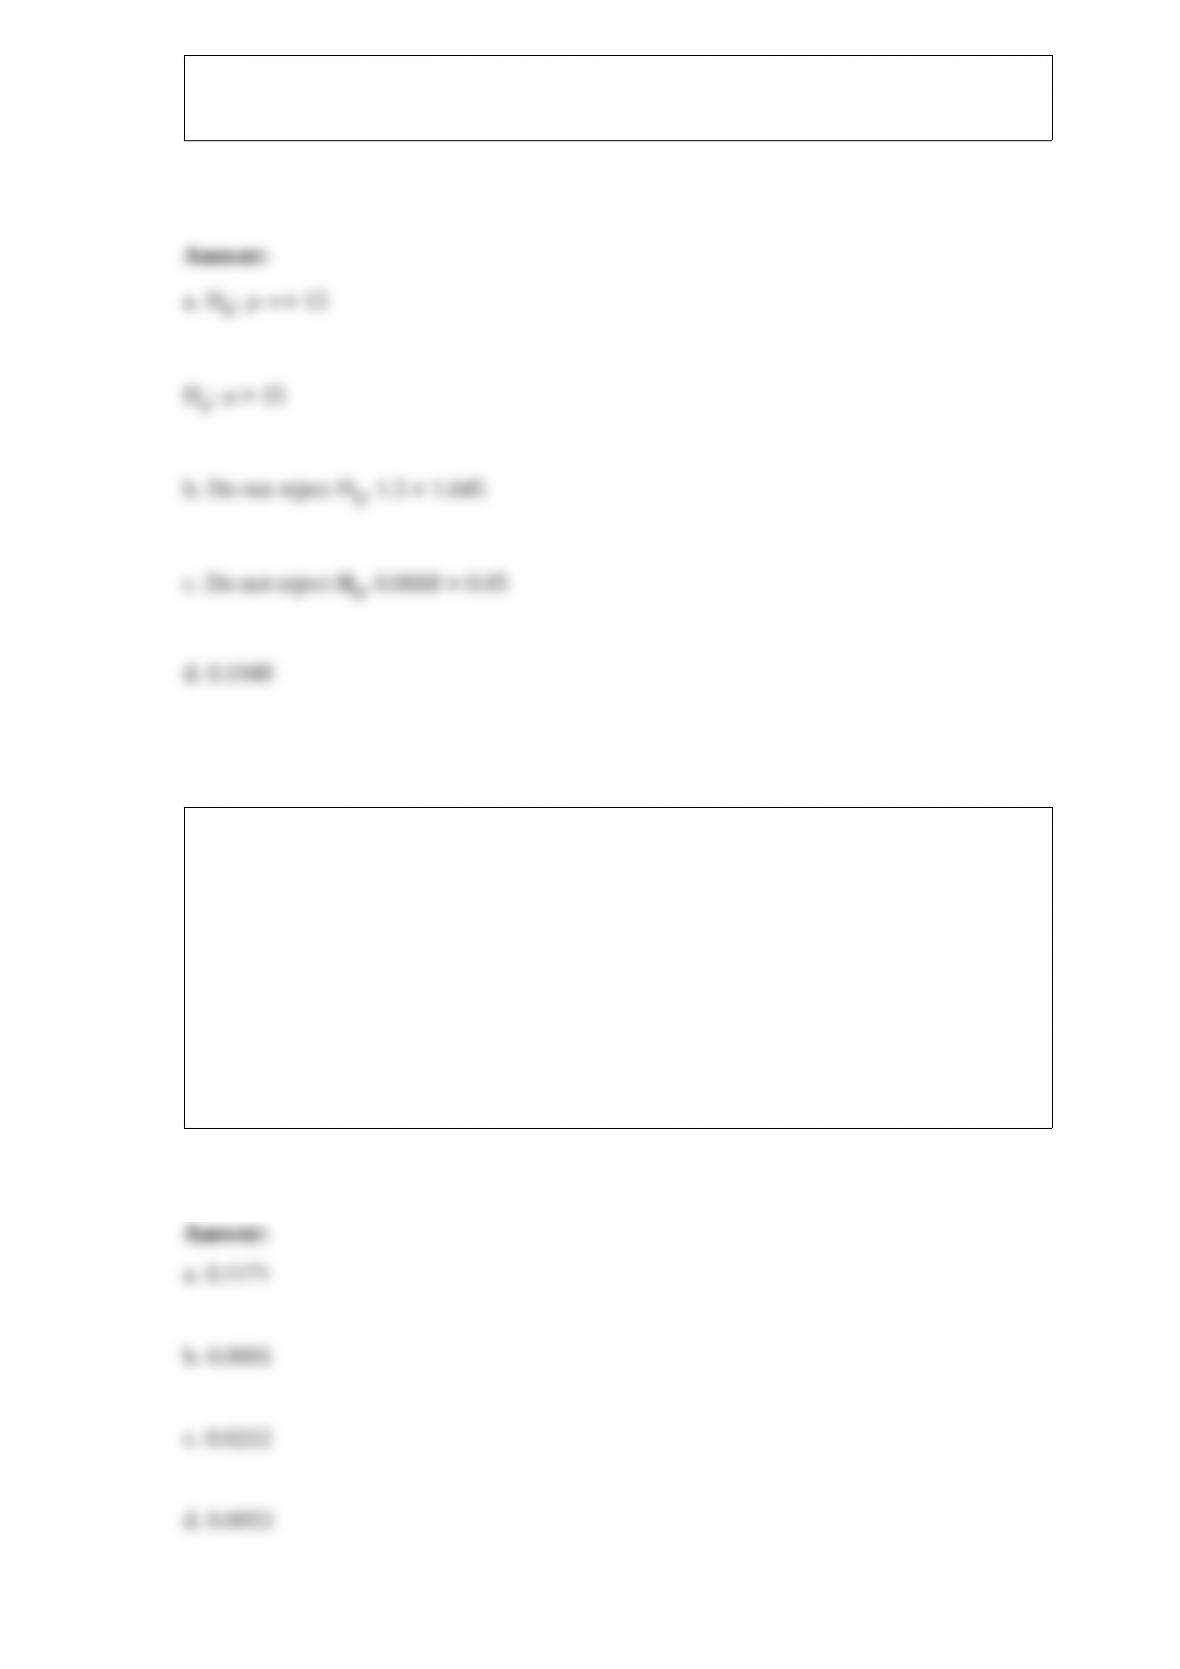
Super Cola is considering the introduction of a root beer drink. The company feels that
the probability of the new drink being successful is .6. The payoff table is as follows.
Super Cola has a choice of two research firms to obtain information for this new
product. Stanton Marketing has market indicators I1 and I2 for which P(I1|S1) = .7 and
P(I1|S2) = .4. New World Marketing has indicators J1 and J2 for which P(J1|S1) = .6 and
P(J1|S2) = .3. (Be sure to compute probabilities to the third decimal place.)
a. What is the optimal decision if neither research firm is used?
b. Compute the expected value of perfect information (EVPI).
c. Find the EVSIs for Stanton and New World.
d. If both research firms charge $5,000, which firm should be hired?
e. If Stanton charges $10,000 and New World charges $5,000, which firm should Super
Cola hire?
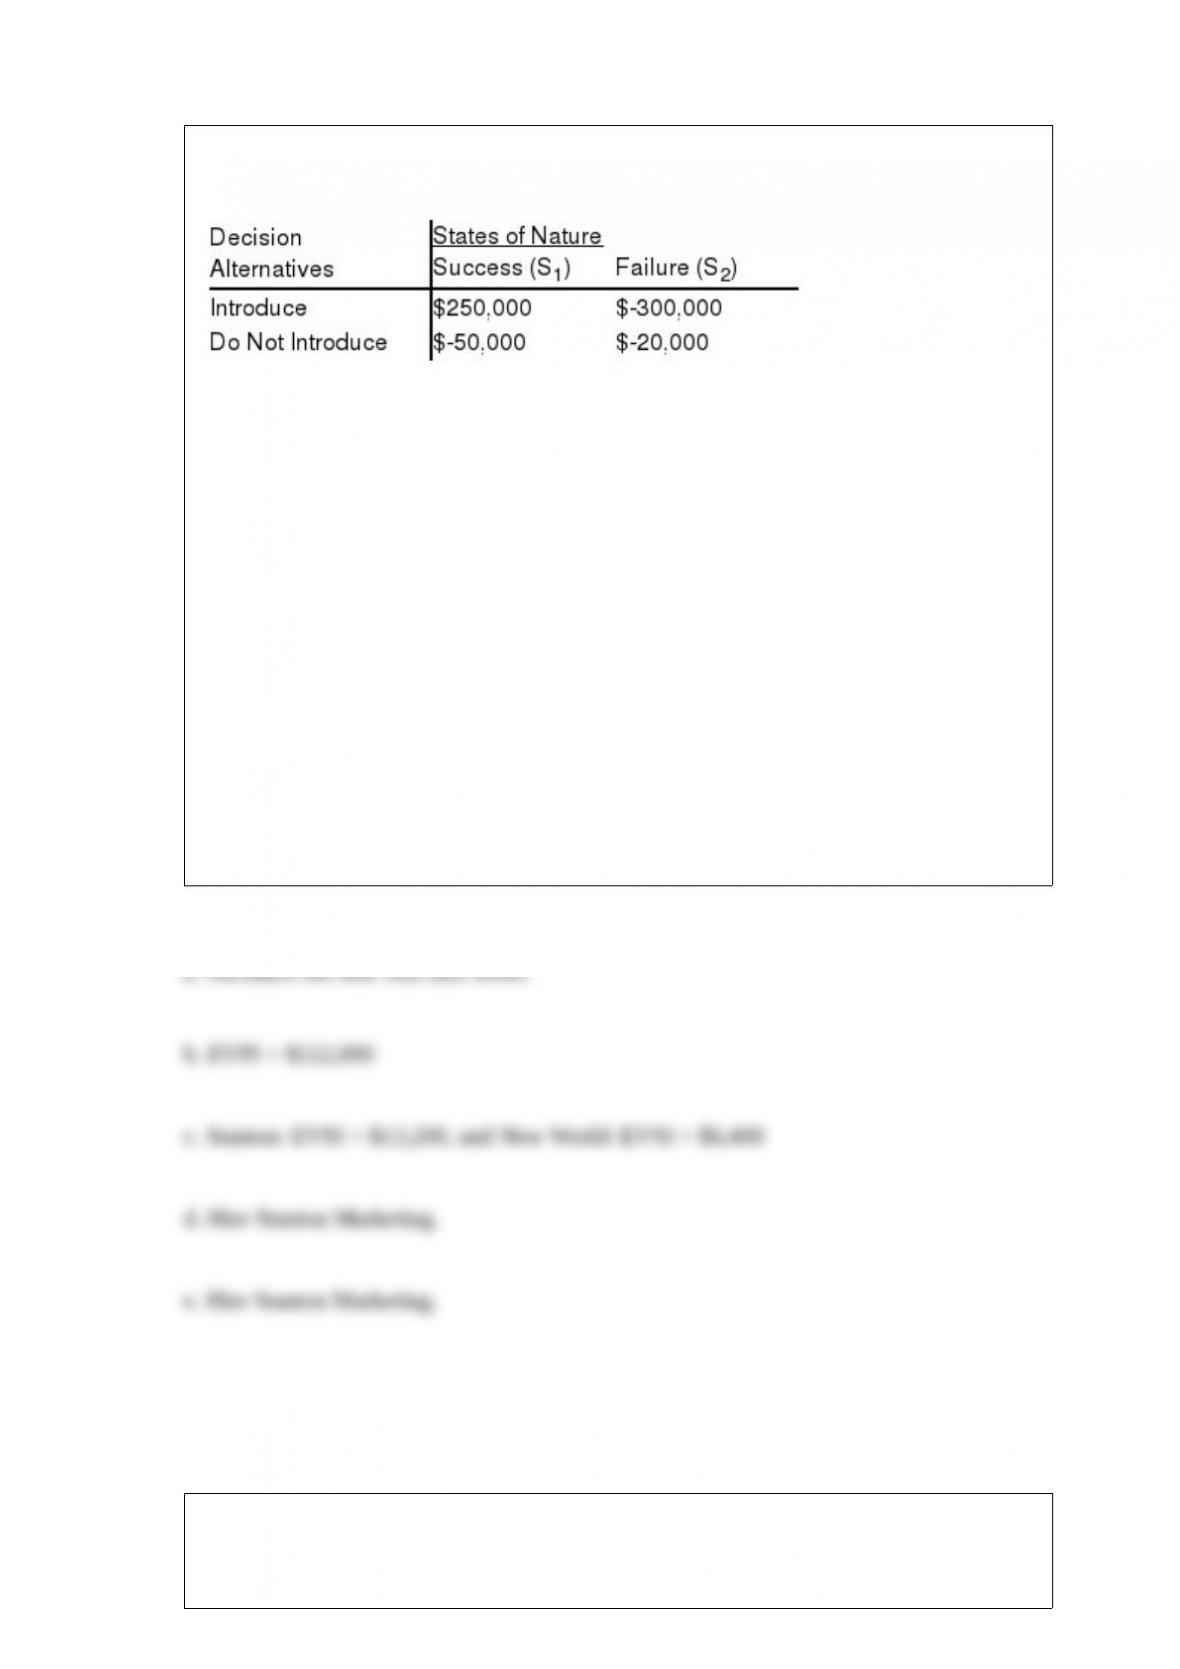
Exhibit 2-3
The number of sick days taken (per month) by 200 factory workers is summarized
below.
Refer to Exhibit 2-3. The number of workers who took at most 10 sick days per month
a. was 15
b. was 200
c. was 185
d. was 65
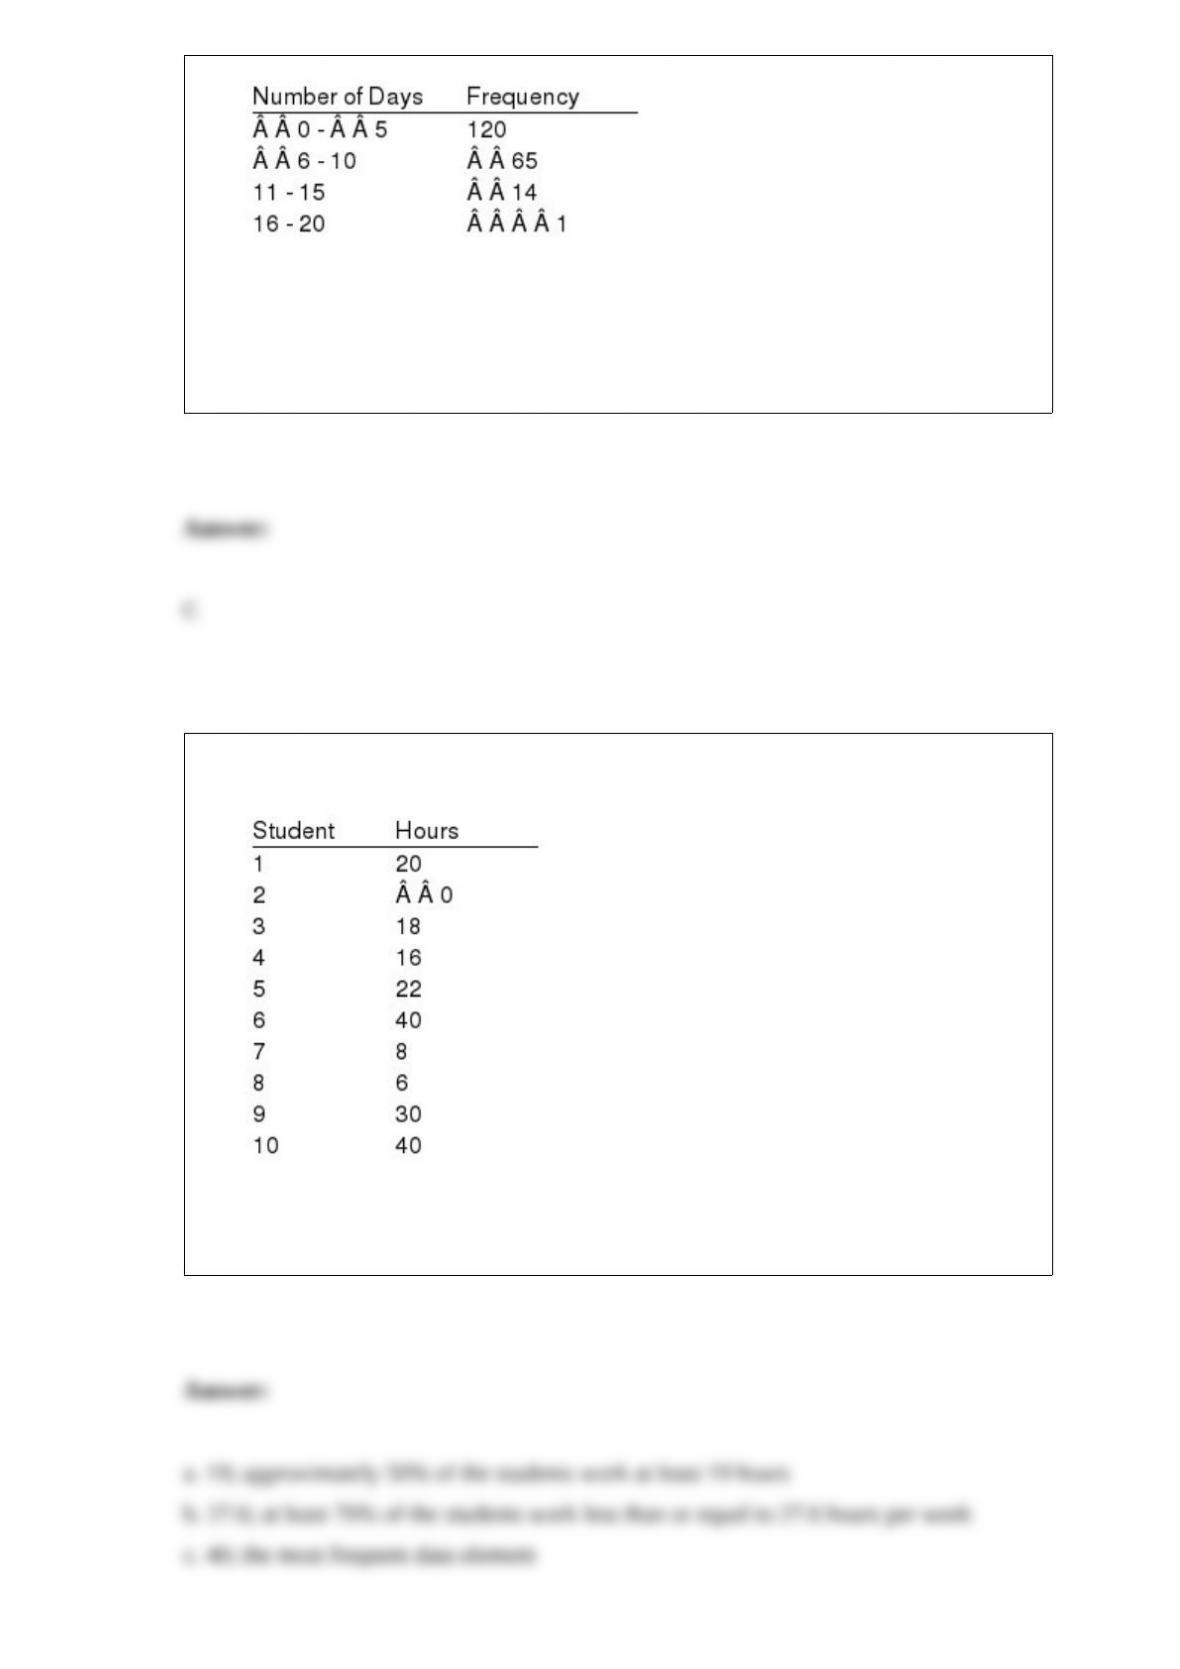
The number of hours worked per week for a sample of ten students is shown below.
a. Determine the median and explain its meaning.
b. Compute the 70th percentile and explain its meaning.
c. What is the mode of the above data? What does it signify?

The ages of students at a university are normally distributed with a mean of 21. What
percentage of the student body is at least 21 years old?
a. It could be any value, depending on the magnitude of the standard deviation
b. 50%
c. 21%
d. 1.96%
Random samples of size 100 are taken from a process (an infinite population) whose
population proportion is 0.2. The mean and standard deviation of the distribution of
sample proportions are
a. 0.2 and .04
b. 0.2 and 0.2
c. 20 and .04
d. None of the alternative answers is correct.
Exhibit 10-8
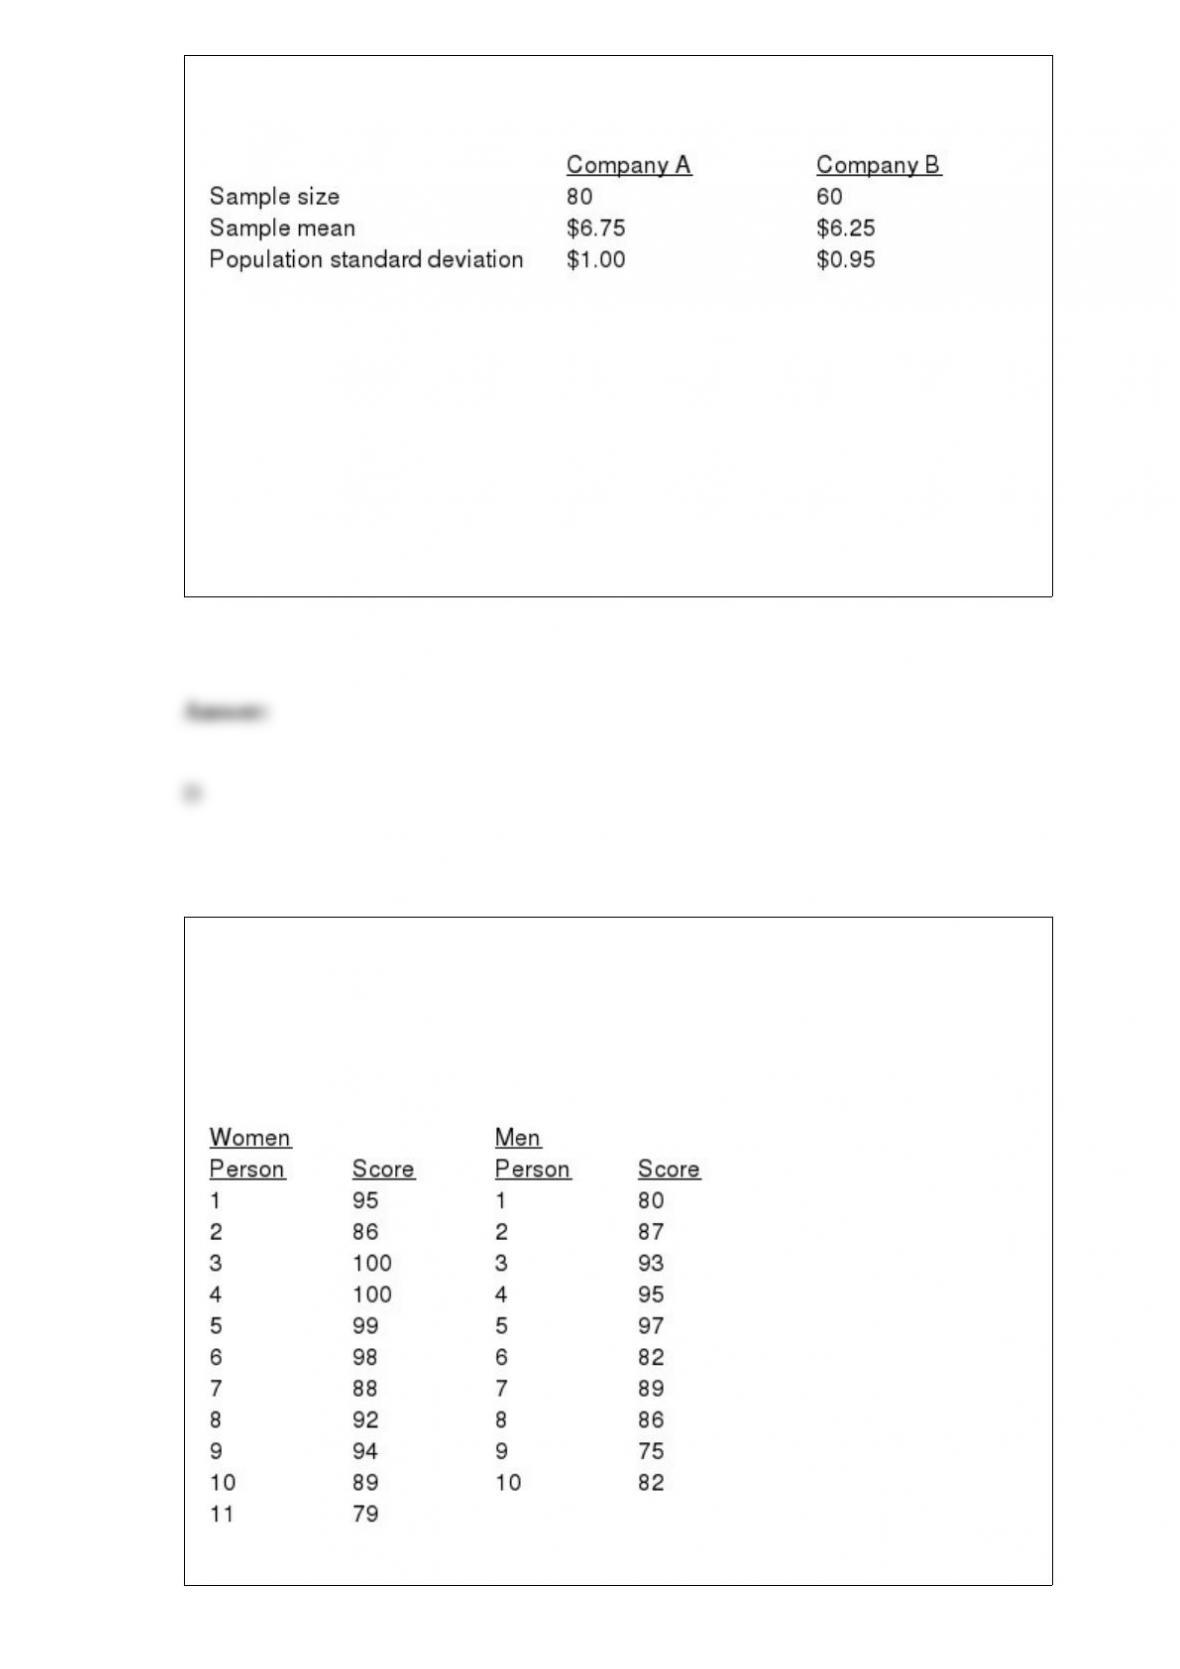
In order to determine whether or not there is a significant difference between the hourly
wages of two companies, the following data have been accumulated.
Refer to Exhibit 10-8. The test statistic is
a. 0.098
b. 1.645
c. 2.75
d. 3.01
Exhibit 18-4
It has been hypothesized that there is no difference in the mathematical accuracy of men
and women. A sample of men and women were given math tests. The scores on the tests
are given below.
Refer to Exhibit 18-4. To test the null hypothesis, the appropriate probability
distribution to use is
a. normal
b. chi-square
c. t distribution
d. binomial
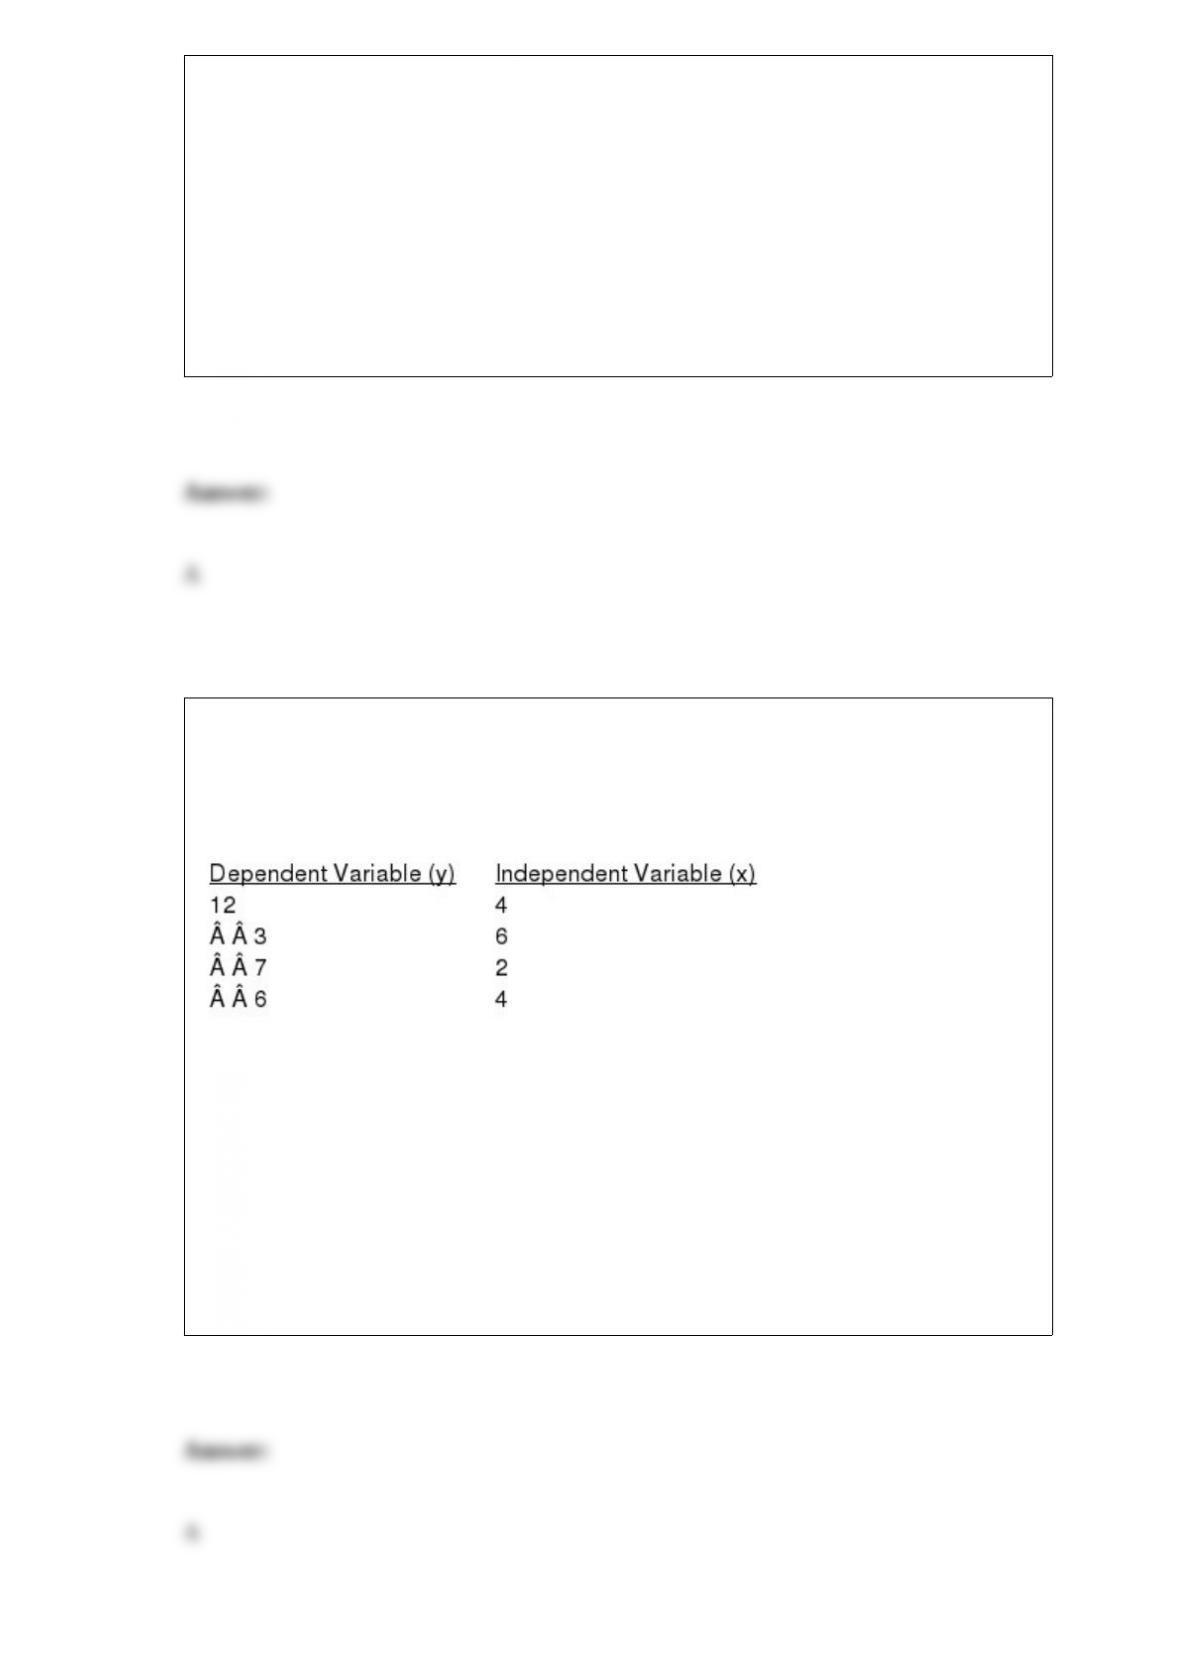
Exhibit 14-6
You are given the following information about y and x.
Refer to Exhibit 14-6. The sample correlation coefficient equals
a. -0.4364
b. 0.4364
c. -0.1905
d. 0.1905

For a standard normal distribution, the probability of obtaining a z value of less than 1.6
is
a. 0.1600
b. 0.0160
c. 0.0016
d. 0.9452
42. The test statistic for goodness of fit has a chi-square distribution with k ‘“ 1 degrees
of freedom provided that the expected frequencies for all categories are
a. 5 or more
b. 10 or more
c. k or more
d. 2k
The chi-square value for a one-tailed (upper tail) hypothesis test at 95% confidence and
a sample size of 25 is
a. 33.1963
b. 36.4151
c. 39.3641
d. 37.6525
Since the median is the middle value of a data set, it must always be
a. smaller than the mode
b. larger than the mode
c. smaller than the mean
d. None of the other answers are correct.
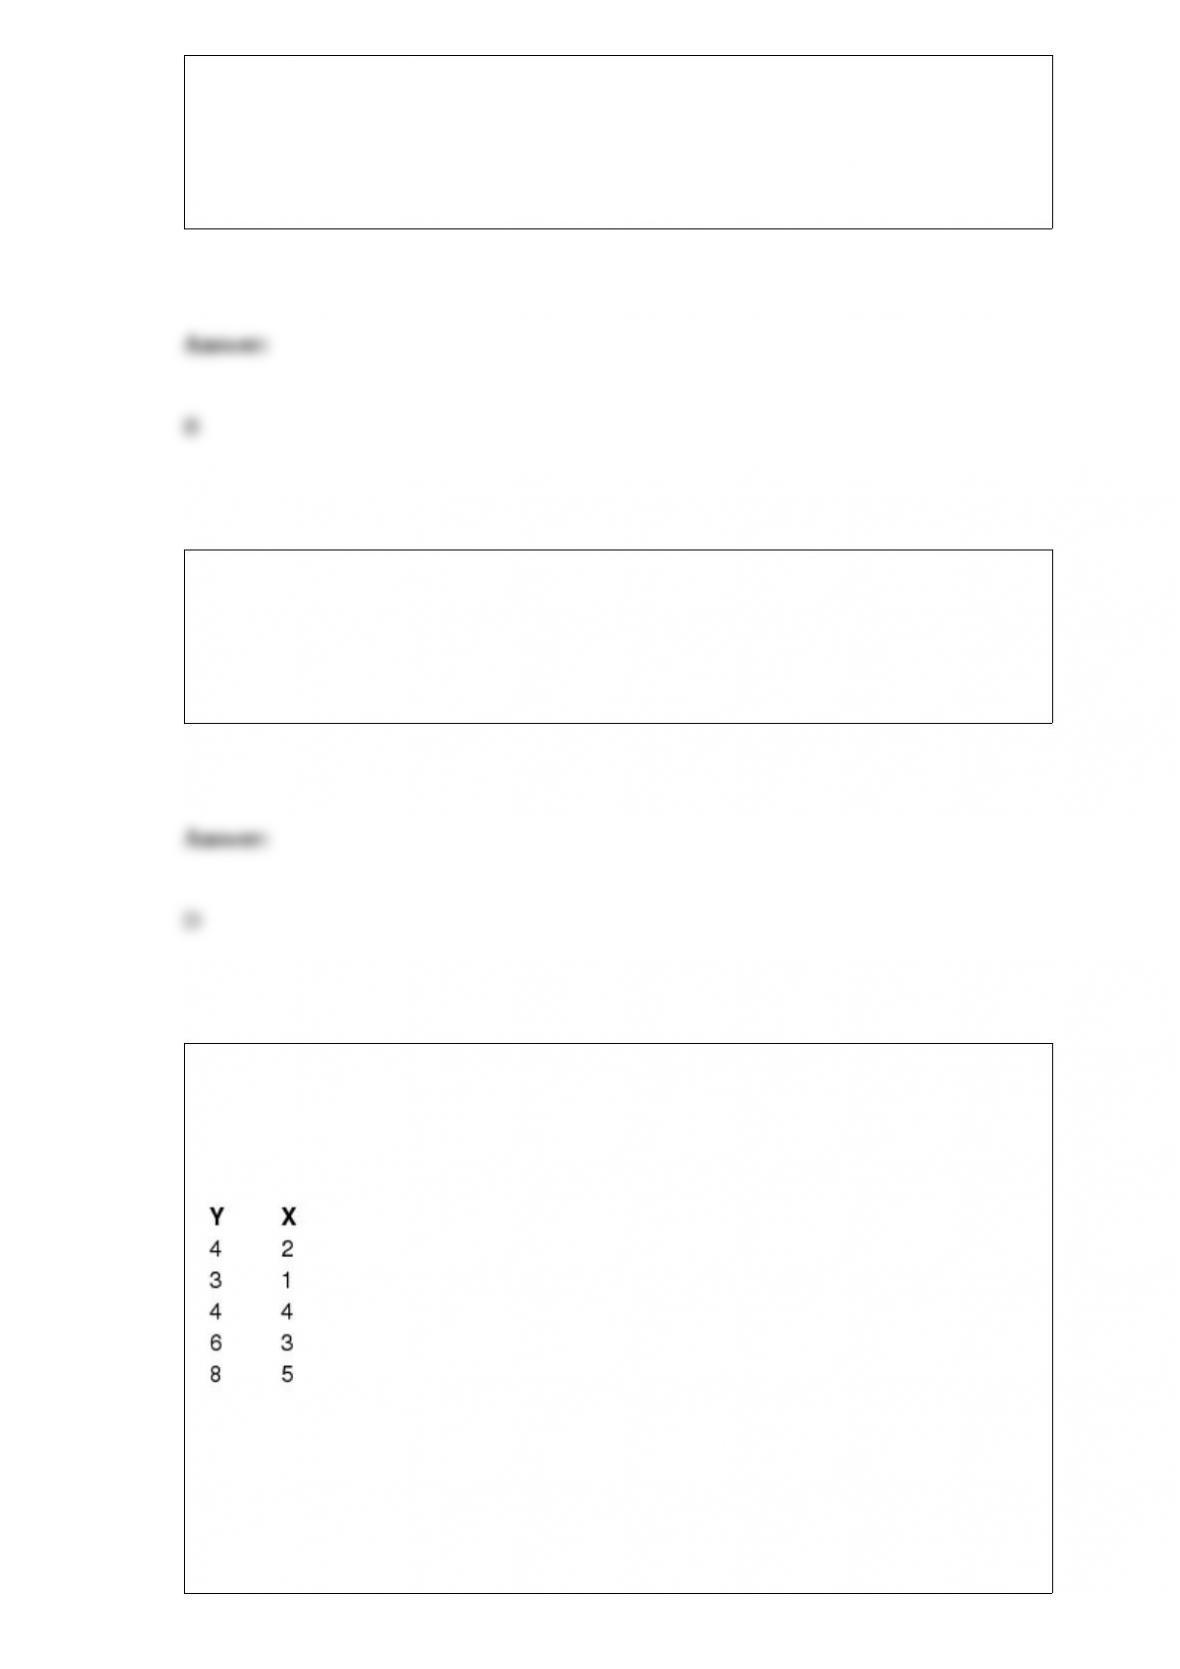
Exhibit 14-4
The following information regarding a dependent variable (Y) and an independent
variable (X) is provided.
SSE = 6
SST = 16
Refer to Exhibit 14-4. The least squares estimate of the Y intercept is

a. 1
b. 2
c. 3
d. 4
Exhibit 6-3
The weight of football players is normally distributed with a mean of 200 pounds and a
standard deviation of 25 pounds.
Refer to Exhibit 6-3. What is the random variable in this experiment?
a. the weight of football players
b. 200 pounds
c. 25 pounds
d. the normal distribution
A carpet company advertises that it will deliver your carpet within 15 days of purchase.
A sample of 49 past customers is taken. The average delivery time in the sample was
16.2 days. Assume the population standard deviation is known to be 5.6 days.
a. State the null and alternative hypotheses.
b. Using a critical value, test the null hypothesis at the 5% level of significance.
c. Using a p-value, test the hypothesis at the 5% level of significance.
d. What type of error may have been committed for this hypothesis test?
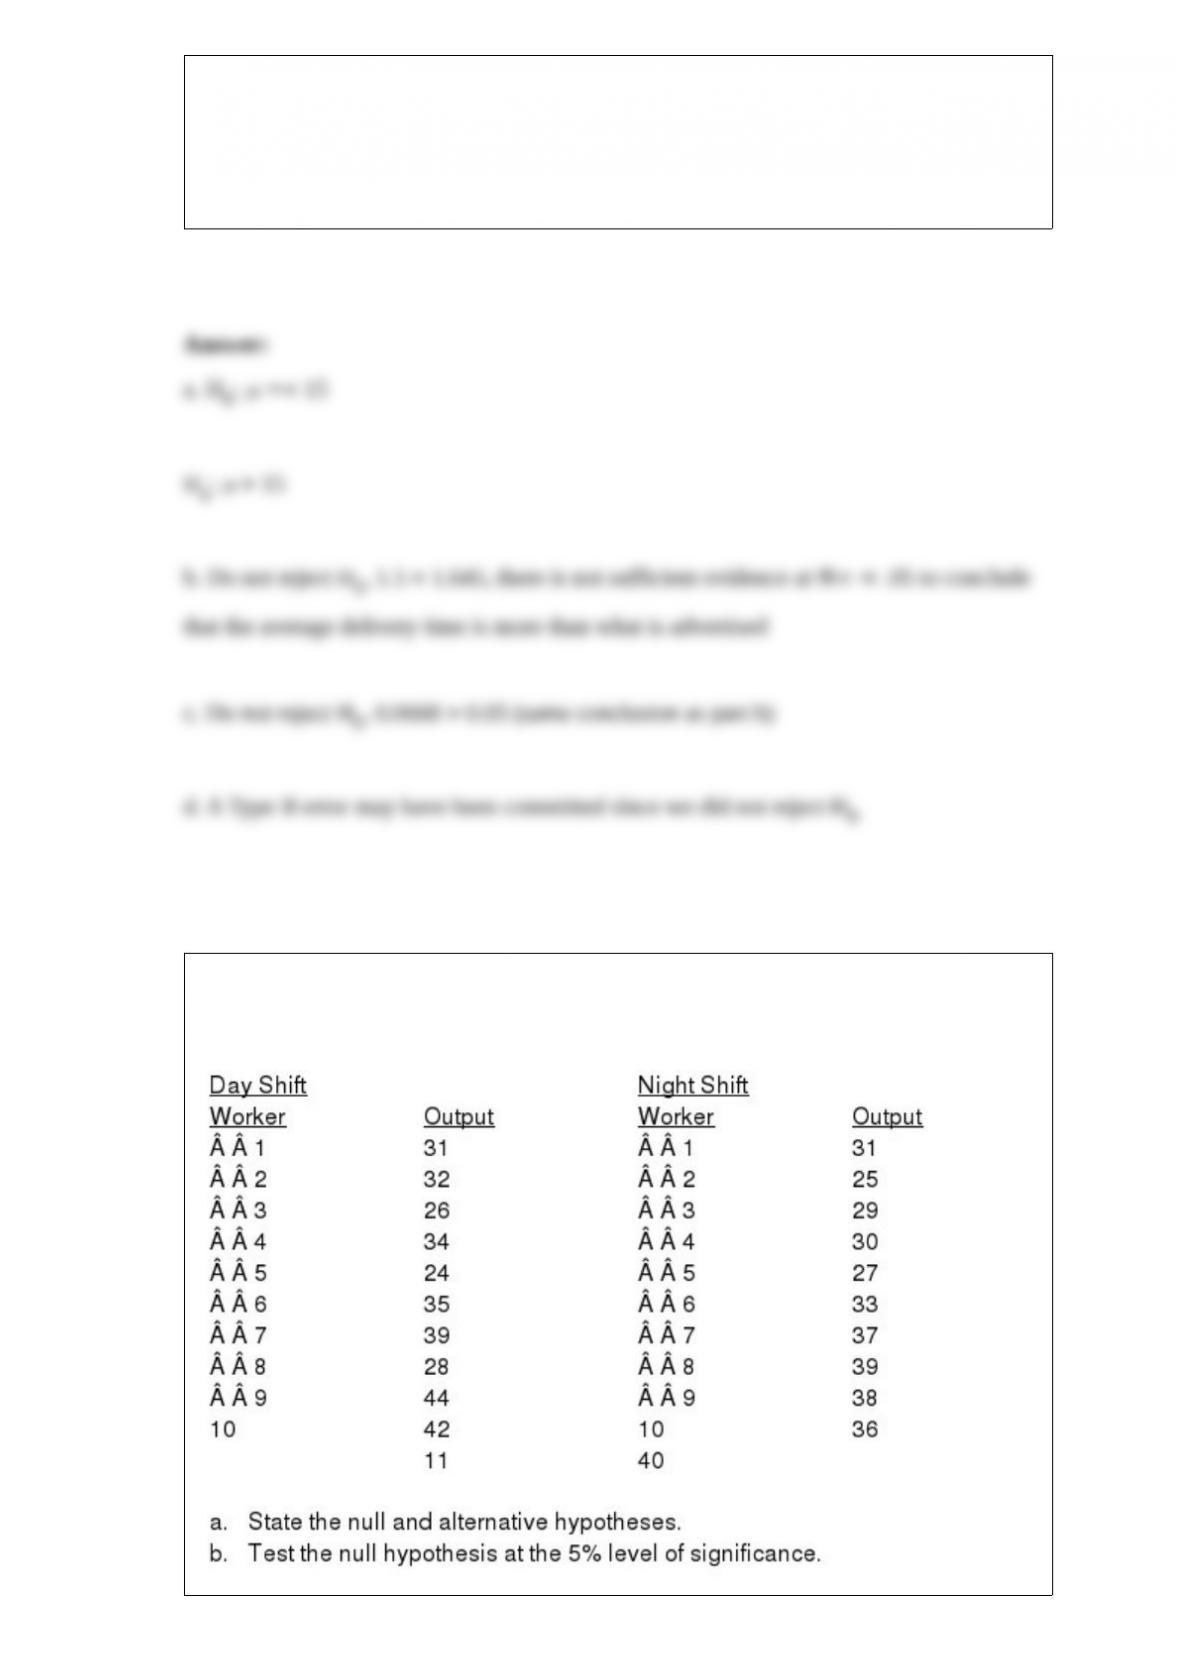
We want to see if the workers on the day and night shifts differ significantly in their
productivity levels. A sample of workers from both shifts was taken.
For a standard normal distribution, the probability of obtaining a z value between -2.4
to -2.0 is
a. 0.4000
b. 0.0146
c. 0.0400
d. 0.5000
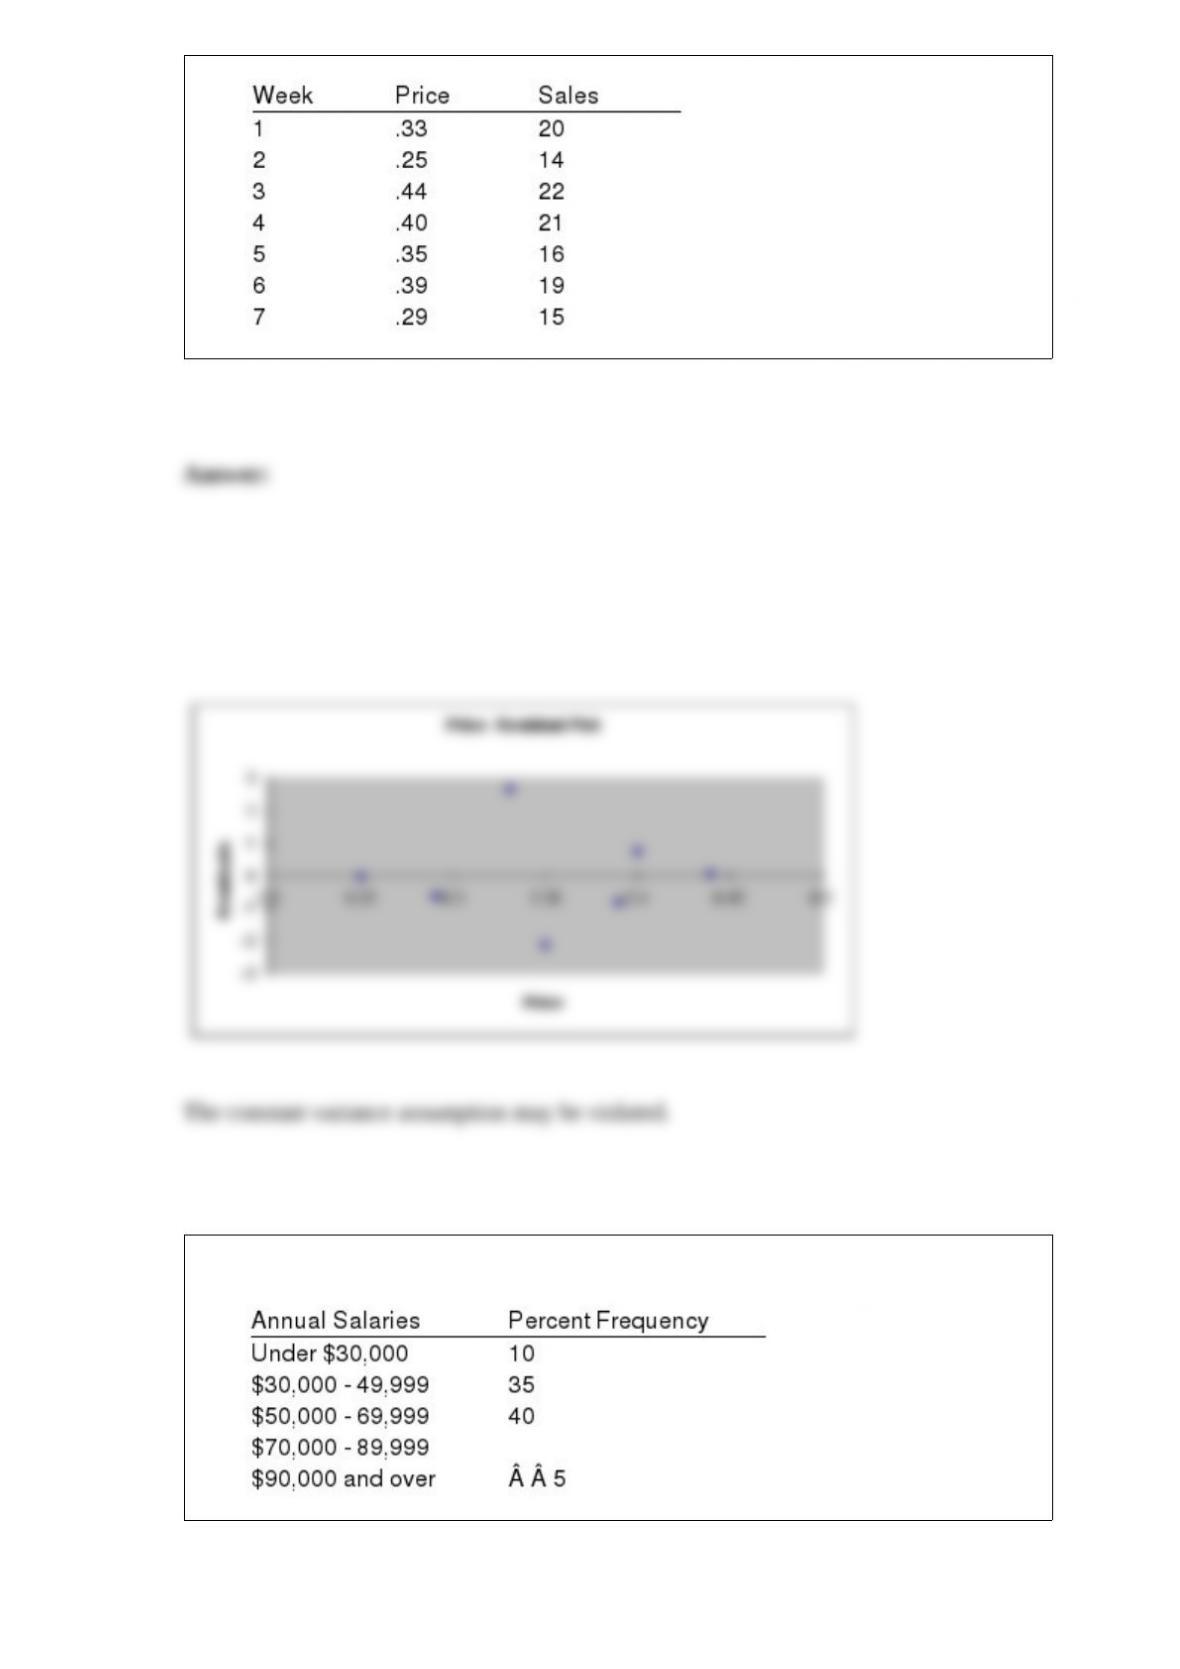
A company has recorded data on the weekly sales for its product (y) and the unit price
of the competitor’s product (x). The data resulting from a random sample of 7 weeks
follows. Use Excel’s Regression Tool to construct a residual plot and use it to determine
if any model assumption have been violated.
Fill in the missing value for the following percent frequency distribution.
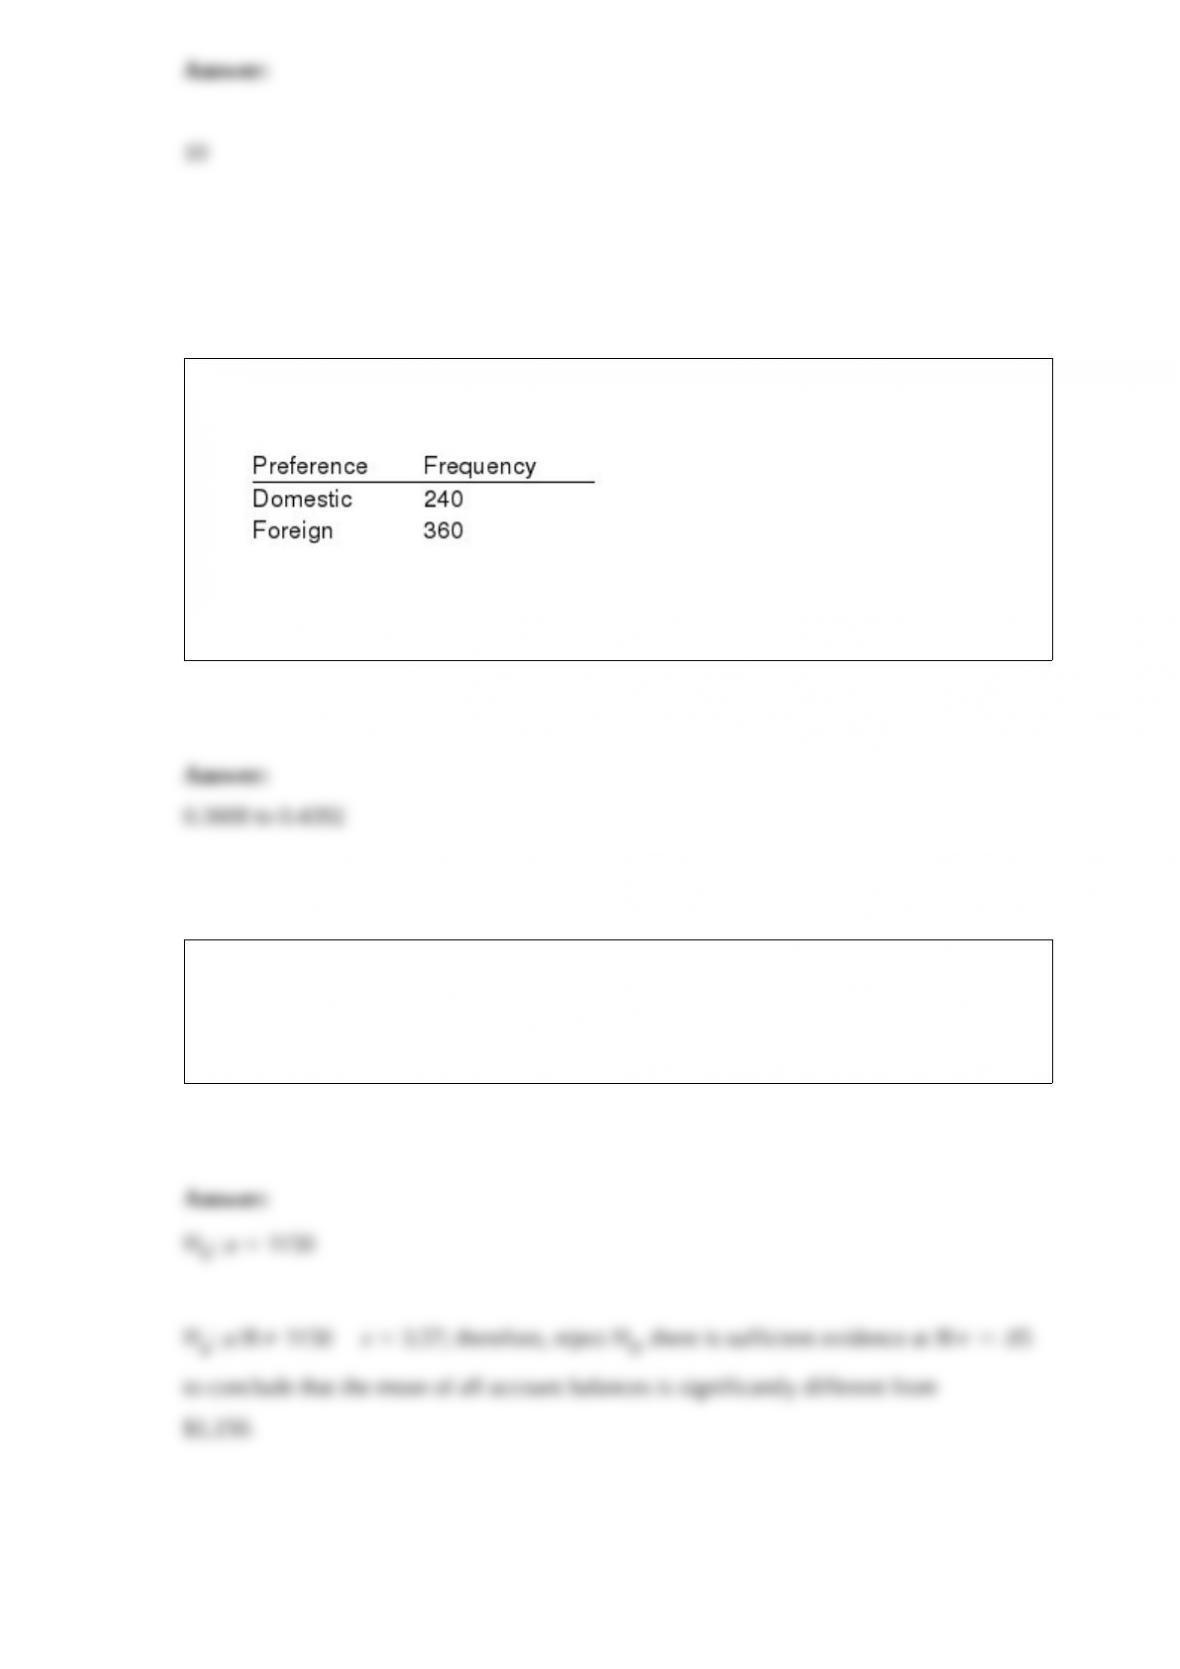
Six hundred consumers were asked whether they would like to purchase a domestic or a
foreign automobile. Their responses are given below.
Develop a 95% confidence interval for the proportion of all consumers who prefer to
purchase domestic automobiles.
A sample of 81 account balances of a credit company showed an average balance of
$1,200. The population standard deviation is $126. You want to determine if the mean
of all account balances is significantly different from $1,150. Use a .05 level of
significance.
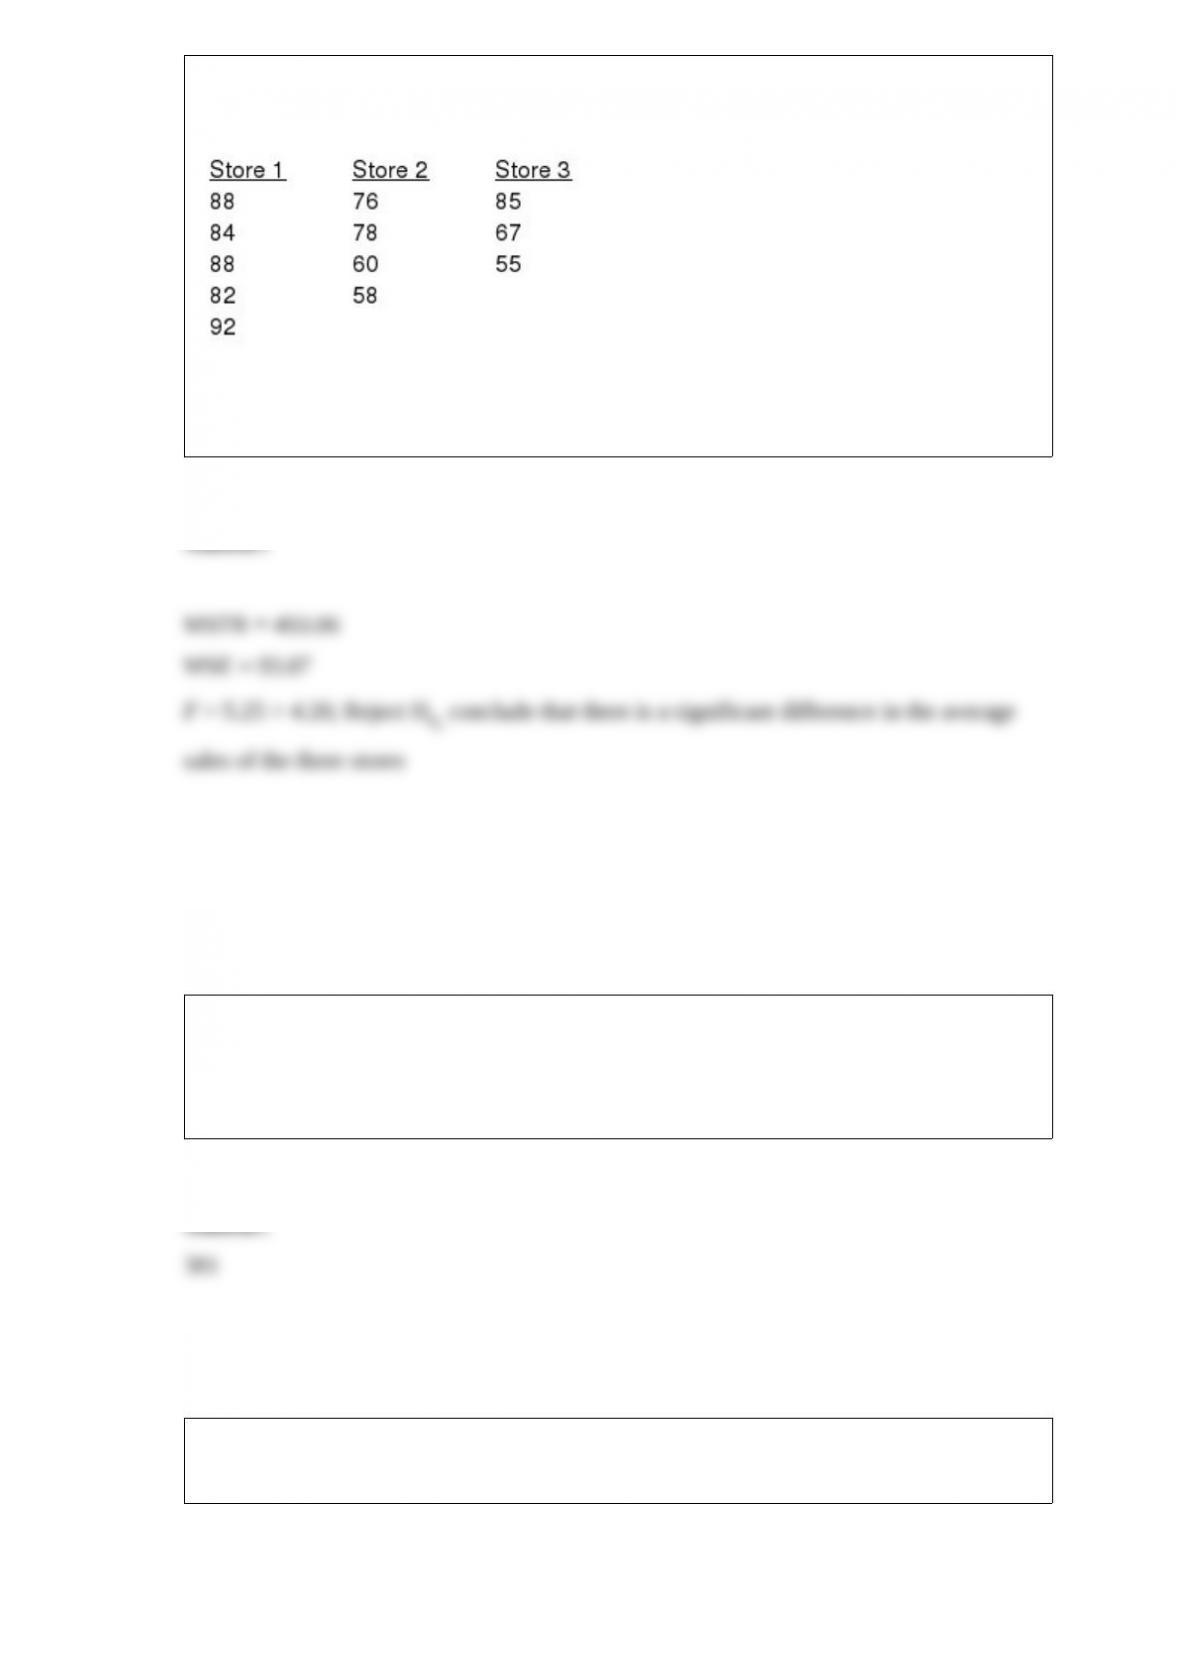
MNM, Inc. has three stores located in three different areas. Random samples of the
sales of the three stores (in $1,000) are shown below.
At a 5% level of significance, test to see if there is a significant difference in the
average sales of the three stores. Show your complete work and the ANOVA table.
(Please note that the sample sizes are not equal.)
A local hotel wants to estimate the proportion of its guests that are from out-of-state.
Preliminary estimates are that 45% of the hotel guests are from out-of-state. How large
a sample should be taken to estimate the proportion of out-of-state guests with a margin
of error no larger than 5% and with a 95% level of confidence?
The three major automobile manufacturers have entered their cars in the Indianapolis
500 race. The speeds of the tested cars are given below.
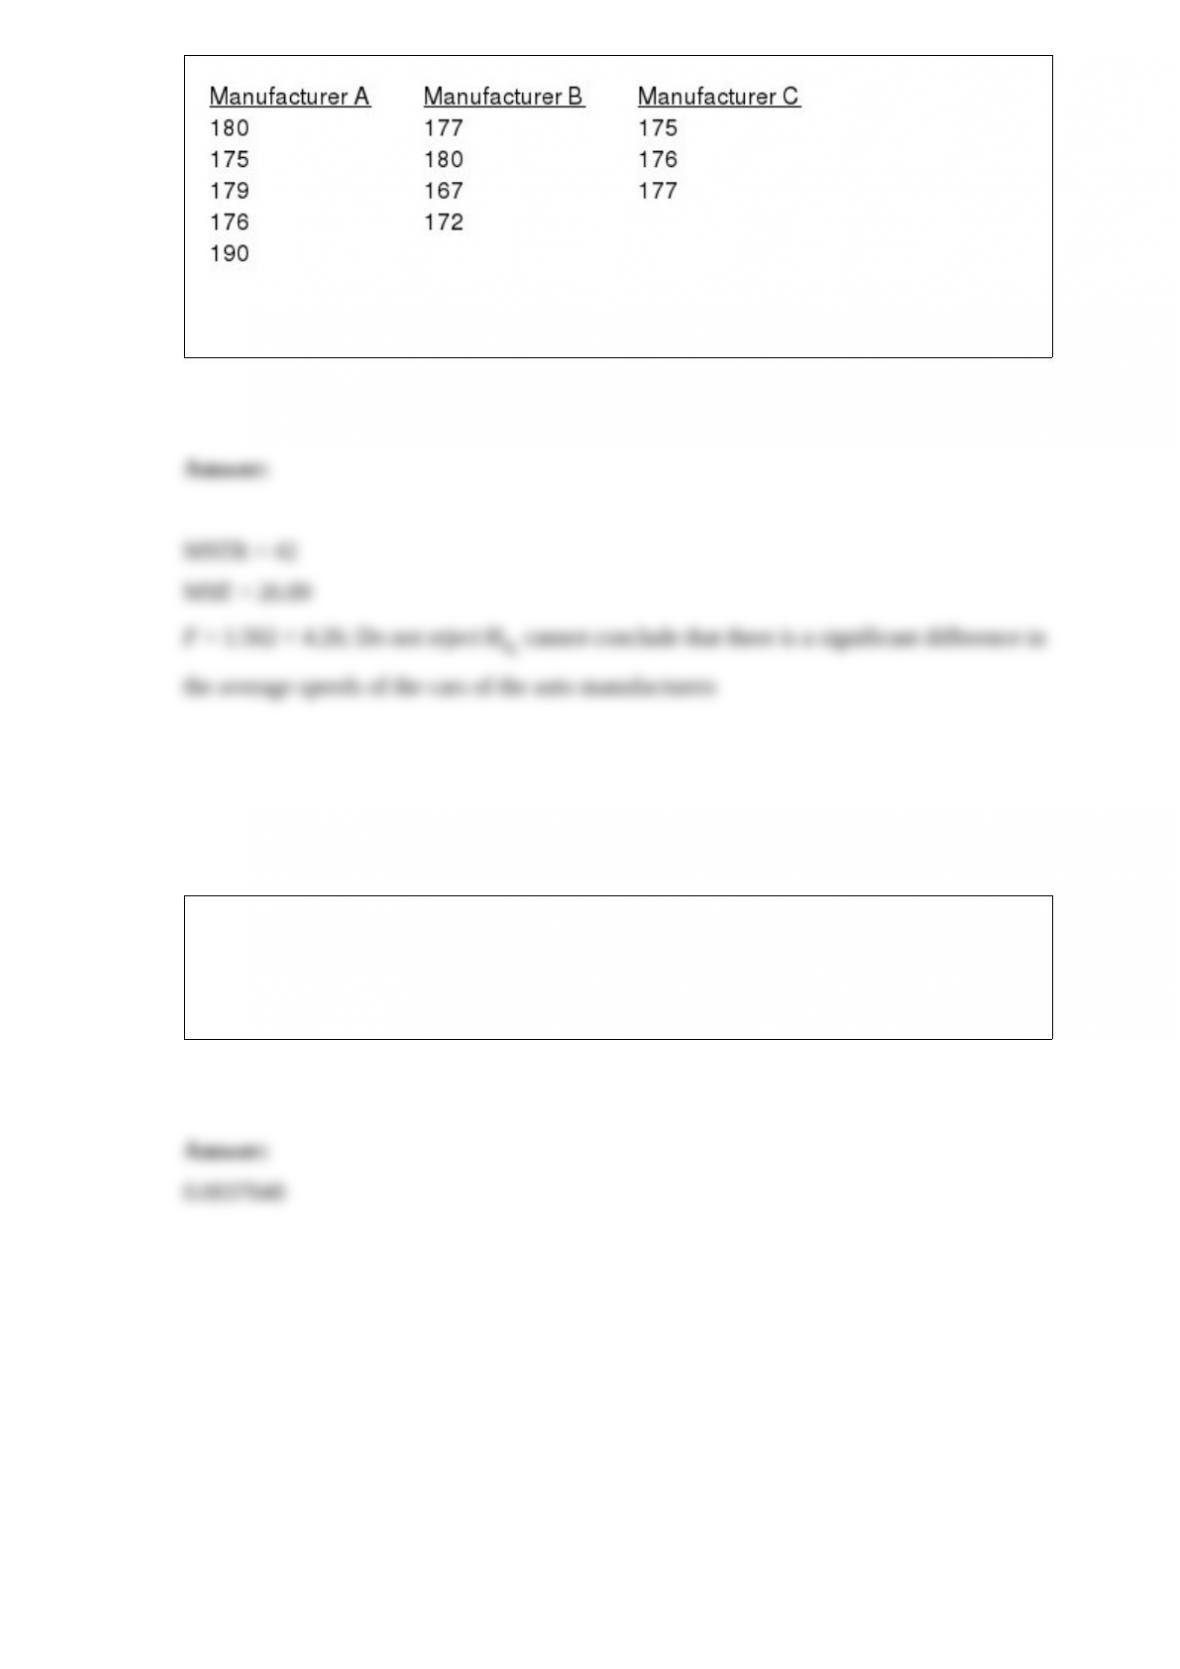
At = .05, test to see if there is a significant difference in the average speeds of the cars
of the auto manufacturers.
A production process produces 2% defective parts. A sample of 5 parts from the
production is selected. What is the probability that the sample contains exactly two
defective parts? Use the binomial probability function and show your computations to
answer this question.