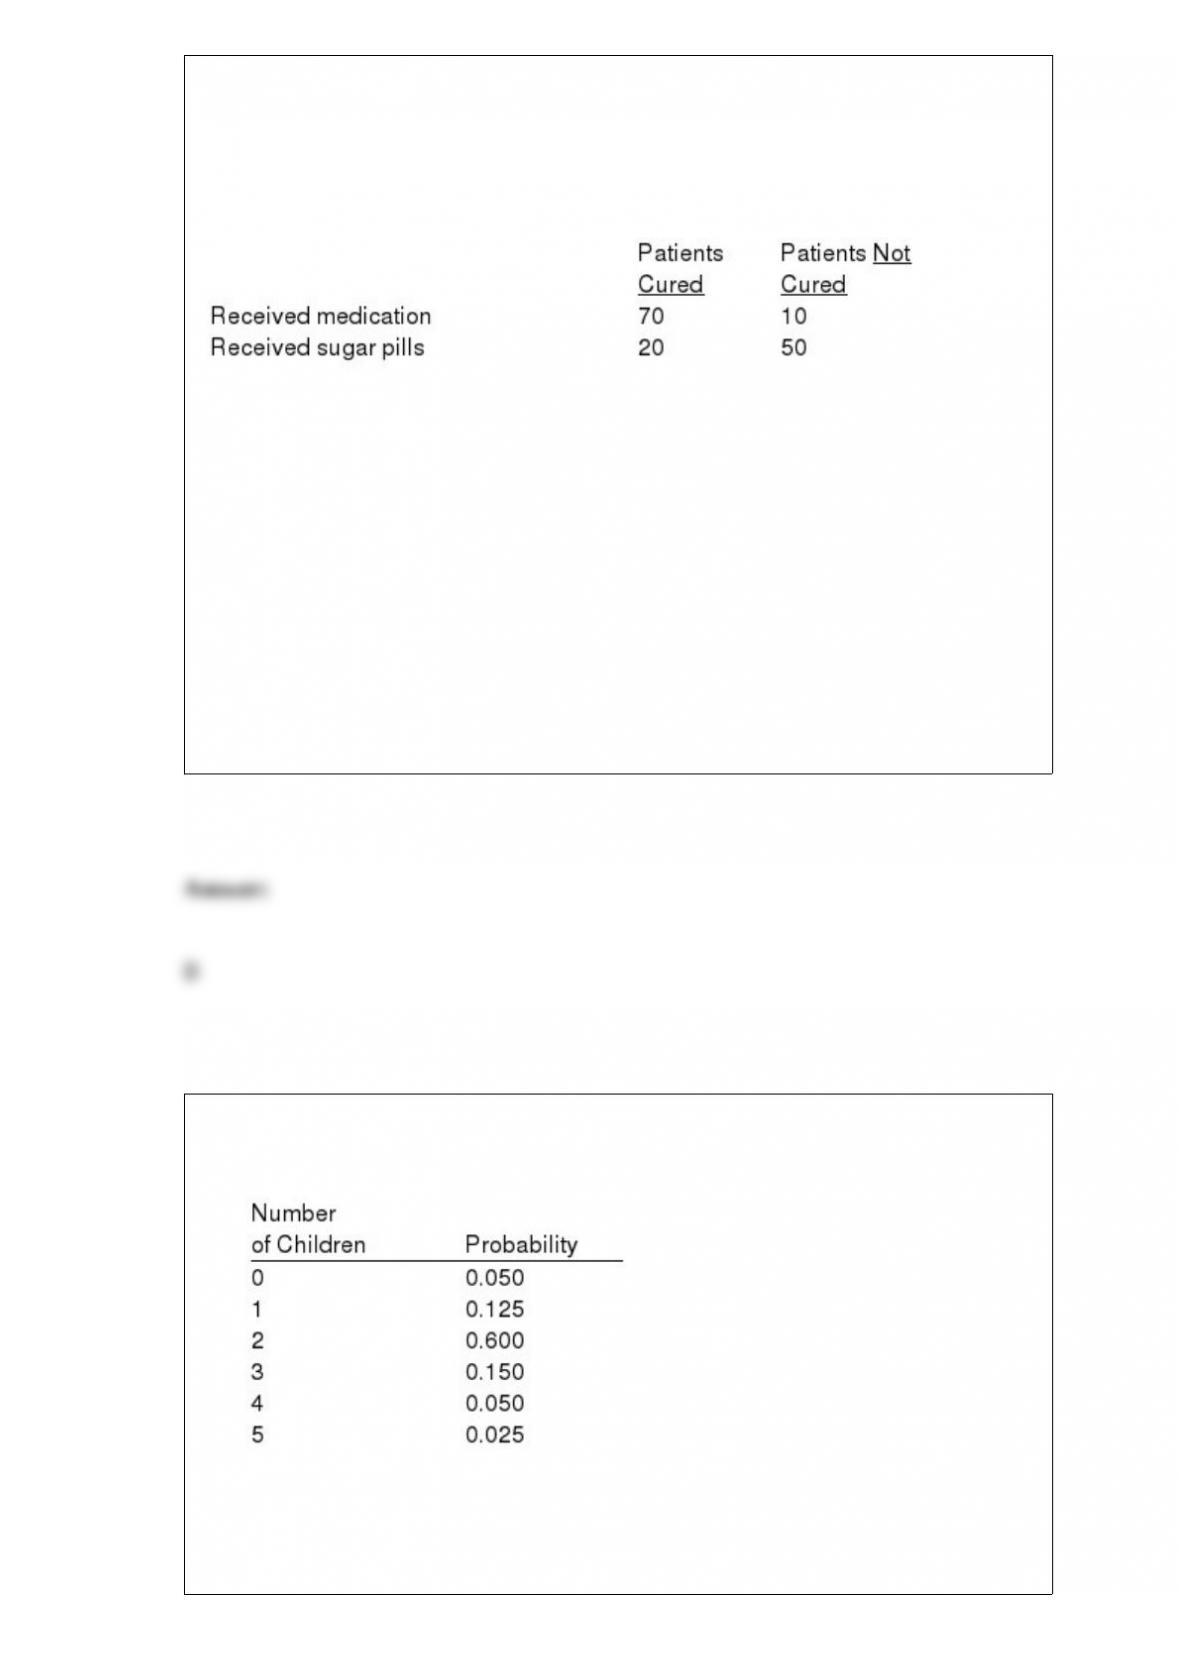
Exhibit 12-3
In order to determine whether or not a particular medication was effective in curing the
common cold, one group of patients was given the medication, while another group
received sugar pills. The results of the study are shown below.
We are interested in determining whether or not the medication was effective in curing
the common cold.
Refer to Exhibit 12-3. The null hypothesis
a. should not be rejected
b. should be rejected
c. should be revised
d. None of these alternatives is correct.
The results of a survey of 800 married couples and the number of children they had is
shown below.
If a couple is selected at random, what is the probability that the couple will have
a. Less than 4 children?
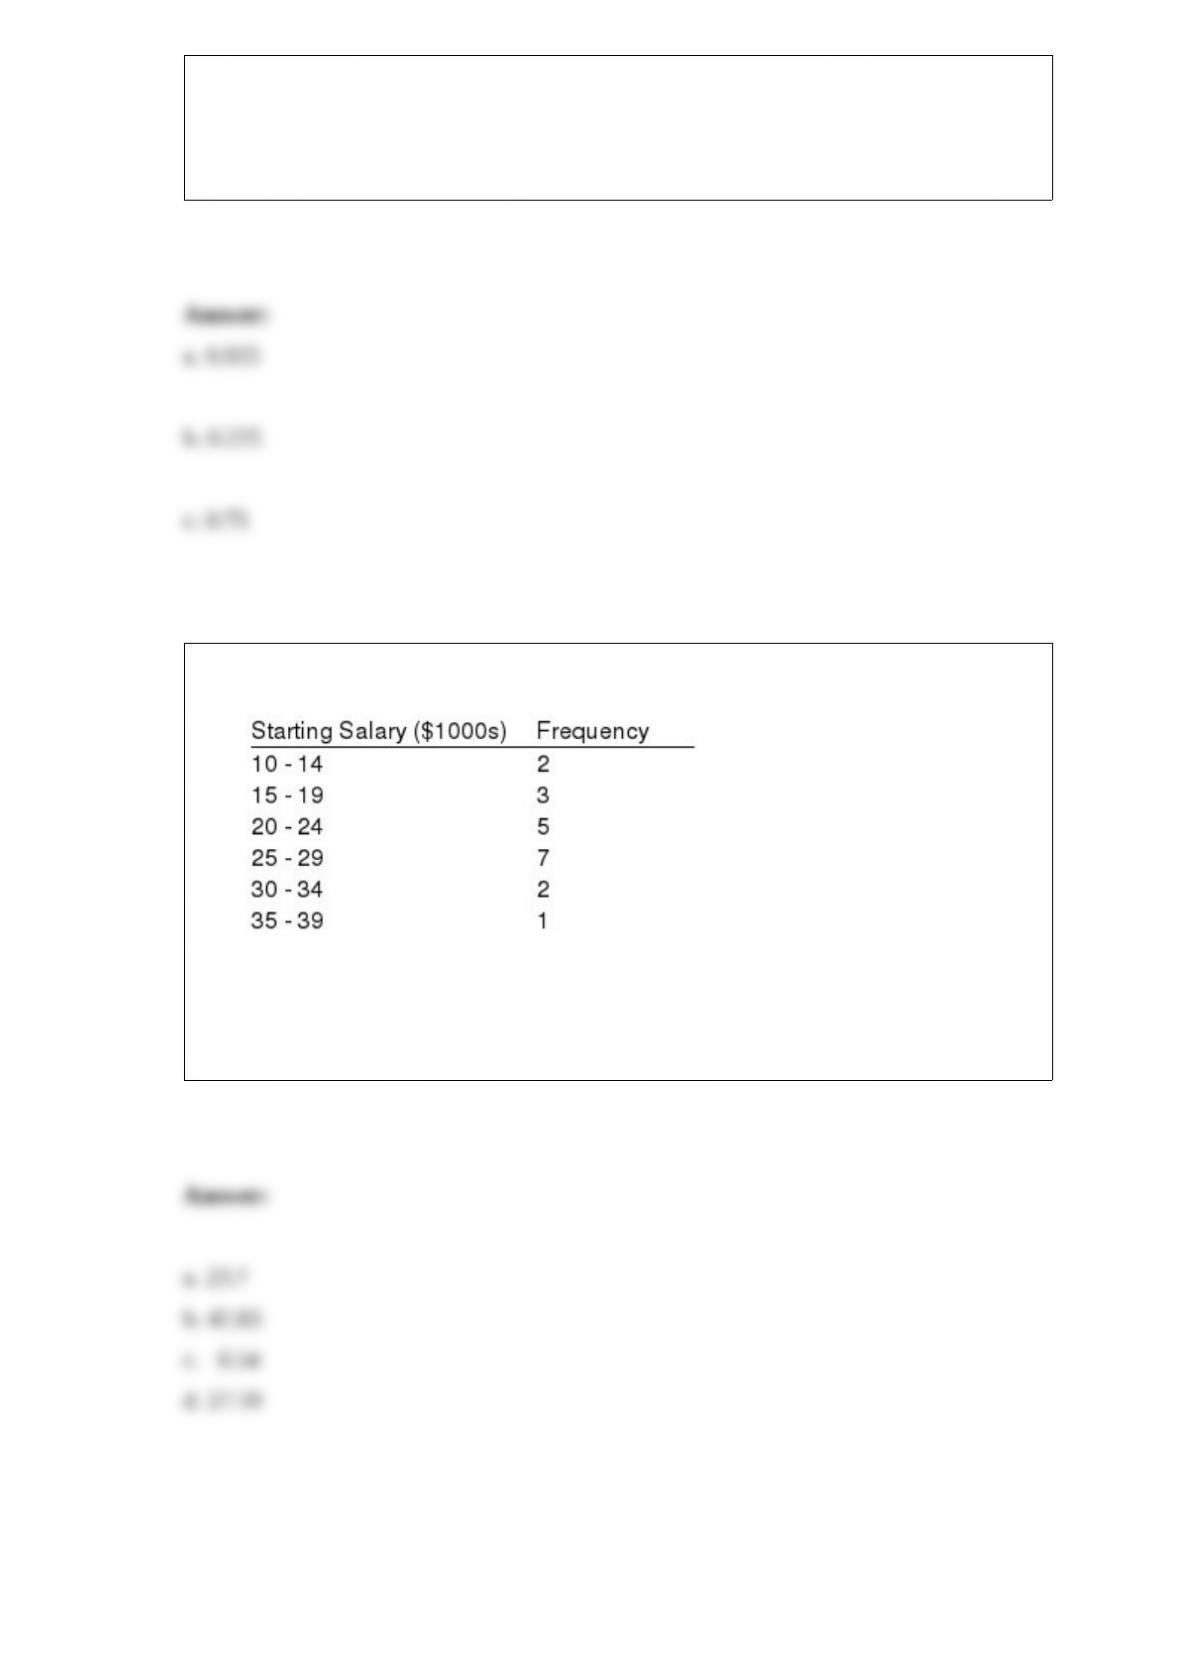
b. More than 2 children?
c. Either 2 or 3 children?
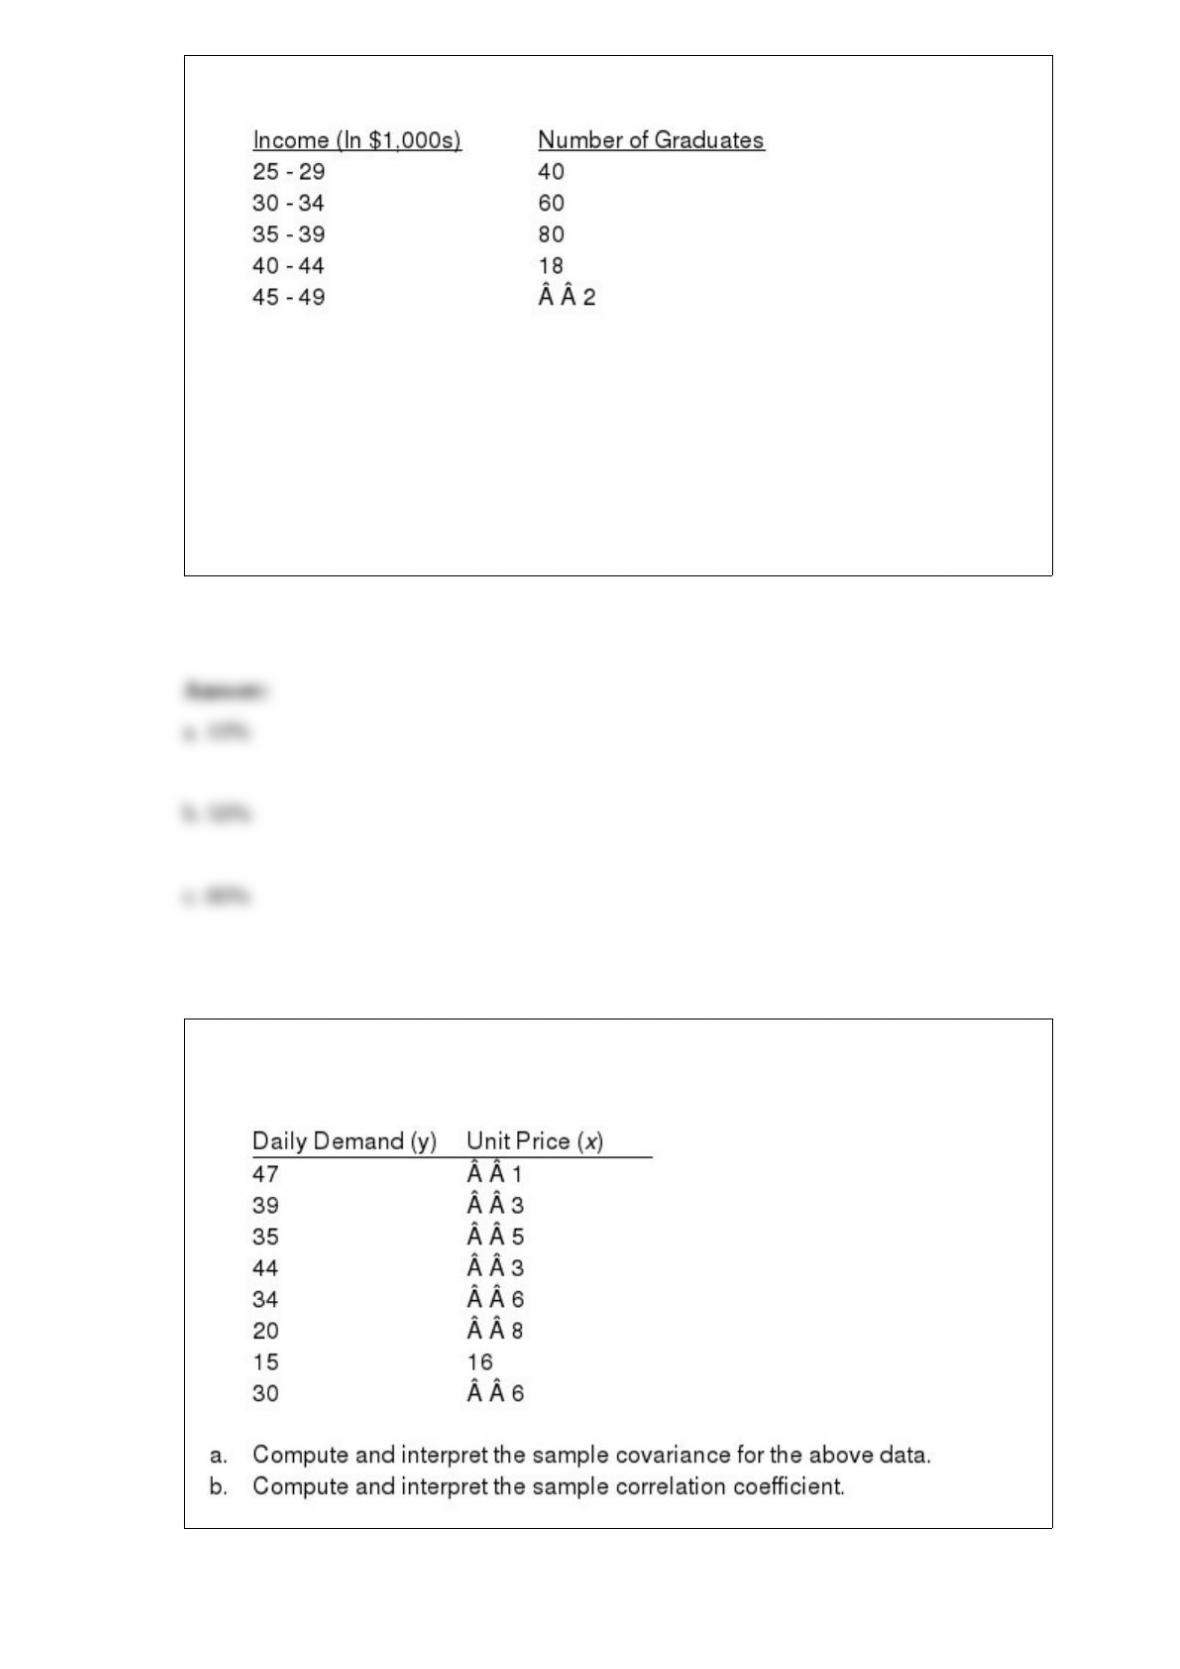
The starting salaries of a sample of community college graduates are given below.
a. Compute the mean.
b. Compute the variance.
c. Compute the standard deviation.
d. Compute the coefficient of variation.
The following table shows the starting salaries of a sample of recent VoTech graduates.
a. What percentage of graduates in the sample had starting salaries of at least $40,000?
b. Of the graduates in the sample, what percentage had starting salaries of less than
$35,000?
c. Based on this sample, what percentage of all VoTech graduates do you estimate to
have starting salaries of at least $30,000?
The following data represent the daily demand (y in thousands of units) and the unit
price (x in dollars) for a product.
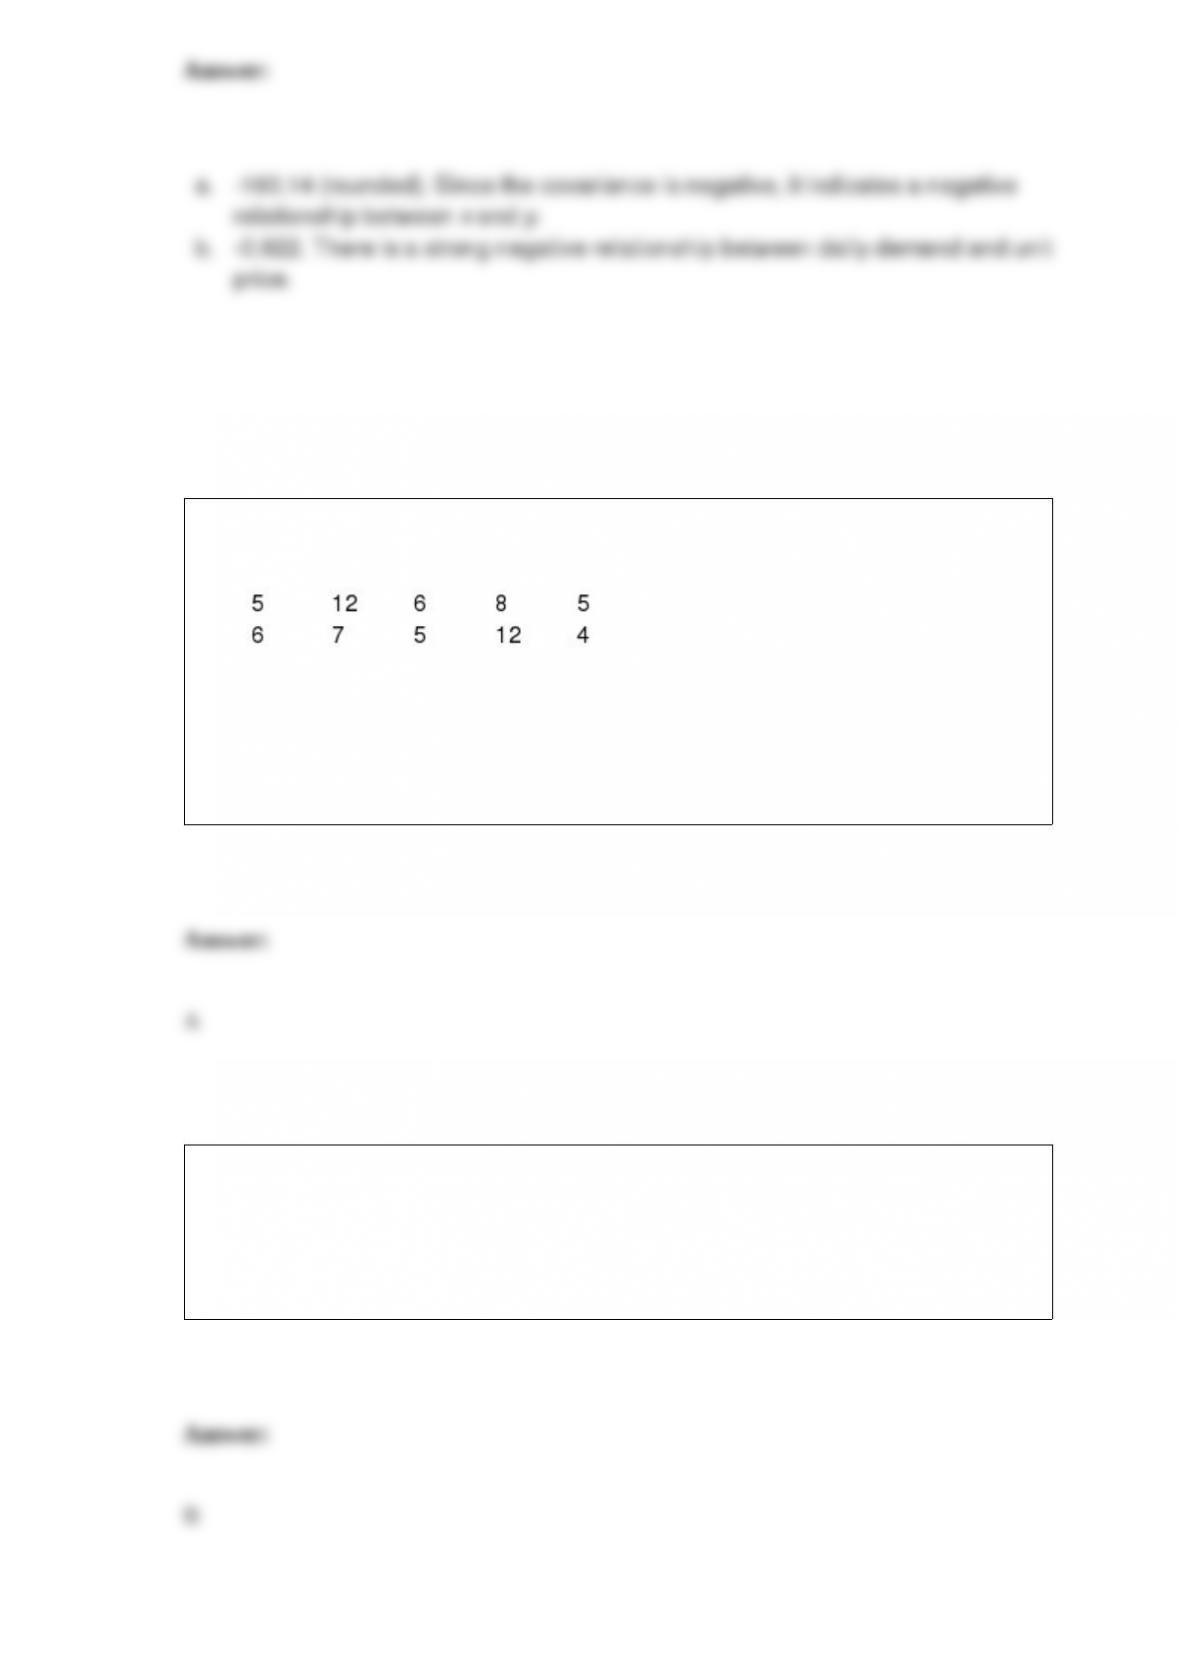
Exhibit 3-1
A researcher has collected the following sample data.
Refer to Exhibit 3-1. The mode is
a. 5
b. 6
c. 7
d. 8
Which of the following statements about the backward elimination procedure is false?
a. It is a one-variable-at-a-time procedure.
b. It begins with the regression model found using the forward selection procedure.
c. It does not permit an independent variable to be reentered once it has been removed.
d. It does not guarantee that the best regression model will be found.
46. A posterior probability associated with sample information is of the form
a. P(a state of nature | a sample outcome)
b. P(a sample outcome | a state of nature)
c. P(a decision alternative | a sample outcome)
d. P(a sample outcome | a decision alternative)
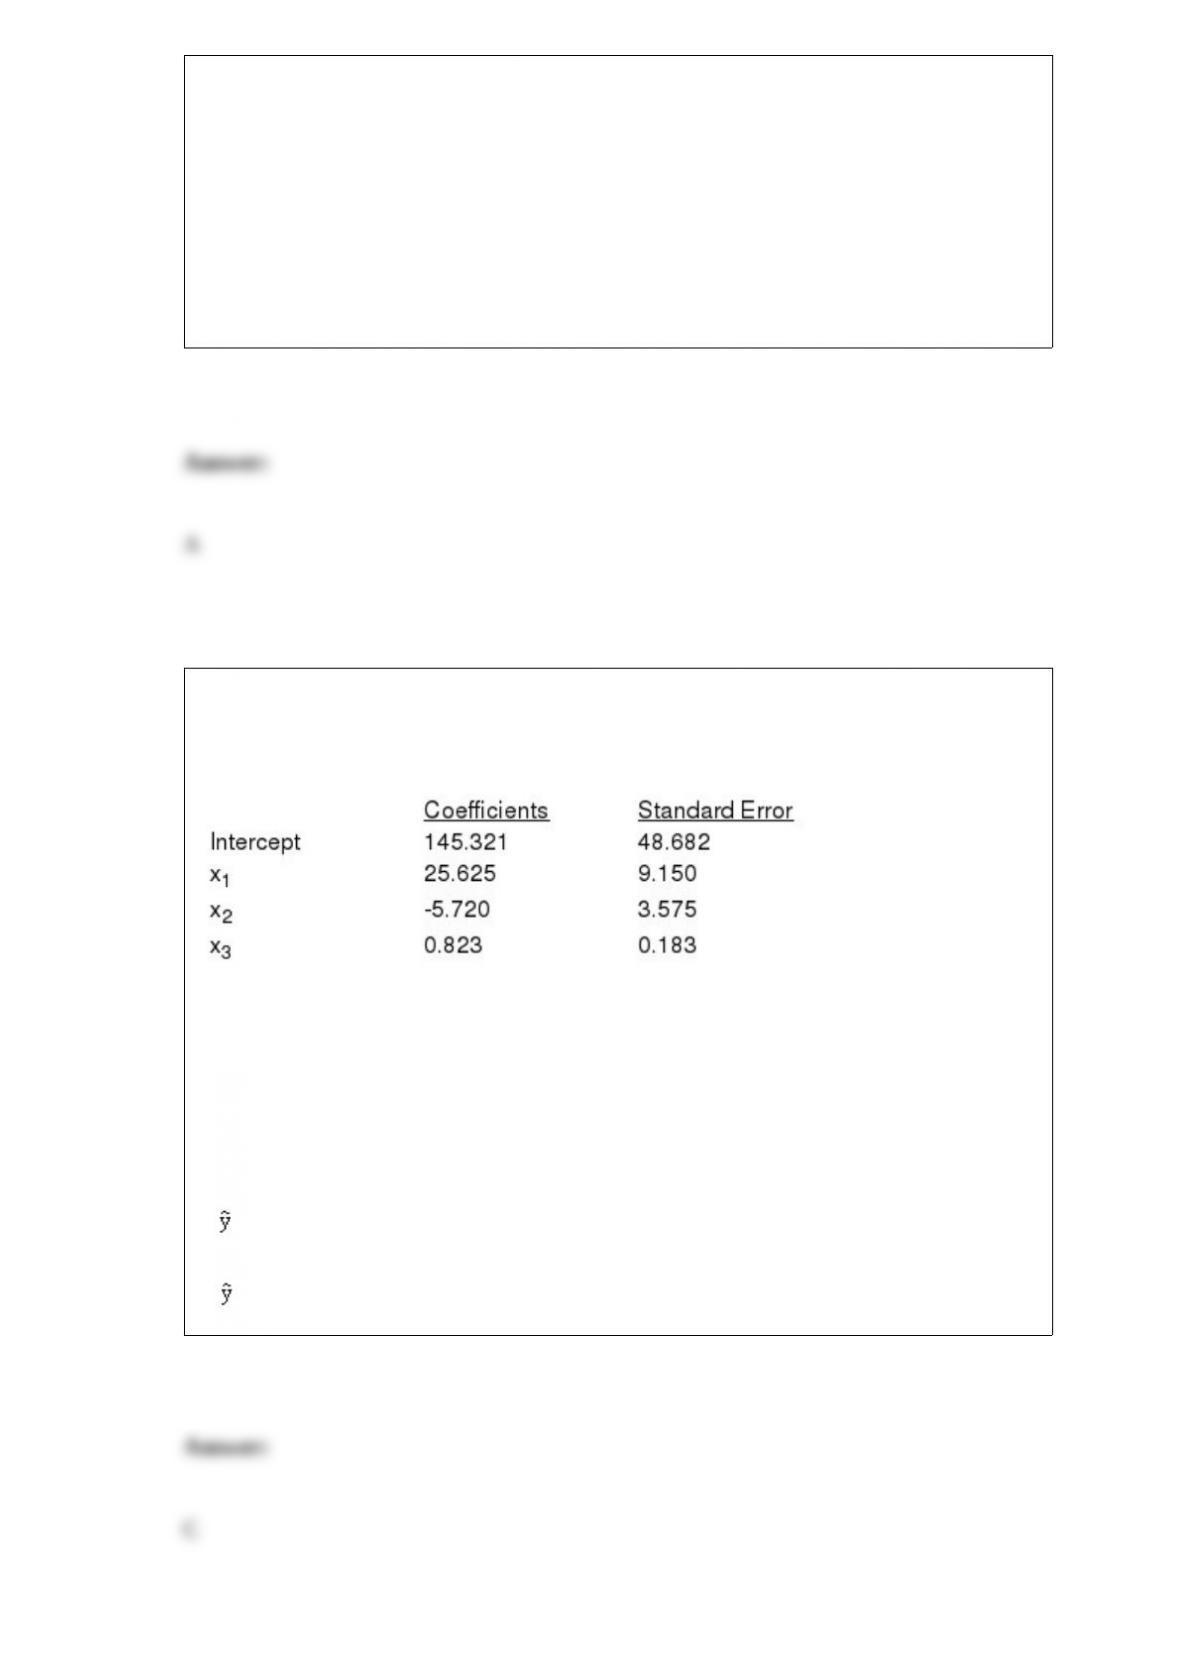
Exhibit 15-5
Below you are given a partial Excel output based on a sample of 25 observations.
Refer to Exhibit 15-5. The estimated regression equation is
a. y = 0 + 1x1 + 2x2 + 3x3 +
b. E(y) = 0 + 1x1 + 2x2 + 3x3
c. = 145.321 + 25.625x1 – 5.720x2 + 0.823x3
d. = 48.682 + 9.15x1 + 3.575x2 + 0.183x3

Exhibit 10-11
An insurance company selected samples of clients under 18 years of age and over 18
and recorded the number of accidents they had in the previous year. The results are
shown below.
We are interested in determining if the accident proportions differ between the two age
groups.
Refer to Exhibit 10-11. The p-value is
a. less than 0.001
b. more than 0.10
c. 0.0228
d. 0.3
Exhibit 5-11
The random variable x is the number of occurrences of an event over an interval of ten
minutes. It can be assumed that the probability of an occurrence is the same in any two
time periods of an equal length. It is known that the mean number of occurrences in ten
minutes is 5.3.
YRefer to Exhibit 5-11. The probability that there are less than 3 occurrences is
a. .0659
b. .0948
c. .1016

d. .1239
Which of the following is a statistical method used in quality control?
a. statistical process control
b. acceptance sampling
c. Both statistical process control and acceptance sampling are correct.
d. None of the other answers is correct.
A tabular summary of a set of data showing the fraction of the total number of items in
several nonoverlapping classes is a
a. frequency distribution.
b. relative frequency distribution.
c. frequency.
d. cumulative frequency distribution.
A graph showing the probability of accepting the lot as a function of the percent
defective in the lot is
a. a power curve
b. a control chart
c. an operating characteristic curve
d. None of the other answers is correct.
In a random sample of 400 registered voters, 120 indicated they plan to vote for
Candidate A. Determine a 95% confidence interval for the proportion of all the
registered voters who will vote for Candidate A.
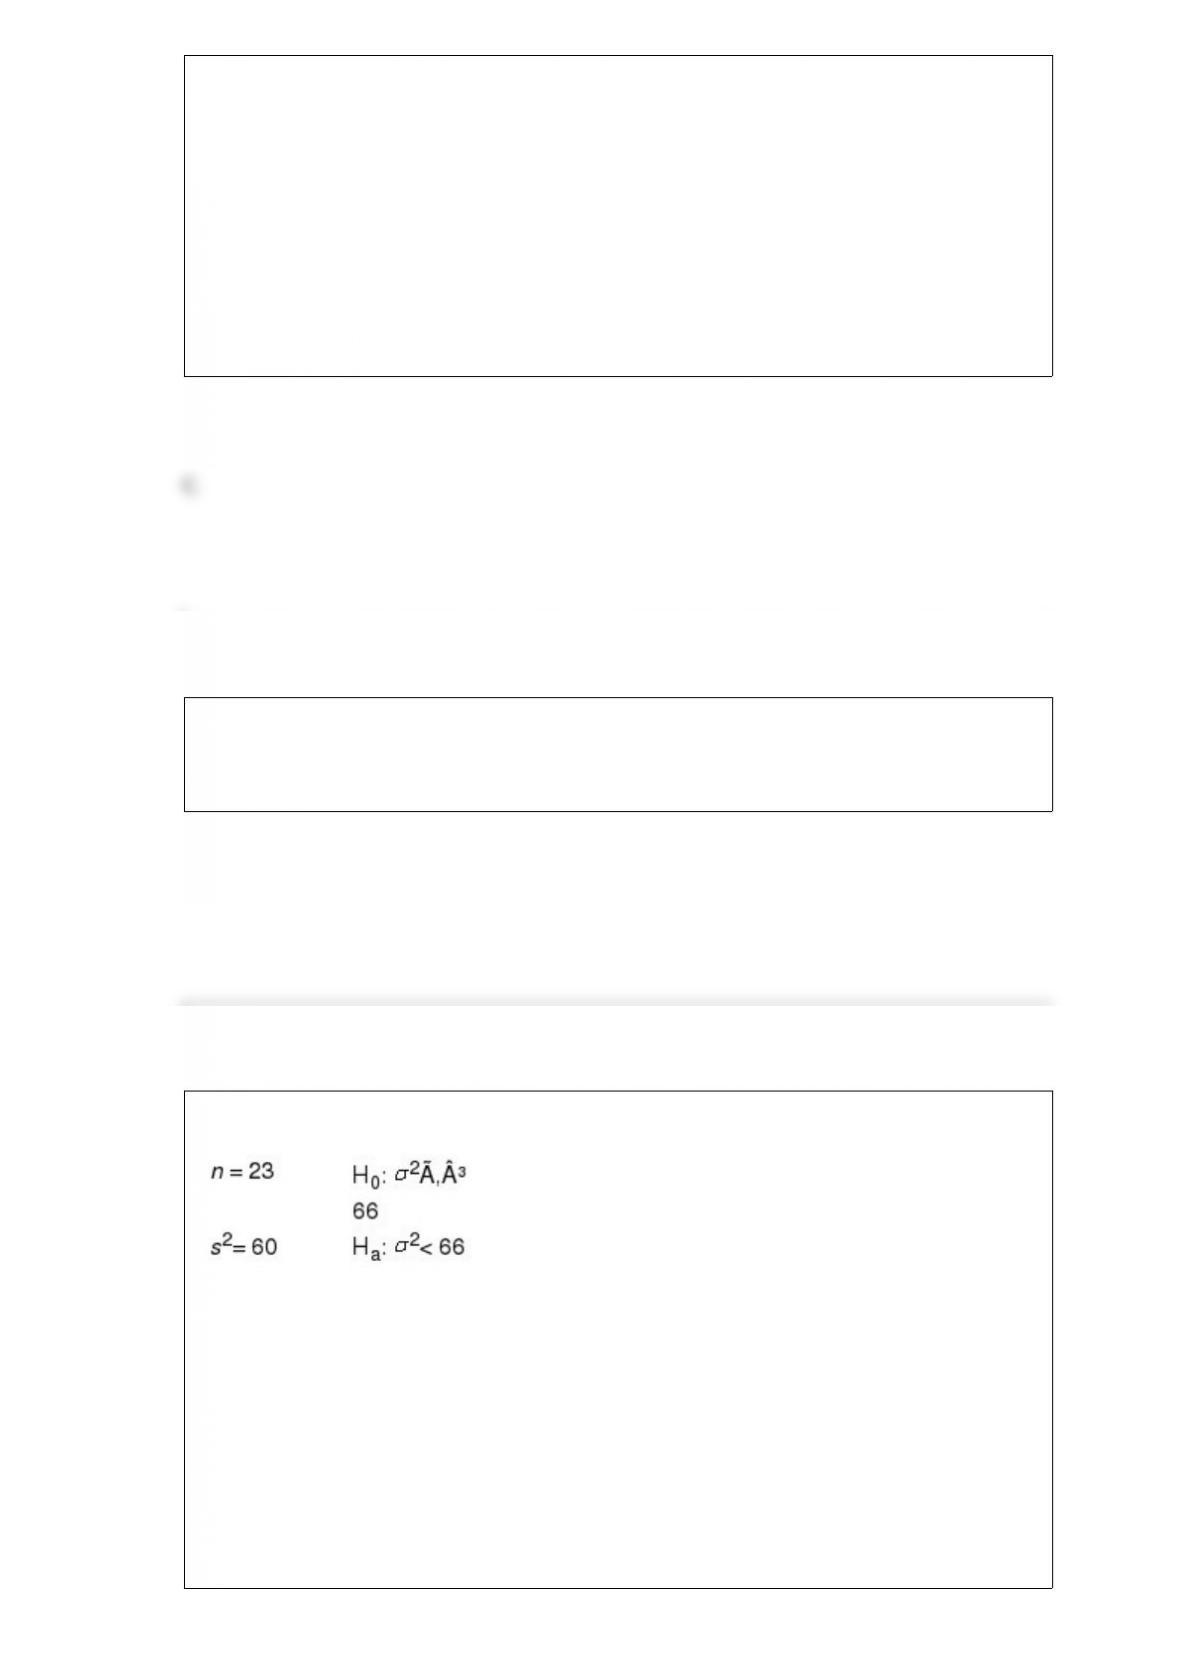
Exhibit 11-8
Refer to Exhibit 11-8. The p-value is
a. less than 0.025
b. less than 0.05
c. less than 0.10
d. greater than 0.10
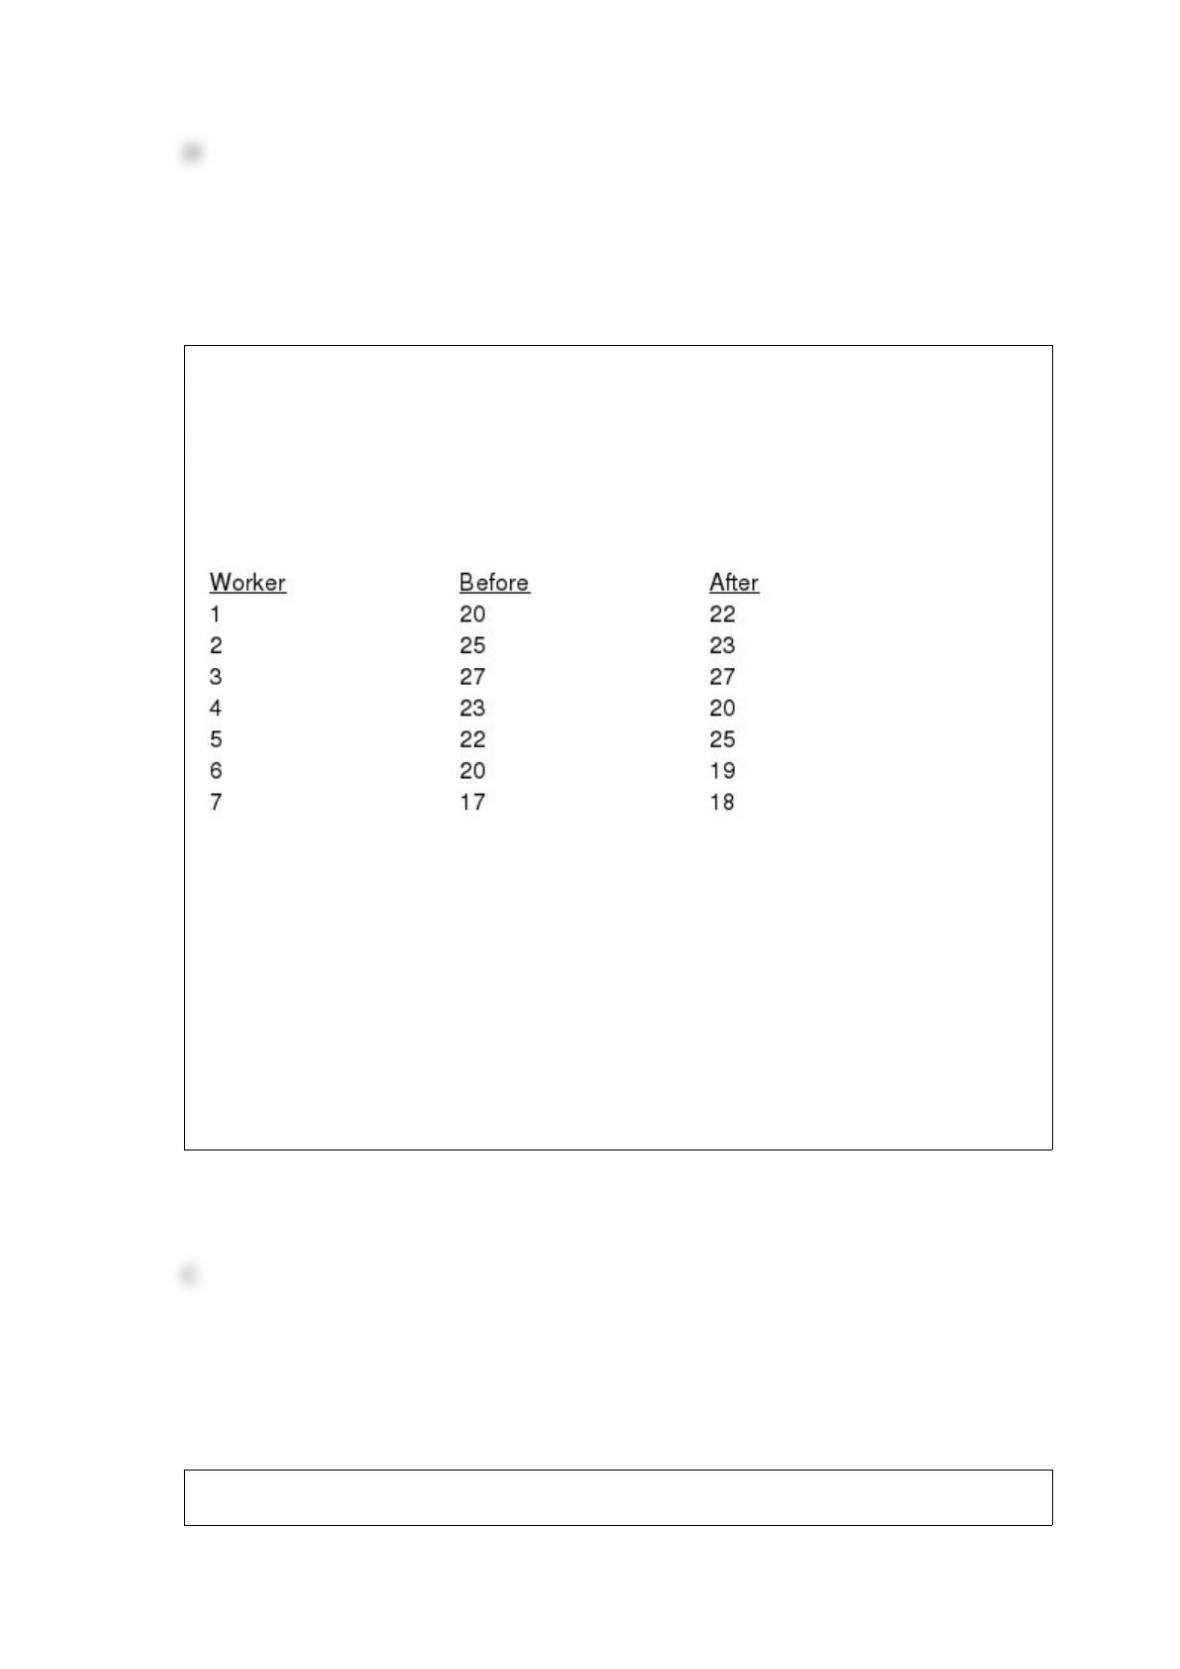
Exhibit 10-2
The following information was obtained from matched samples.
The daily production rates for a sample of workers before and after a training program
are shown below.
Refer to Exhibit 10-2. The null hypothesis to be tested is H0: d = 0. The test statistic is
a. -1.96
b. 1.96
c. 0
d. 1.645
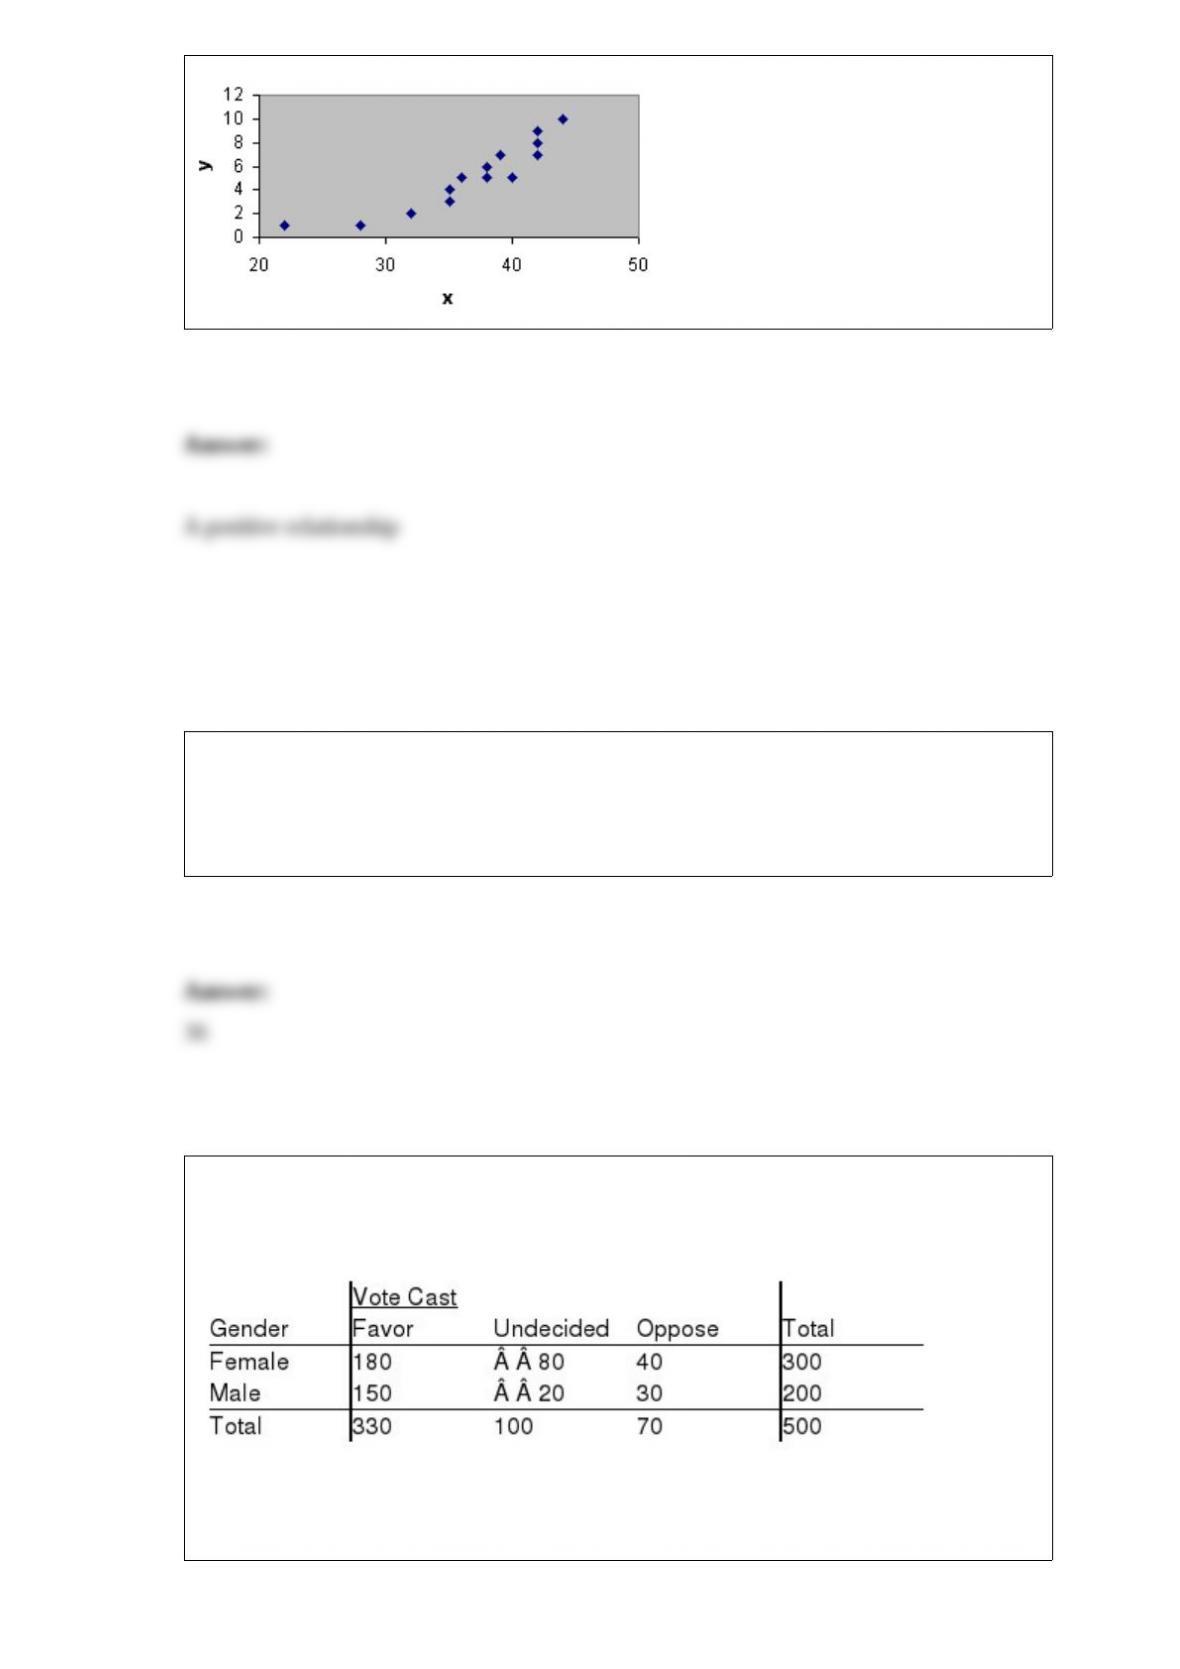
What type of relationship is depicted in the following scatter diagram?
We are interested in selecting a sample from a population of size 4,000 in order to
develop an approximate 95% confidence interval estimate of the population mean. A
pilot study has resulted in a standard deviation of 600. What should be the sample size
if we do not want the sampling error to exceed 200?
A group of 500 individuals were asked to cast their votes regarding a particular issue of
the Equal Rights Amendment. The following contingency table shows the results of the
votes:
Test at = .05 to determine if the votes cast were independent of the gender of the
individuals.
A manufacturing process produces items whose weights are normally distributed. It is
known that 22.57% of all the items produced weigh between 100 grams up to the mean
and 49.18% weigh from the mean up to 190 grams. Determine the mean and the
standard deviation.
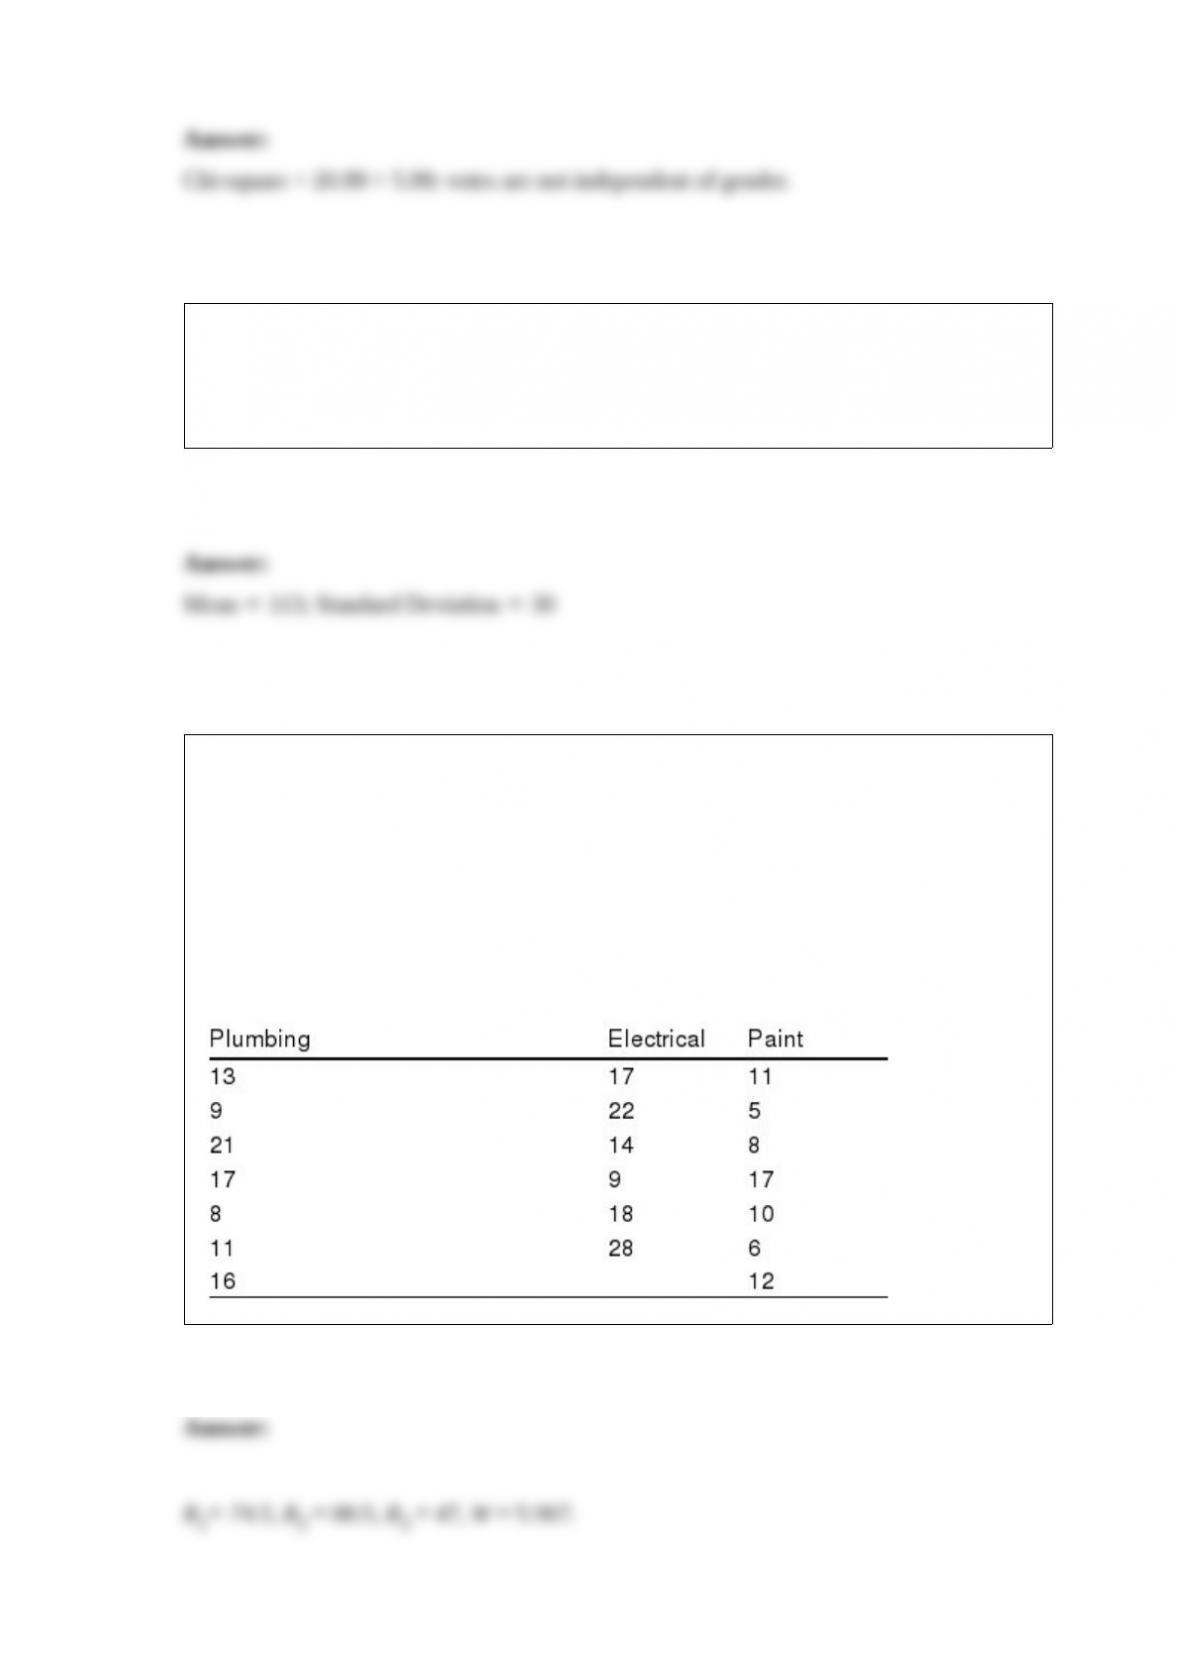
Rebecca Roush, Manager of the Home Square (home improvement) store in Athens,
would like to determine whether an employee’s number of years practicing his/her trade
prior to working in retail is the same for employees in the plumbing, electrical, and
paint departments.
Data on the number of trade-practice years were available for 20 employees and are
listed below. Test whether the three populations are identical in terms of number of
years of trade-practical experience. Use
= .05.

A survey of 40 students at a local college asks, “Where do you buy the majority of your
books?” The responses fell into three categories: “at the campus bookstore,” “on the
Internet,” and “other.” The results follow. Use Excel to estimate the proportion of all of
the college students who buy their books on the Internet.
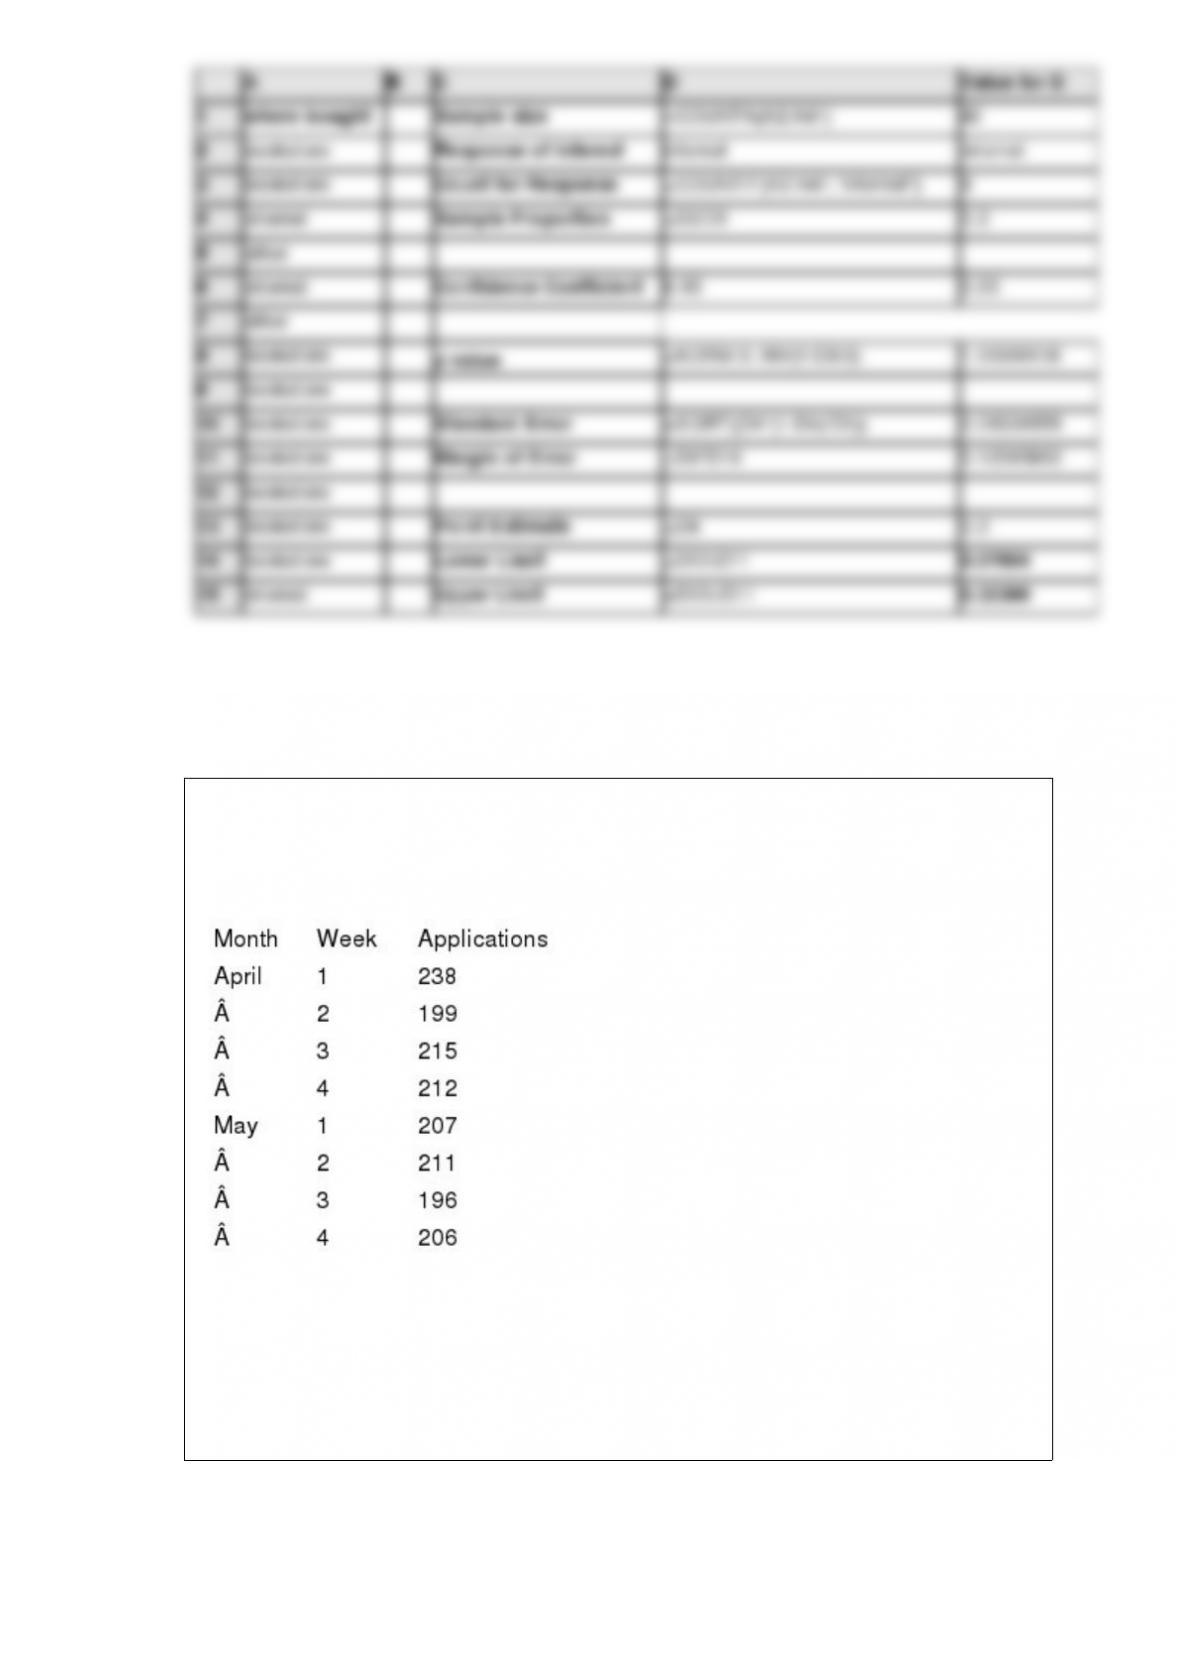
Exhibit 17-5
State Division of Motor Vehicles (DMV) statistics show the rate of new driver’s license
applications to be as shown below:
Refer to Exhibit 17-5. Using weights of .4, .3, .2, and .1, what is the 4-week weighted
moving average forecast for April, week 1?
204.1
210.8
208.4
206.4