
A Type II error is committed when
a. a true alternative hypothesis is mistakenly rejected
b. a true null hypothesis is mistakenly rejected
c. the sample size has been too small
d. not enough information has been available
If a qualitative variable has k levels, the number of dummy variables required is
a. k 1
b. k
c. k + 1
d. 2k
A sample of 30 houses that were sold in the last year was taken. The value of the house
(y) was estimated. The independent variables included in the analysis were the number
of rooms (x1), the size of the lot (x2), the number of bathrooms (x3), and a dummy
variable (x4), which equals 1 if the house has a garage and equals 0 if the house does
not have a garage. The following results were obtained:
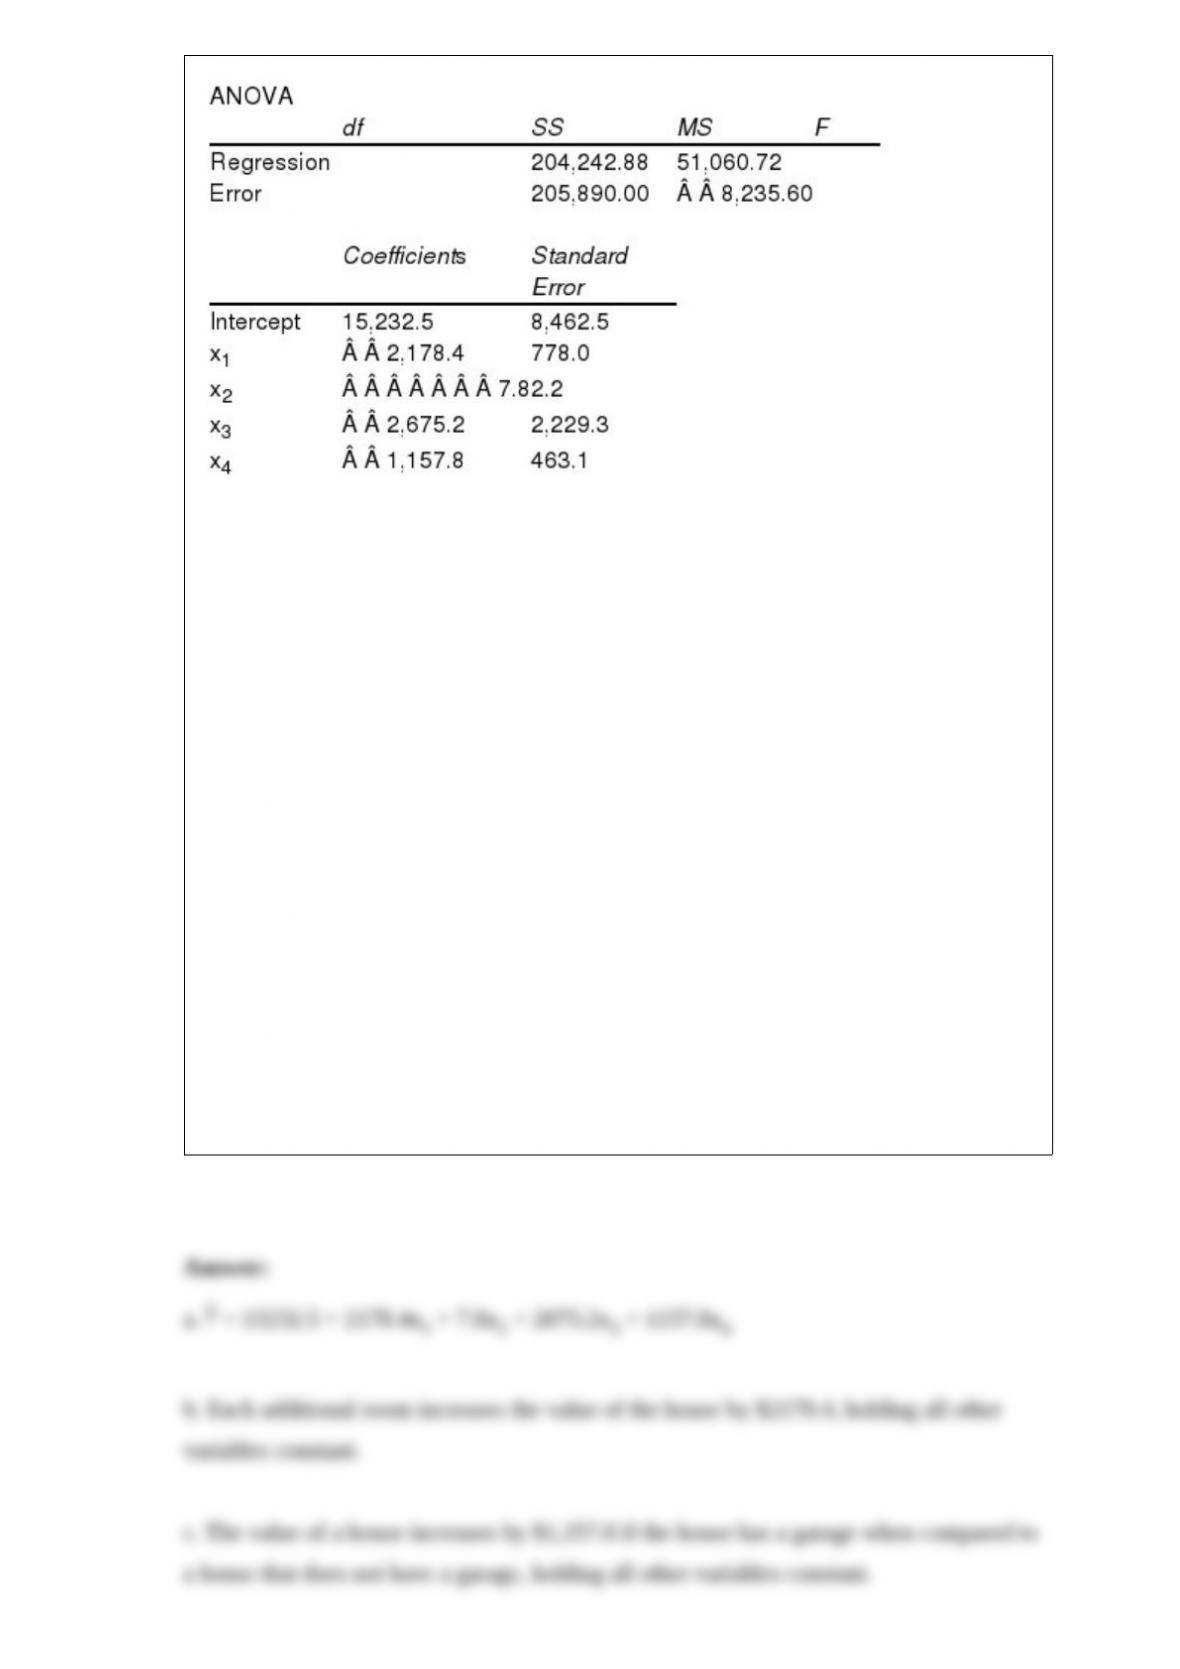
a. Write out the estimated equation.
b. Interpret the coefficient on the number of rooms (x1).
c. Interpret the coefficient on the dummy variable (x4).
d. What are the degrees of freedom for the sum of squares explained by the regression
(SSR) and the sum of squares due to error (SSE)?
e. Test whether or not there is a significant relationship between the value of a house
and the independent variables. Use a .05 level of significance. Be sure to state the null
and alternative hypotheses.
f. Test the significance of 1 at the 5% level. Be sure to state the null and alternative
hypotheses.
g. Compute the coefficient of determination and interpret its meaning.
h. Estimate the value of a house that has 9 rooms, a lot with an area of 7,500, 2
bathrooms, and a garage.
A graphical device for presenting categorical data summaries based on subdivision of a
circle into sectors that correspond to the relative frequency for each class is a
a. histogram
b. stem-and-leaf display
c. pie chart
d. bar chart
The time it takes to hand carve a guitar neck is uniformly distributed between 110 and
190 minutes.
a. What is the probability that a guitar neck can be carved between 95 and 165 minutes?
b. What is the probability that the guitar neck can be carved between 120 and 200
minutes?
c. Determine the expected completion time for carving the guitar neck.
d. Compute the standard deviation.
The symbol
2 is used to represent the
a. variance of the population
b. standard deviation of the sample
c. standard deviation of the population
d. None of the other answers are correct.
Exhibit 8-2
The manager of a grocery store has taken a random sample of 100 customers. The
average length of time it took these 100 customers to check out was 3.0 minutes. It is
known that the standard deviation of the checkout time is one minute.
Refer to Exhibit 8-2. If the confidence coefficient is reduced to 0.80, the standard error
of the mean
a. will increase
b. will decrease
c. remains unchanged
d. becomes negative
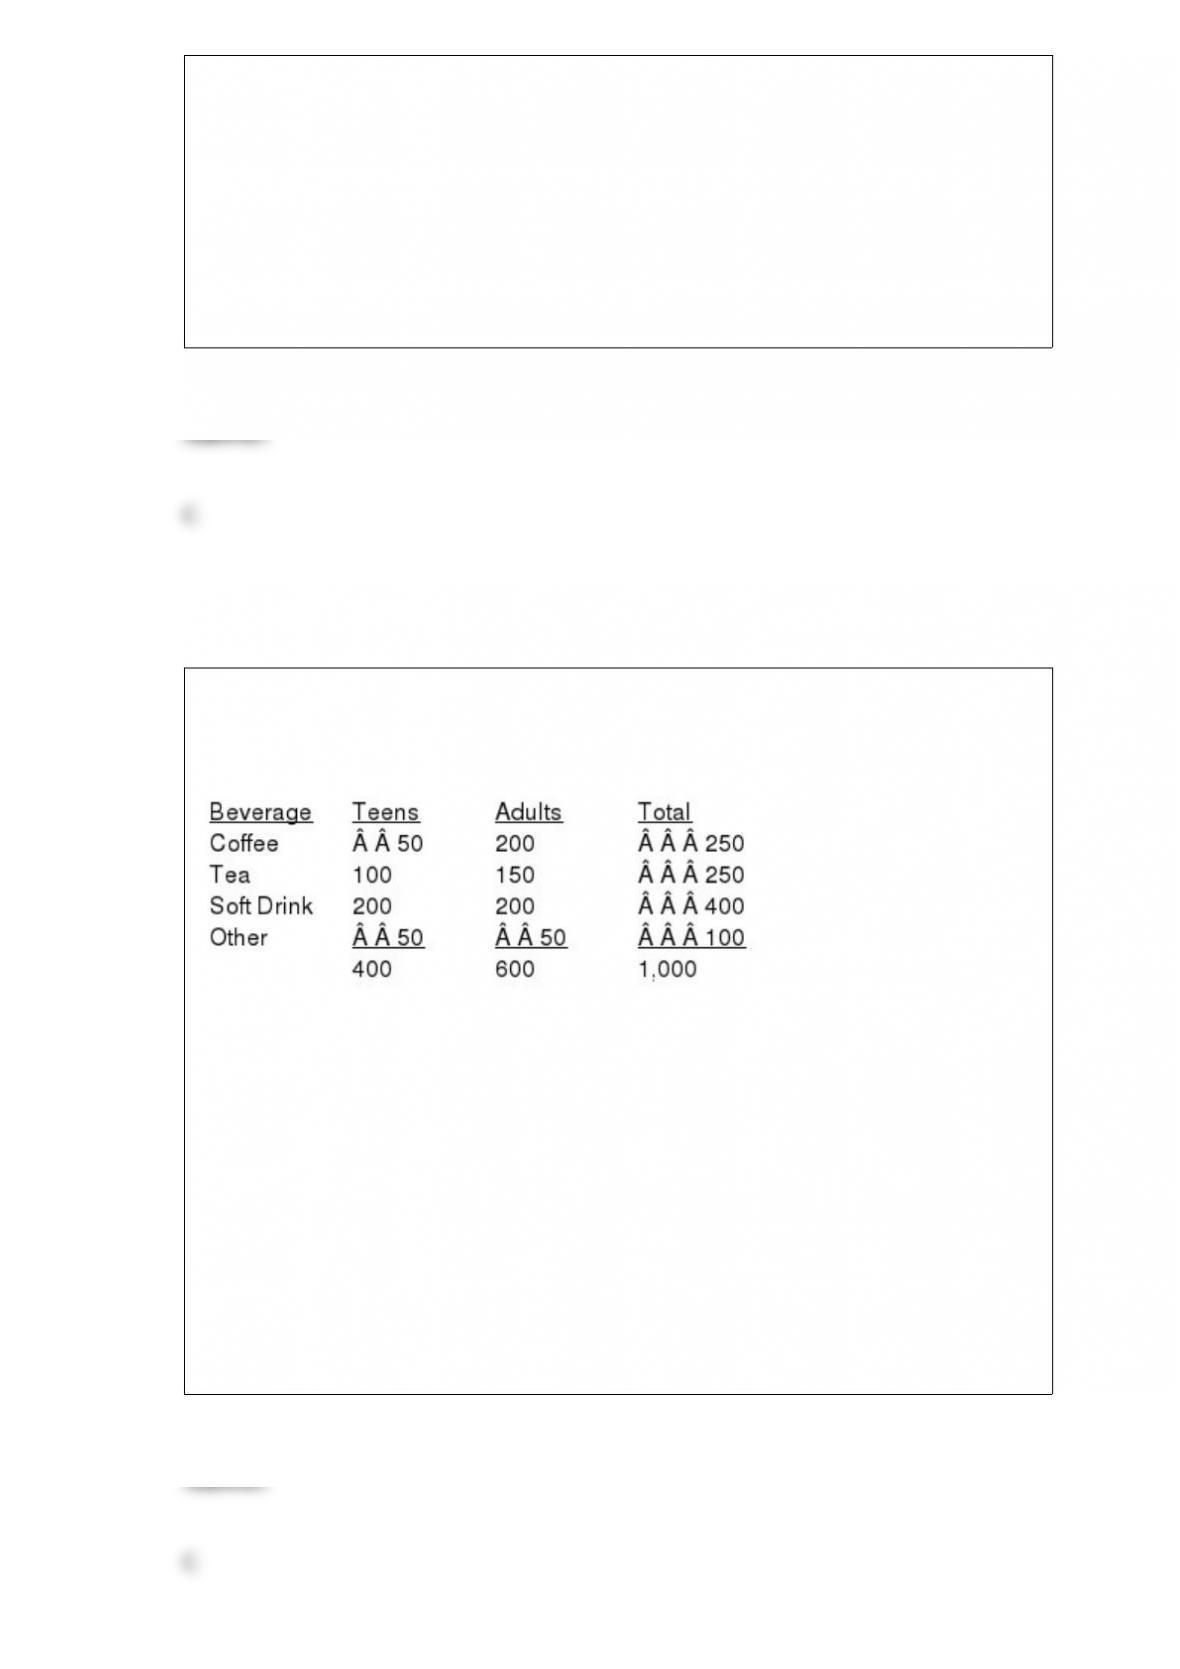
Exhibit 12-5
The table below gives beverage preferences for random samples of teens and adults.
We are asked to test for independence between age (i.e., adult and teen) and drink
preferences.
Refer to Exhibit 12-5. The calculated value for this test for independence is
a. 0
b. 8.4
c. 62.5
d. 82.5
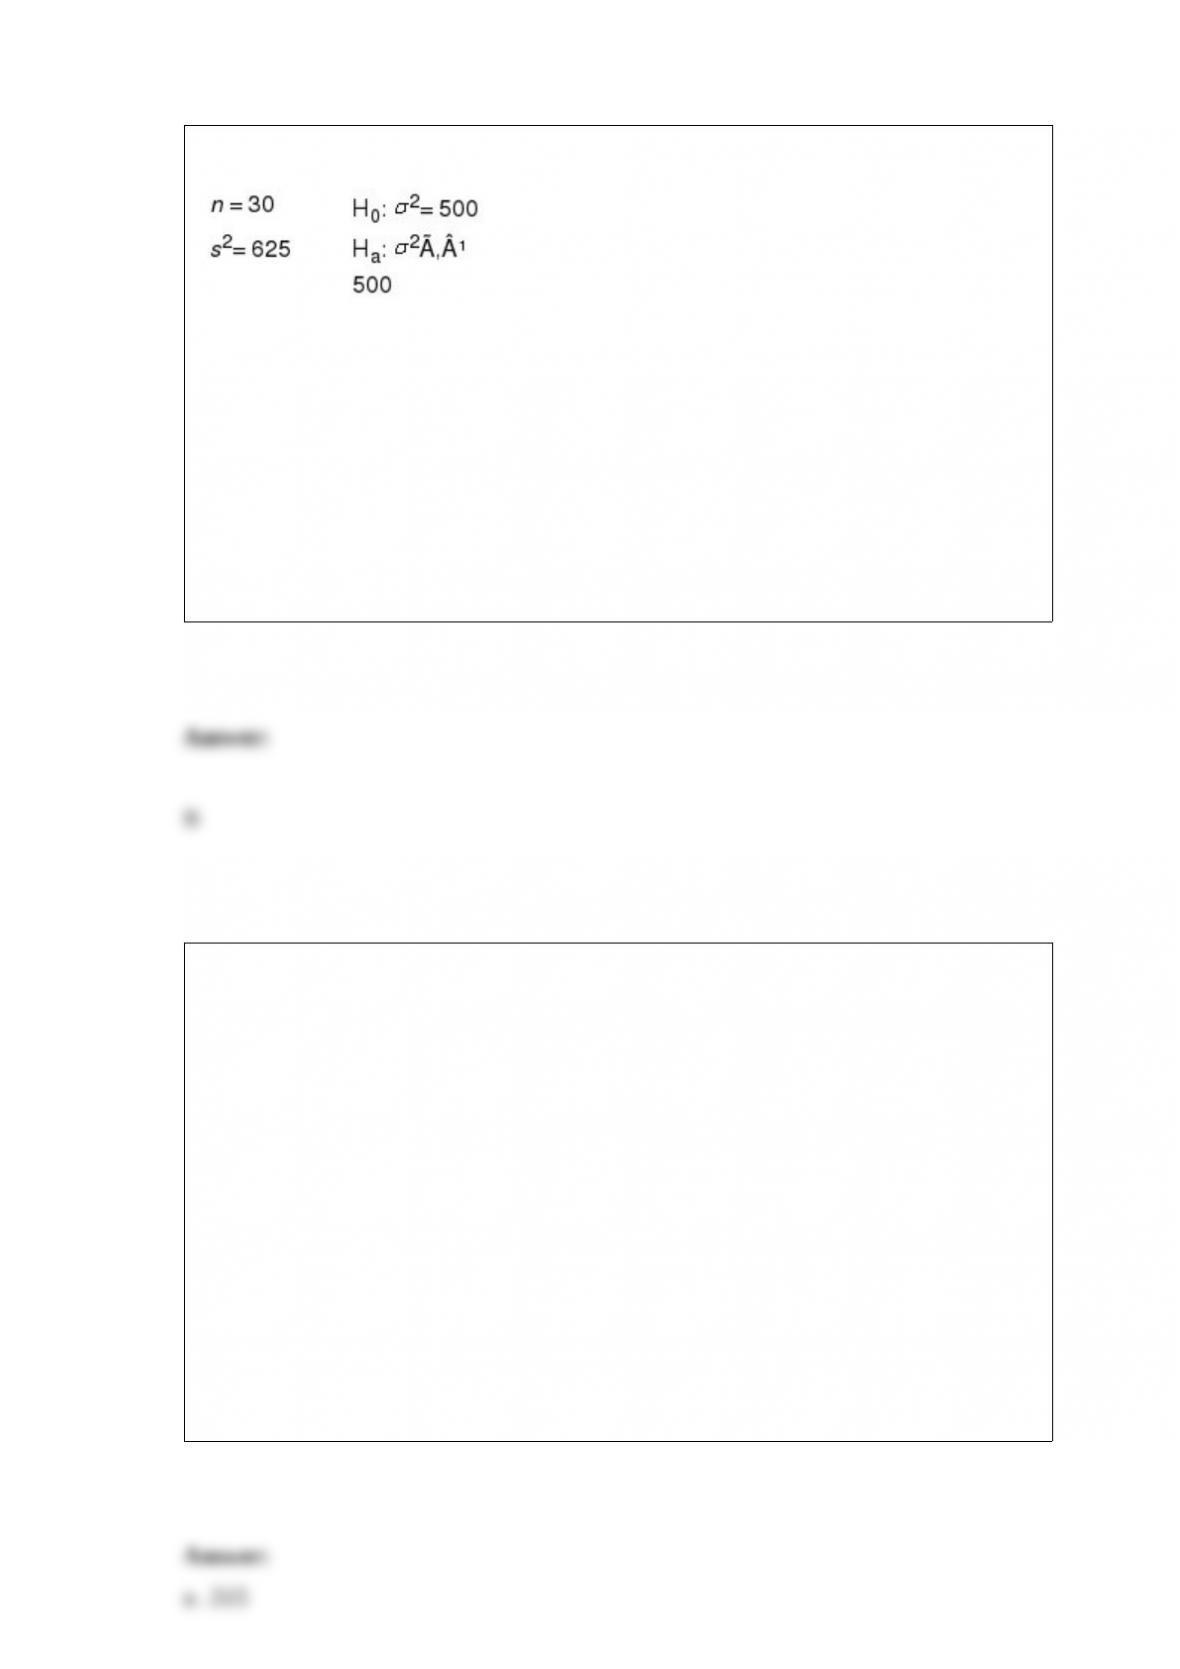
Exhibit 11-4
Refer to Exhibit 11-4. The null hypothesis
a. should be rejected
b. should not be rejected
c. should be revised
d. None of these alternatives is correct.
An accounting firm has noticed that of the companies it audits, 85% show no inventory
shortages, 10% show small inventory shortages and 5% show large inventory shortages.
The firm has devised a new accounting test for which it believes the following
probabilities hold:
P(company will pass test | no shortage) = .90
P(company will pass test | small shortage) = .50
P(company will pass test | large shortage) = .20
a. If a company being audited fails this test, what is the probability of a large or small
inventory shortage?
b. If a company being audited passes this test, what is the probability of no inventory
shortage?

If A and B are mutually exclusive events with P(A) 0.3 and P(B) 0.5, then P(A
B)
a. 0.00
b. 0.15
c. 0.8
d. 0.2
Z is a standard normal random variable. The P(z 2.11) equals
a. 0.4821
b. 0.9821
c. 0.5
d. 0.0174
Exhibit 9-6

A random sample of 100 people was taken. Eighty of the people in the sample favored
Candidate A. We are interested in determining whether or not the proportion of the
population in favor of Candidate A is significantly more than 75%.
Refer to Exhibit 9-6. The test statistic is
a. 0.80
b. 0.05
c. 1.25
d. 2.00
Exhibit 11-3
The contents of a sample of 26 cans of apple juice showed a standard deviation of 0.06
ounces. We are interested in testing to determine whether the variance of the population
is significantly more than 0.003.
Refer to Exhibit 11-3. The p-value for this test is
a. 0.05
b. greater than 0.10
c. less than 0.10
d. 1.96
If the variance of a data set is correctly computed with the formula using n 1 in the
denominator, which of the following is true?
a. the data set is a sample
b. the data set is a population
c. the data set could be either a sample or a population
d. the data set is from a census
The t distribution is a family of similar probability distributions, with each individual
distribution depending on a parameter known as the
a. finite correction factor
b. sample size
c. degrees of freedom
d. standard deviation
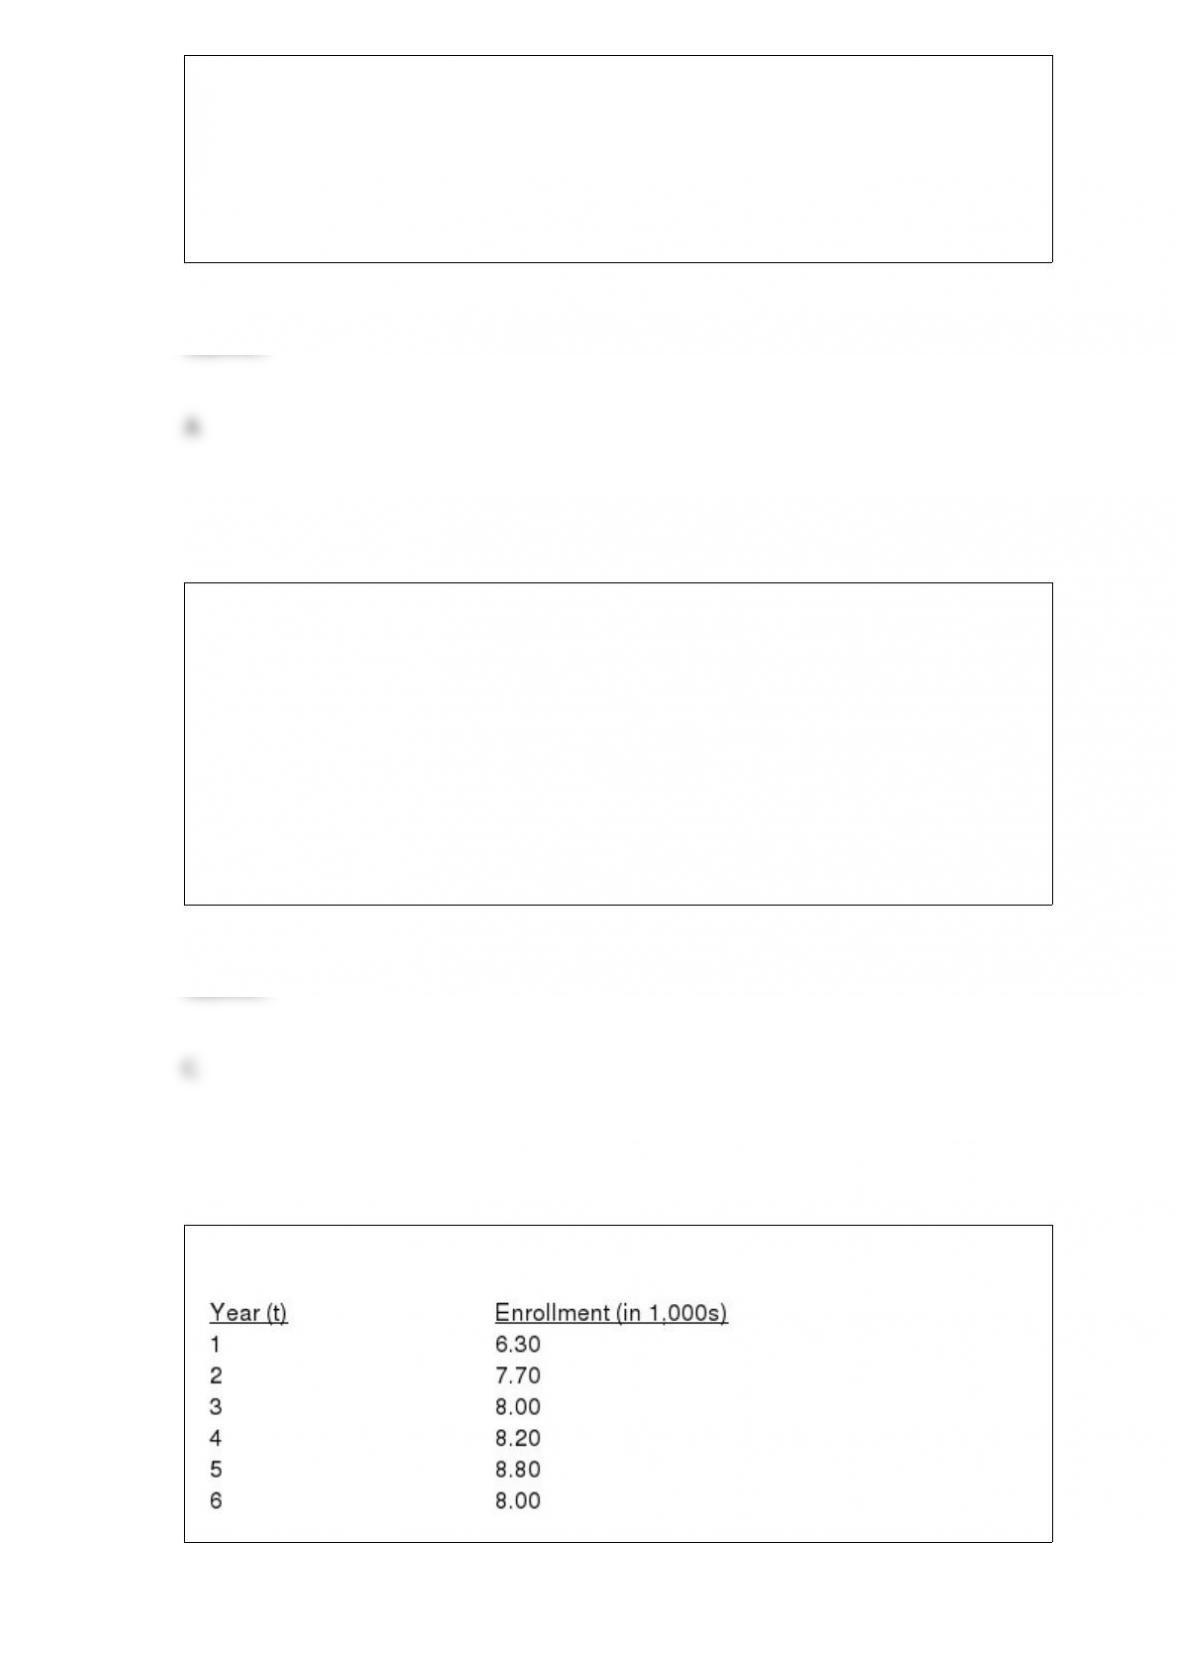
Student enrollment at a university over the past six years is given below.
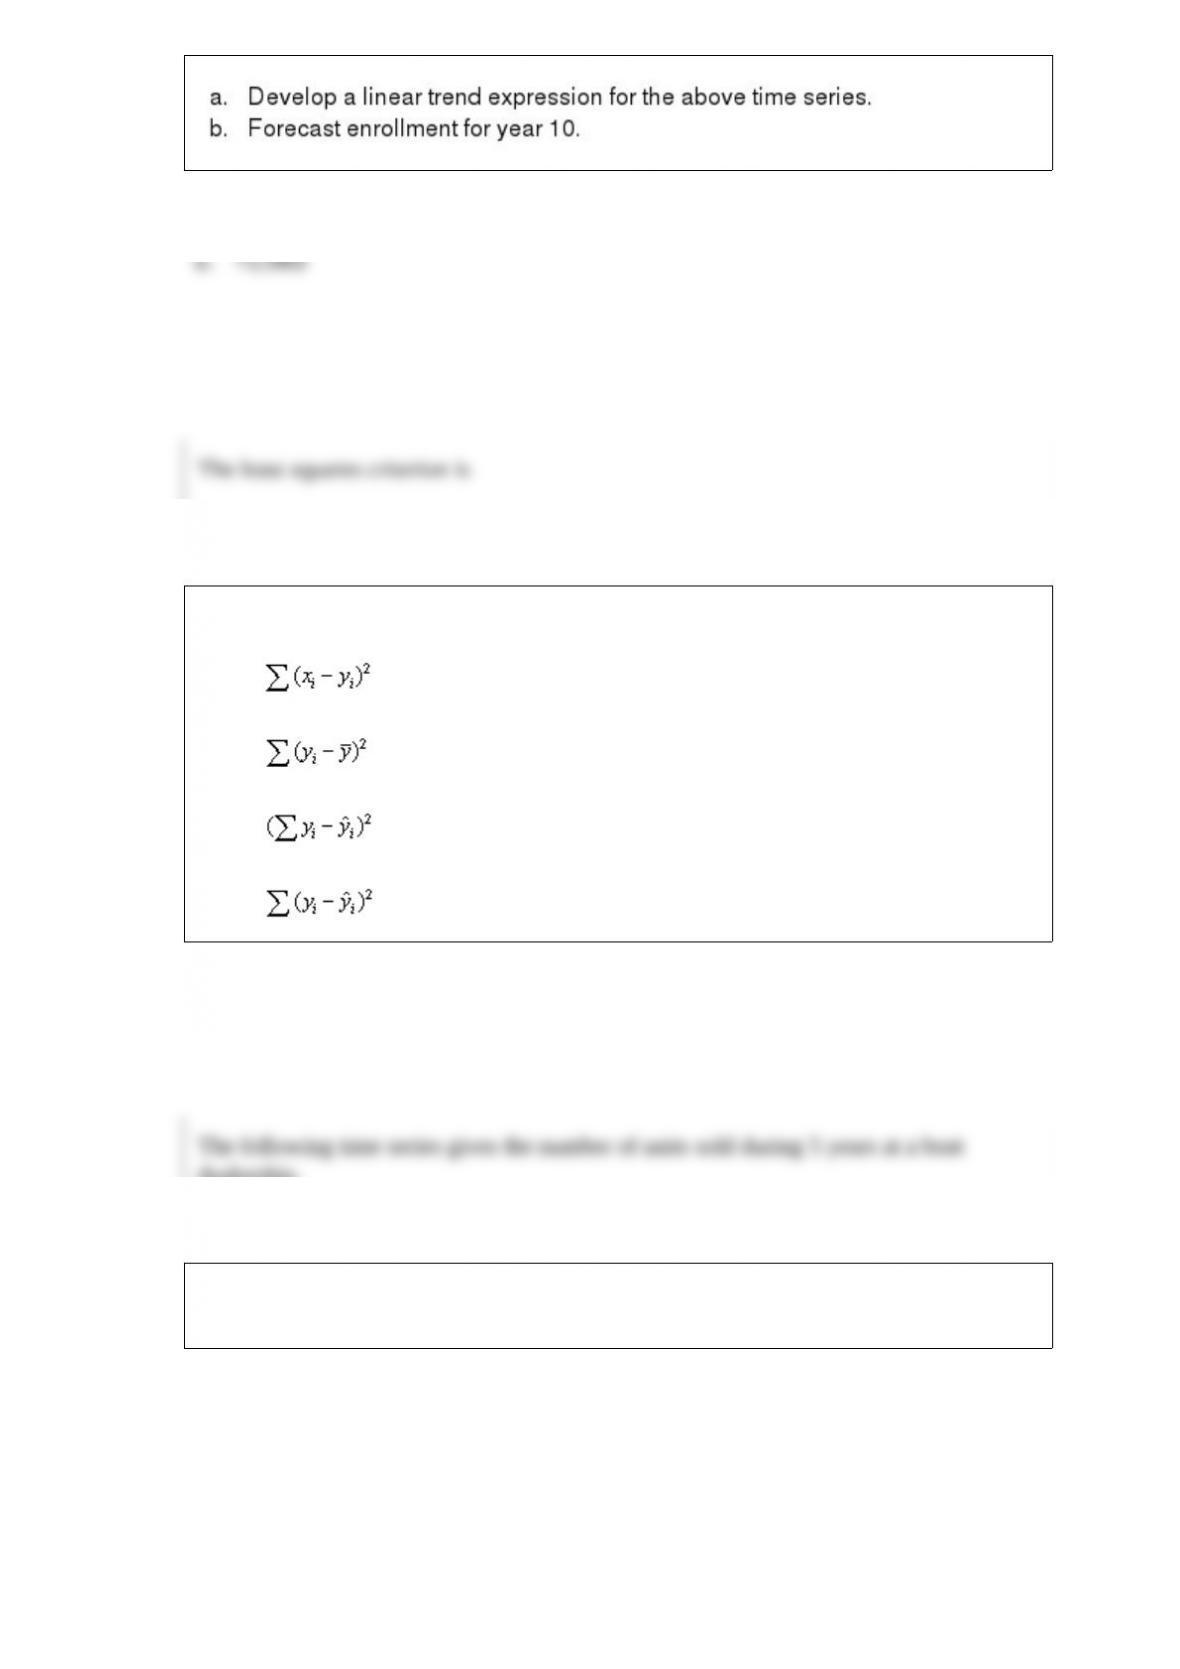
The least squares criterion is
a. min
b. min
c. min
d. min
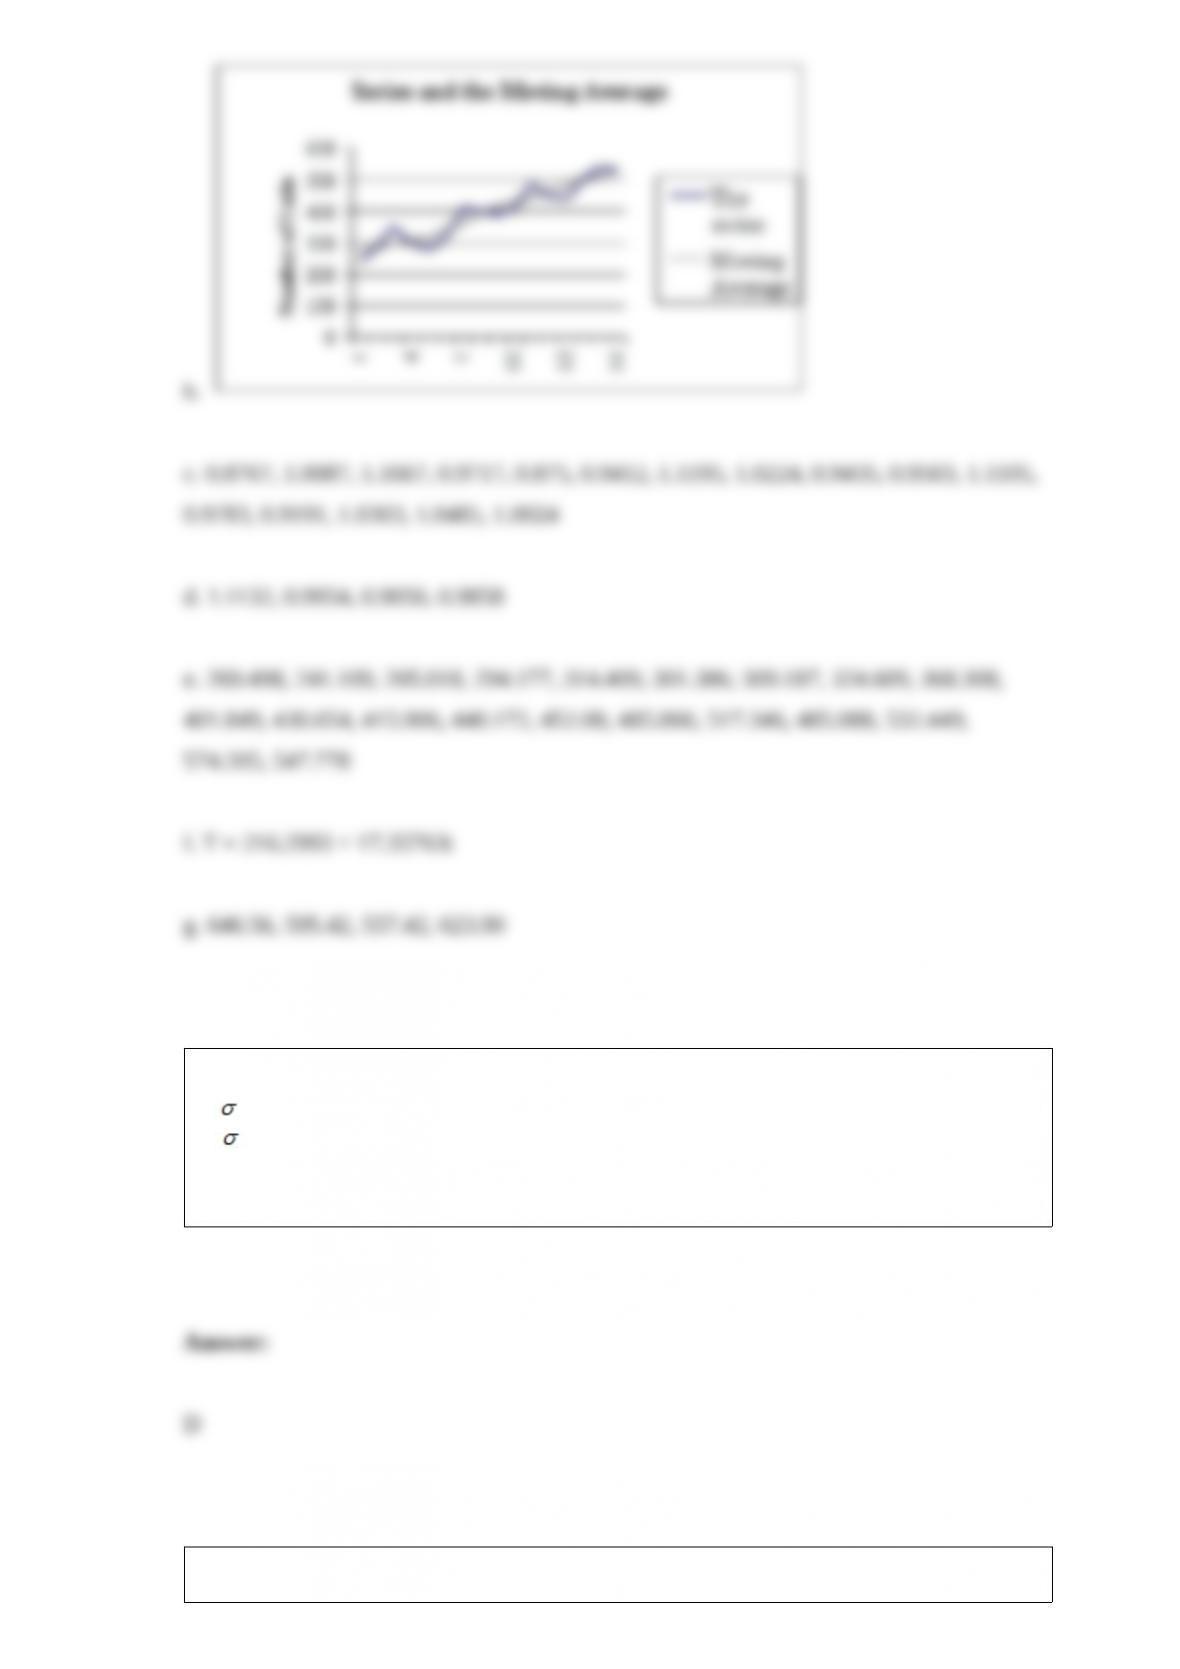
The following time series gives the number of units sold during 5 years at a boat
dealership.
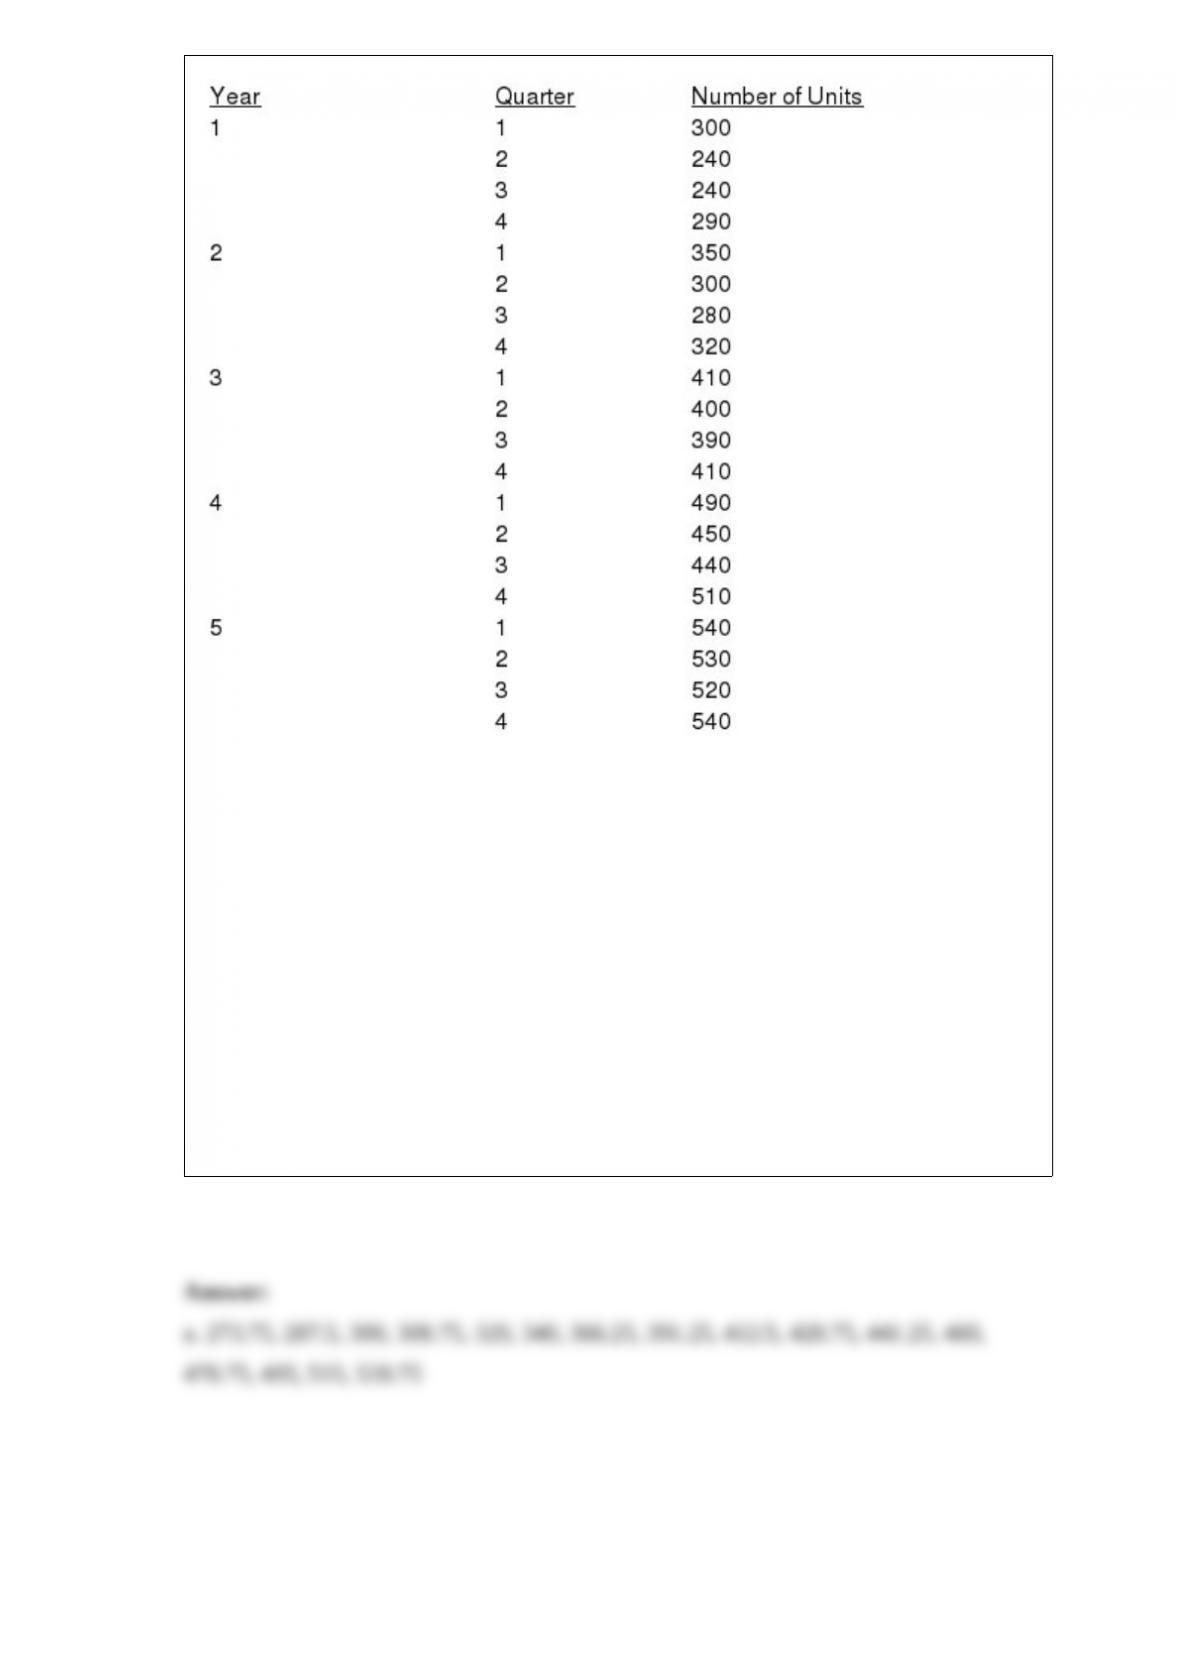
a. Find the four-quarter centered moving averages.
b. Plot the series and the moving averages on a graph.
c. Compute the seasonal-irregular component.
d. Compute the seasonal factors for all four quarters.
e. Compute the deseasonalized time series for sales.
f. Calculate the linear trend from the deseasonalized sales.
g. Forecast the number of units sold in each quarter of year 6.
Which of the following symbols represents the size of the sample?
a. 2
b.
c. N
d. n
A graphical device used for enumerating sample points in a multiple-step experiment is

a
a. bar chart
b. pie chart
c. histogram
d. None of the other answers is correct.
If A and B are independent events with P(A) 0.38 and P(B) 0.55, then P(AB)
a. 0.209
b. 0.000
c. 0.550
d. None of the other answers is correct.
Which of the following is NOT an example of a firm that sells or leases business
database services to clients?
a. Dun & Bradstreet
b. Bloomberg
c. U. S. Census Bureau
d. All of these answers are examples of firms that sell or lease business database
services to clients.
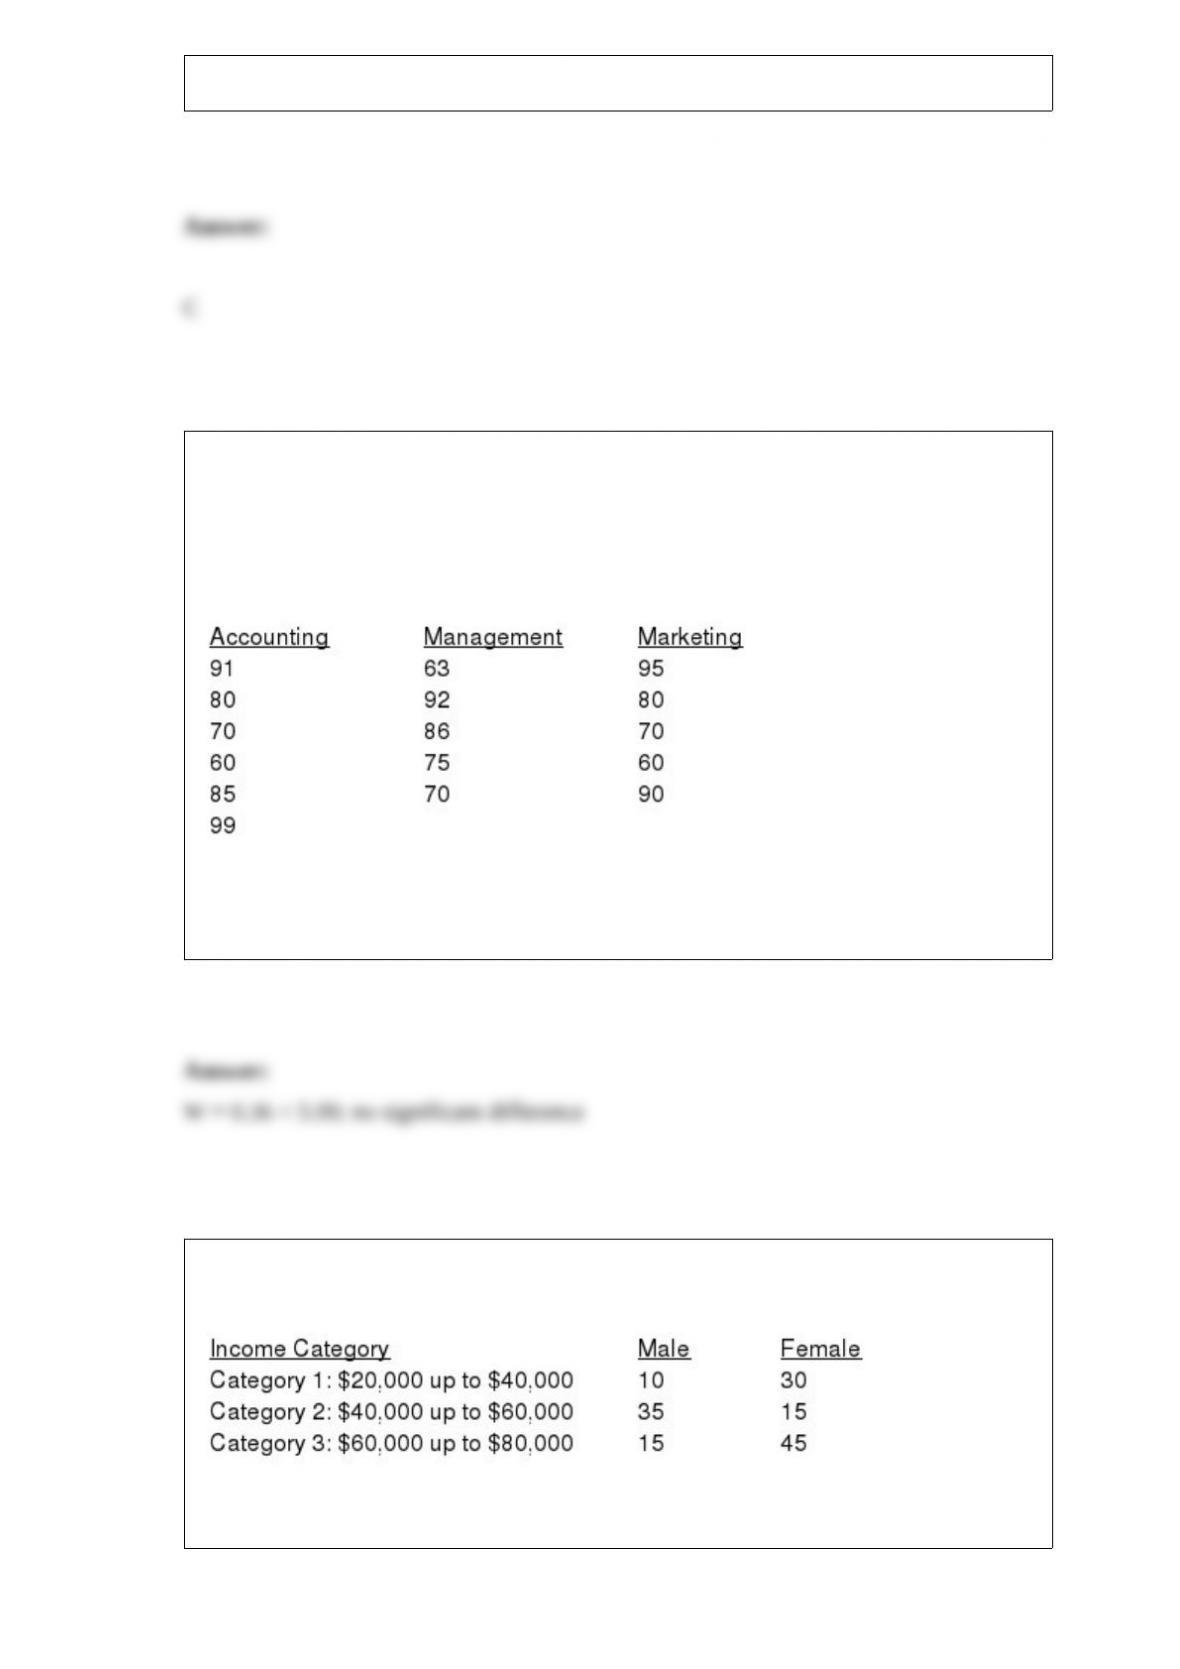
A comprehensive statistics examination is given to 16 students in order to determine
whether or not there is a significant difference in the performance of students majoring
in the various disciplines of Business Administration. The following data show the
scores of the 16 students (5 majoring in accounting, 6 majoring in management, and 5
majoring in marketing).
At = 0.05 level of significance, test to see if there is a significant difference in the
performance of the students in the three majors.
A sample of 150 individuals (males and females) was surveyed, and the individuals
were asked to indicate their yearly incomes. The results of the survey are shown below.
Test at = 0.05 to determine if the yearly income is independent of the gender.
If we are testing for the equality of 3 population means, we should use the
a. test statistic F
b. test statistic t
c. test statistic z
d. test statistic
2
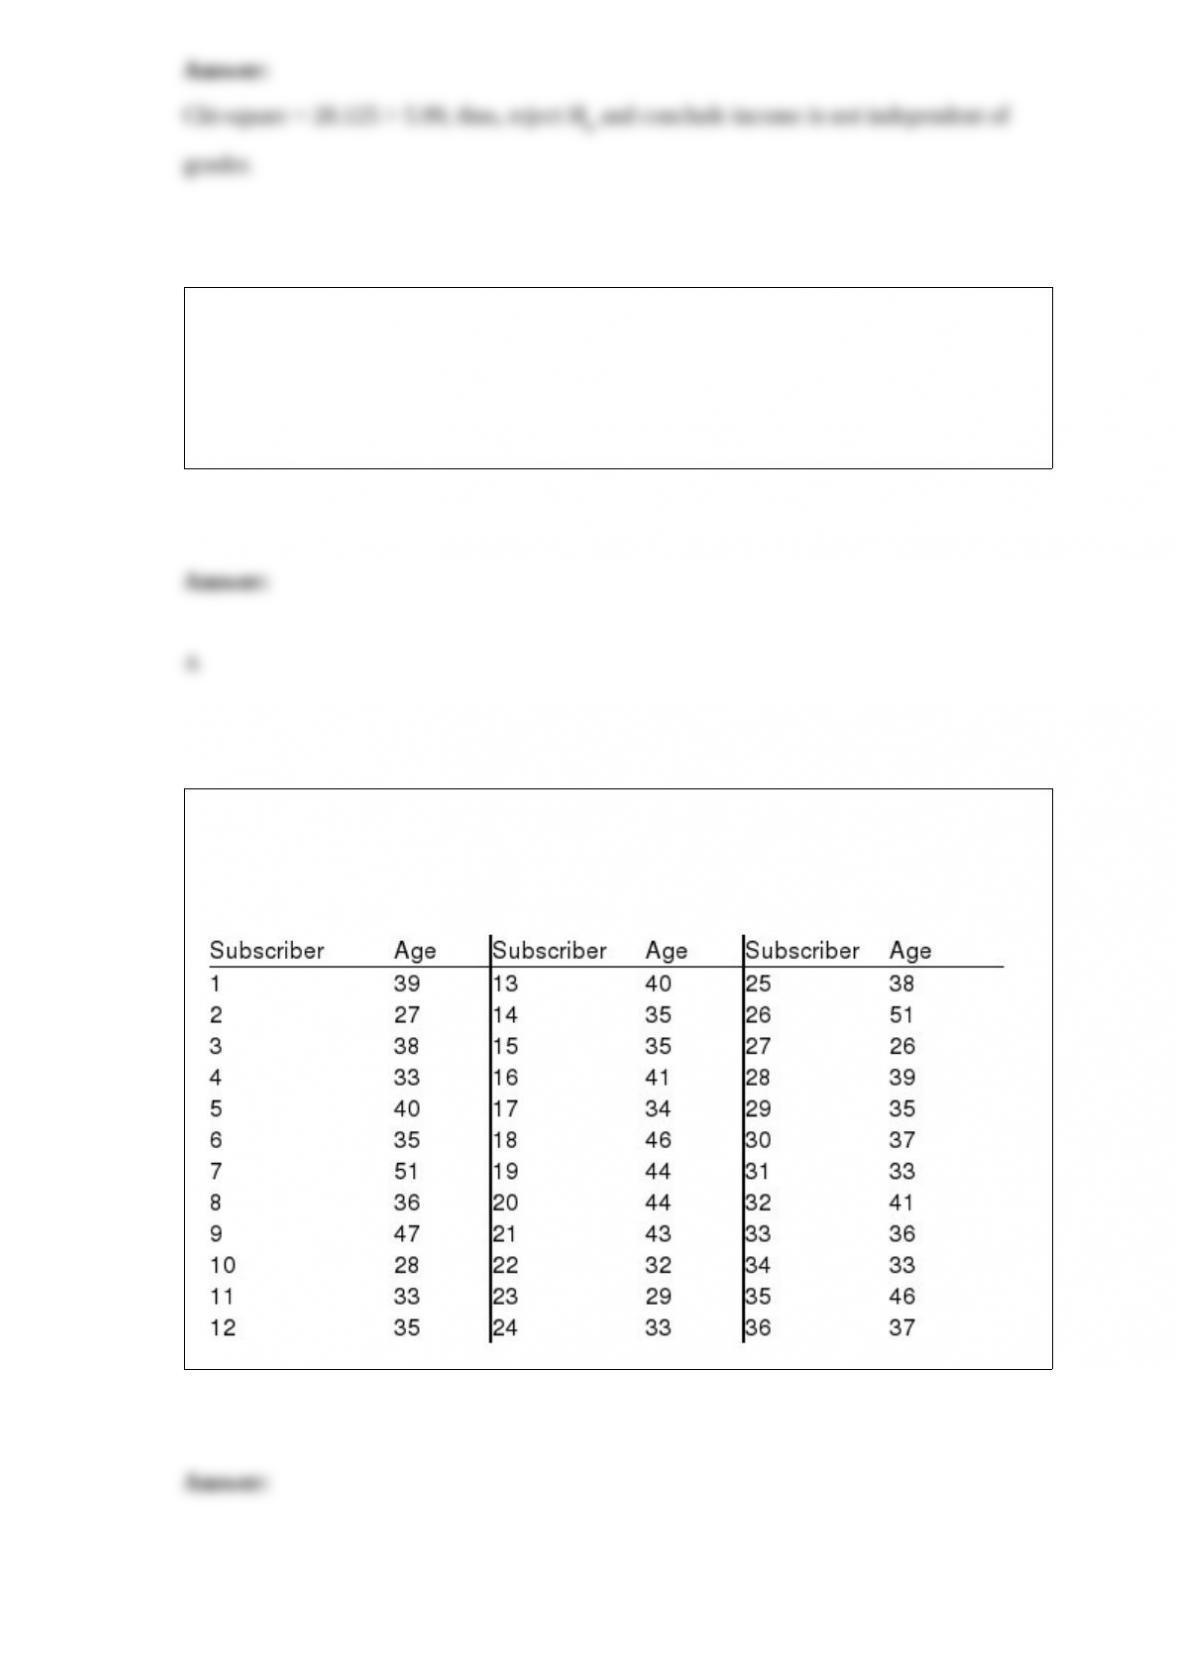
A random sample of 36 magazine subscribers is taken to estimate the mean age of all
subscribers. The data follow. Use Excel to construct a 90% confidence interval estimate
of the mean age of all of this magazine’s subscribers.
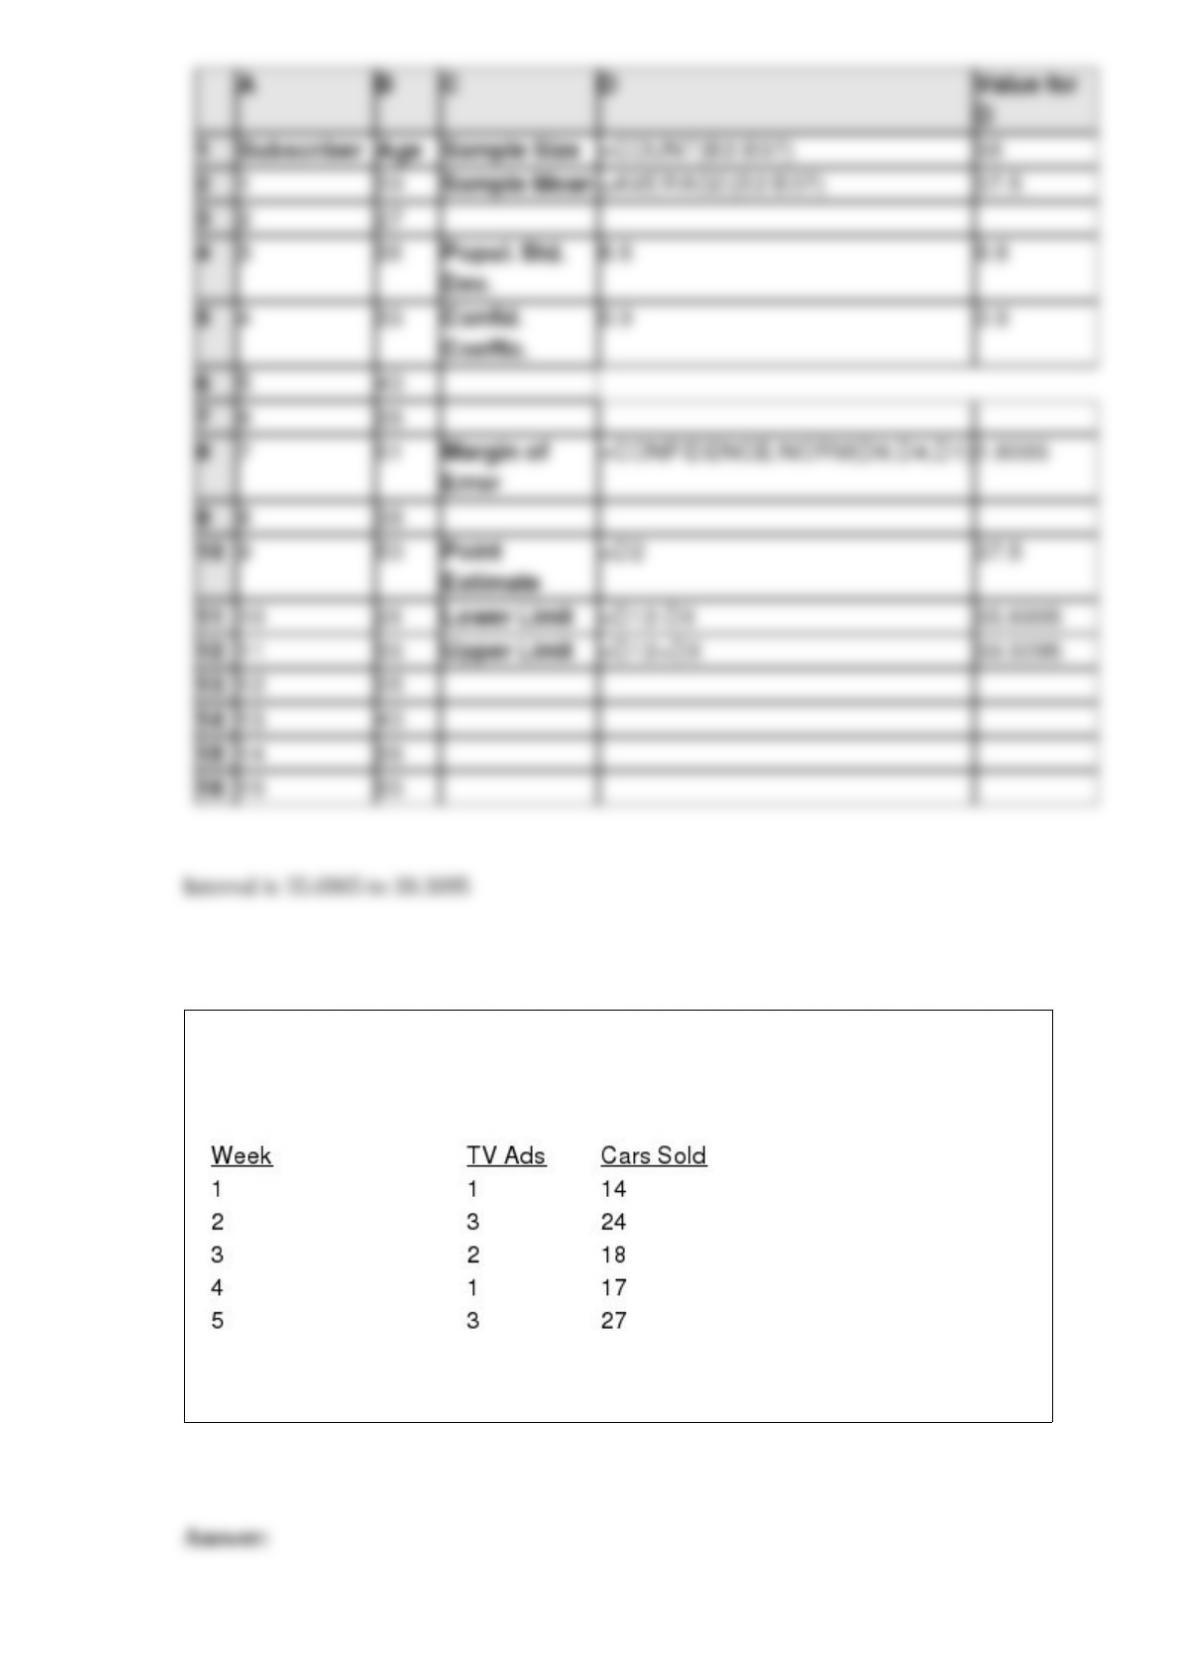
Reed Auto periodically has a special week-long sale. As part of the advertising
campaign Reed runs one or more television commercials during the weekend preceding
the sale. Data from a sample of 5 previous sales are shown below.
Compute and interpret both the sample covariance and the sample correlation
coefficient.
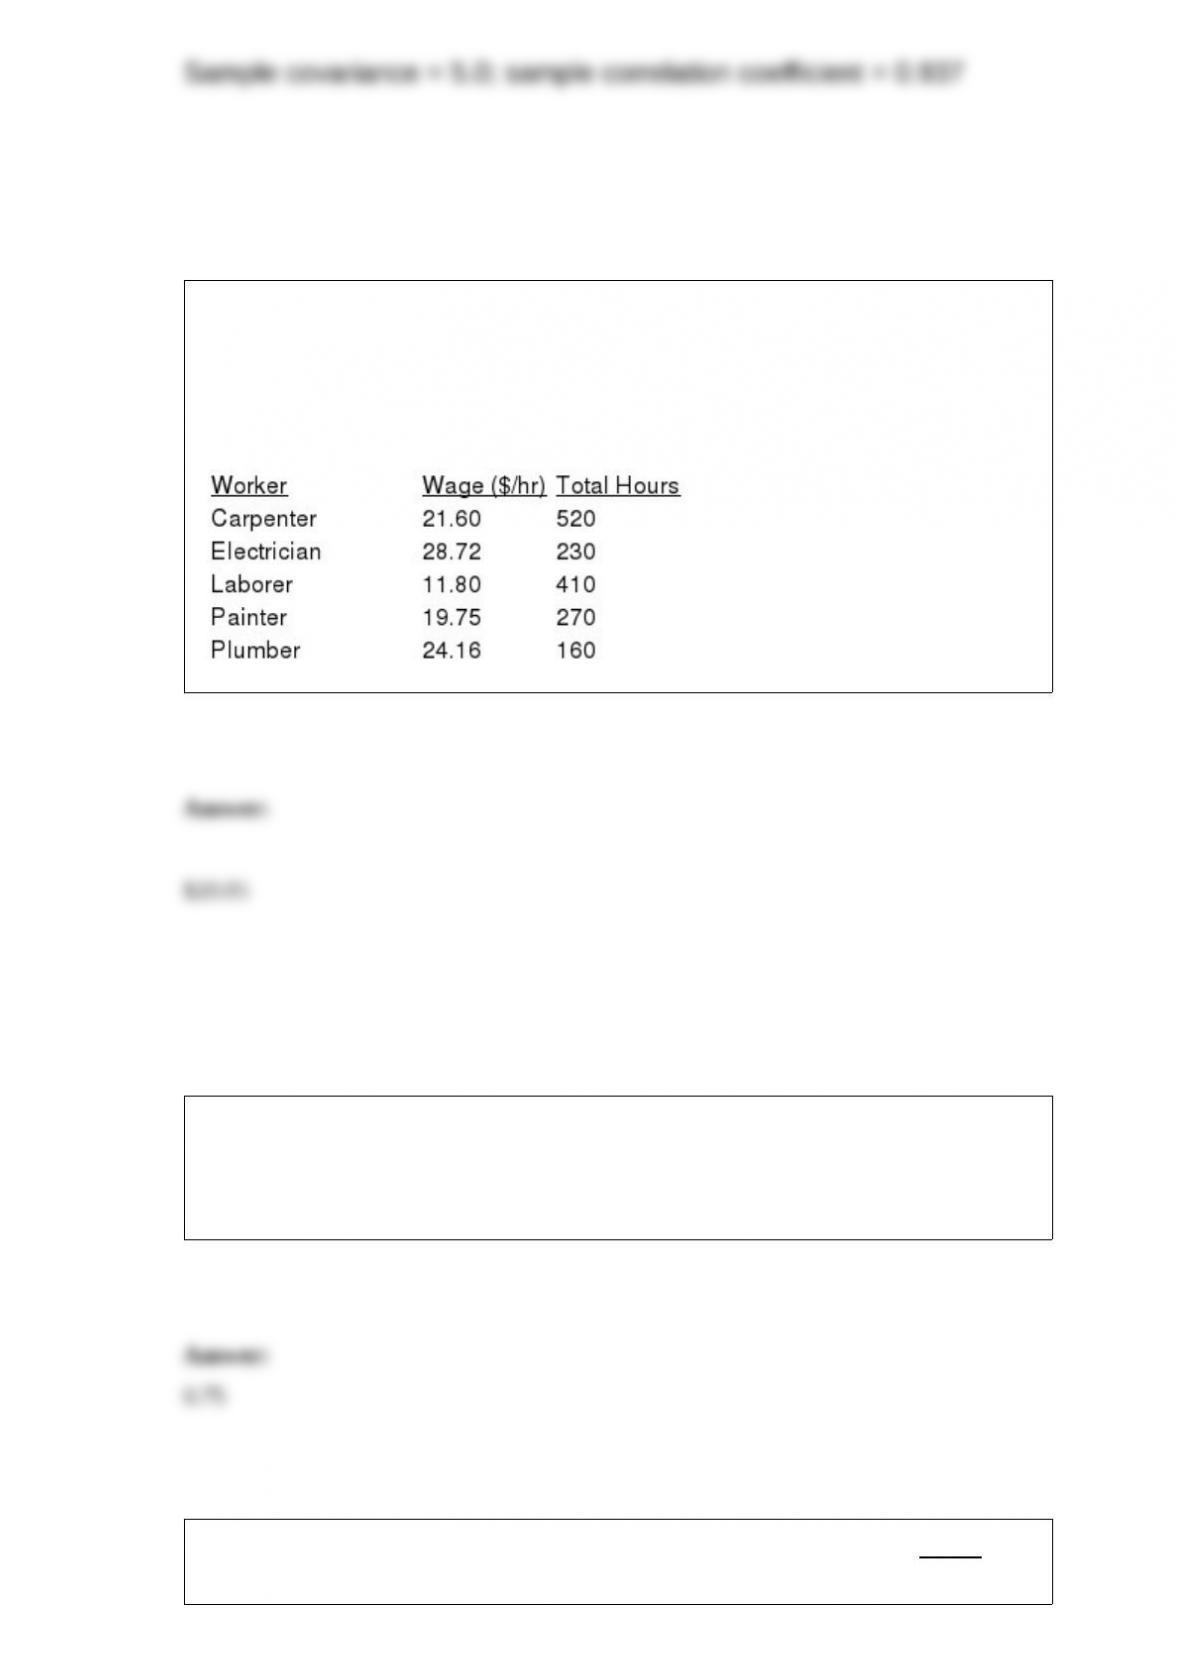
Ron Butler, a custom home builder, is looking over the expenses he incurred for a house
he just completed constructing. For the purpose of pricing future construction projects,
he would like to know the average wage ($/hour) he paid the workers he employed.
Listed below are the categories of worker he employed, along with their respective
wage and total hours worked. What is the average wage ($/hour) he paid the workers?
In a city, 60% of the residents live in houses and 40% of the residents live in
apartments. Of the people who live in houses, 20% own their own business. Of the
people who live in apartments, 10% own their own business. If a person owns his or her
own business, find the probability that he or she lives in a house.
46. The properties of a multinomial experiment include all of the following except
a. the experiment consists of a sequence of n identical trials

b. three or more outcomes are possible on each trial
c. the probability of each outcome can change from trial to trial
d. the trials are independent