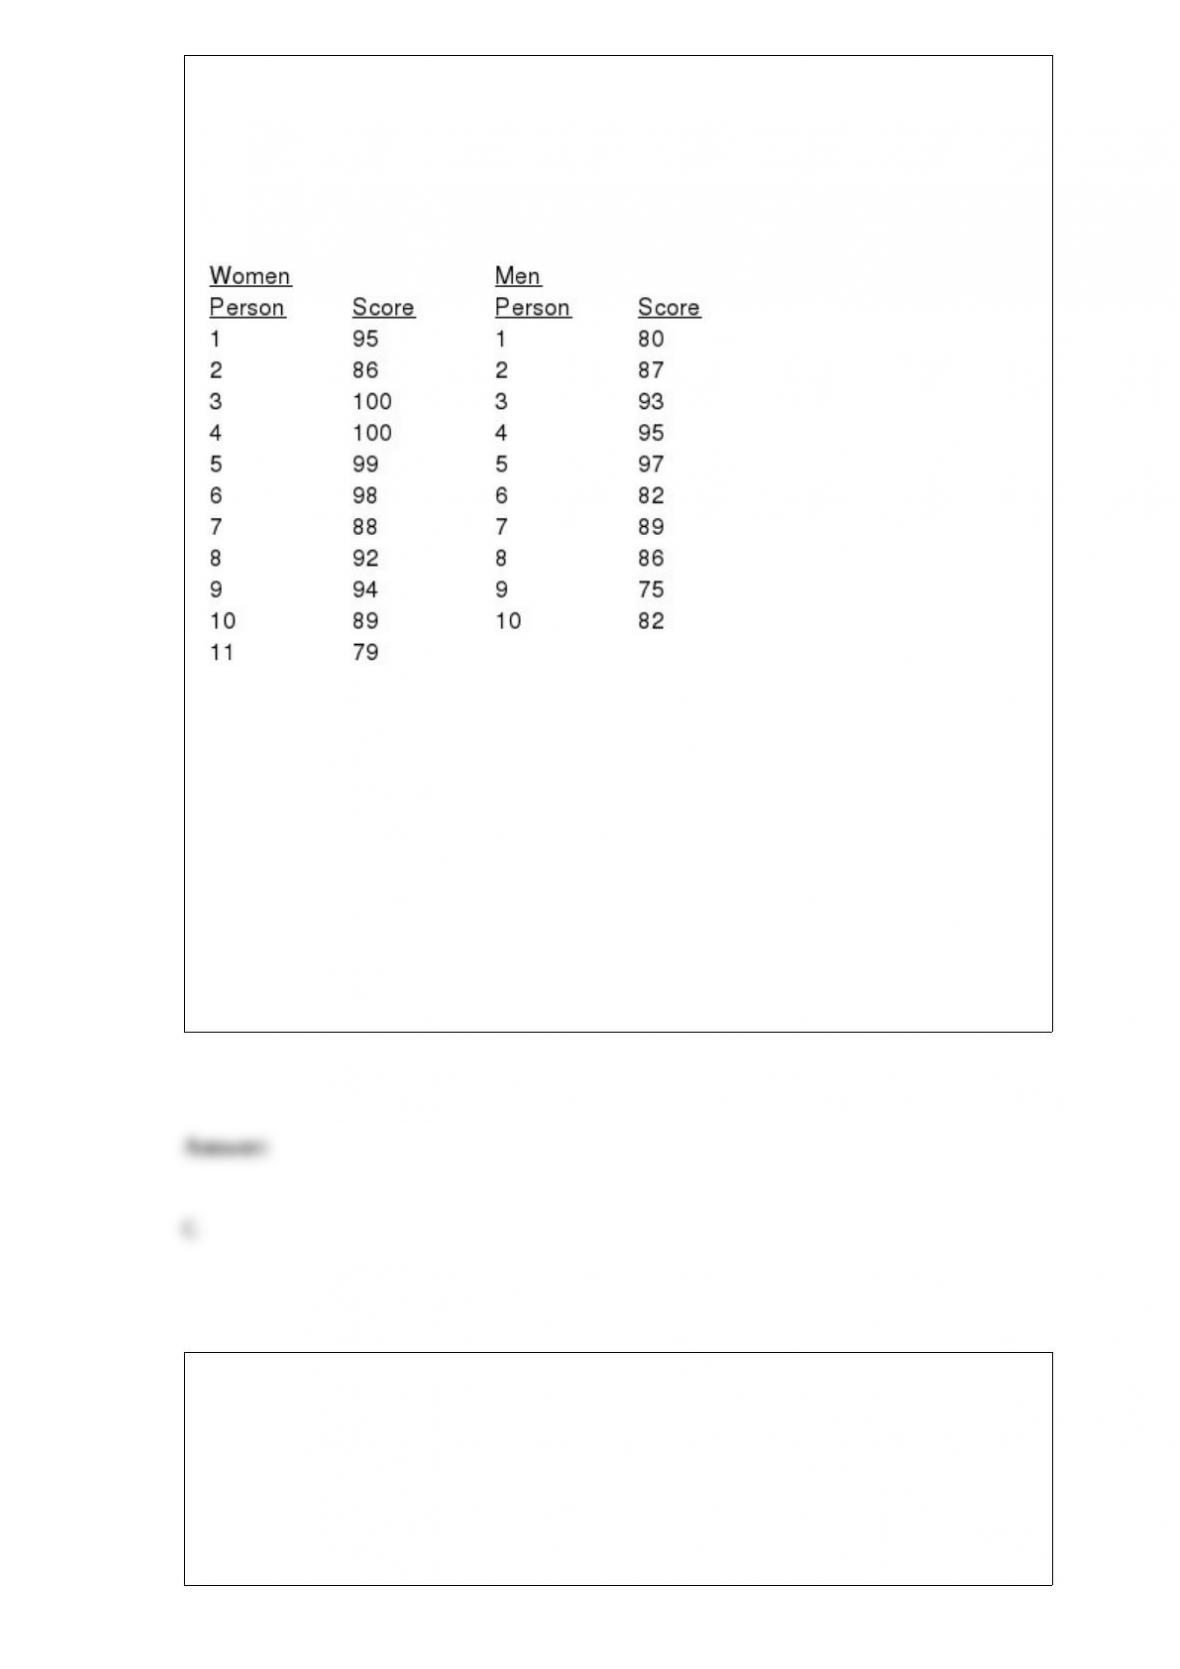
Exhibit 18-4
It has been hypothesized that there is no difference in the mathematical accuracy of men
and women. A sample of men and women were given math tests. The scores on the tests
are given below.
Refer to Exhibit 18-4. Calculate a Spearman rank-correlation coefficient for 20 pairs of
data when di
2 = 50.
a. 0.0063
b. 0.0376
c. 0.9624
d. 0.9937
A regression analysis involved 17 independent variables and 697 observations. The
critical value of t for testing the significance of each of the independent variable’s
coefficients will have
a. 696 degrees of freedom
b. 16 degrees of freedom
c. 713 degrees of freedom
d. 714 degrees of freedom
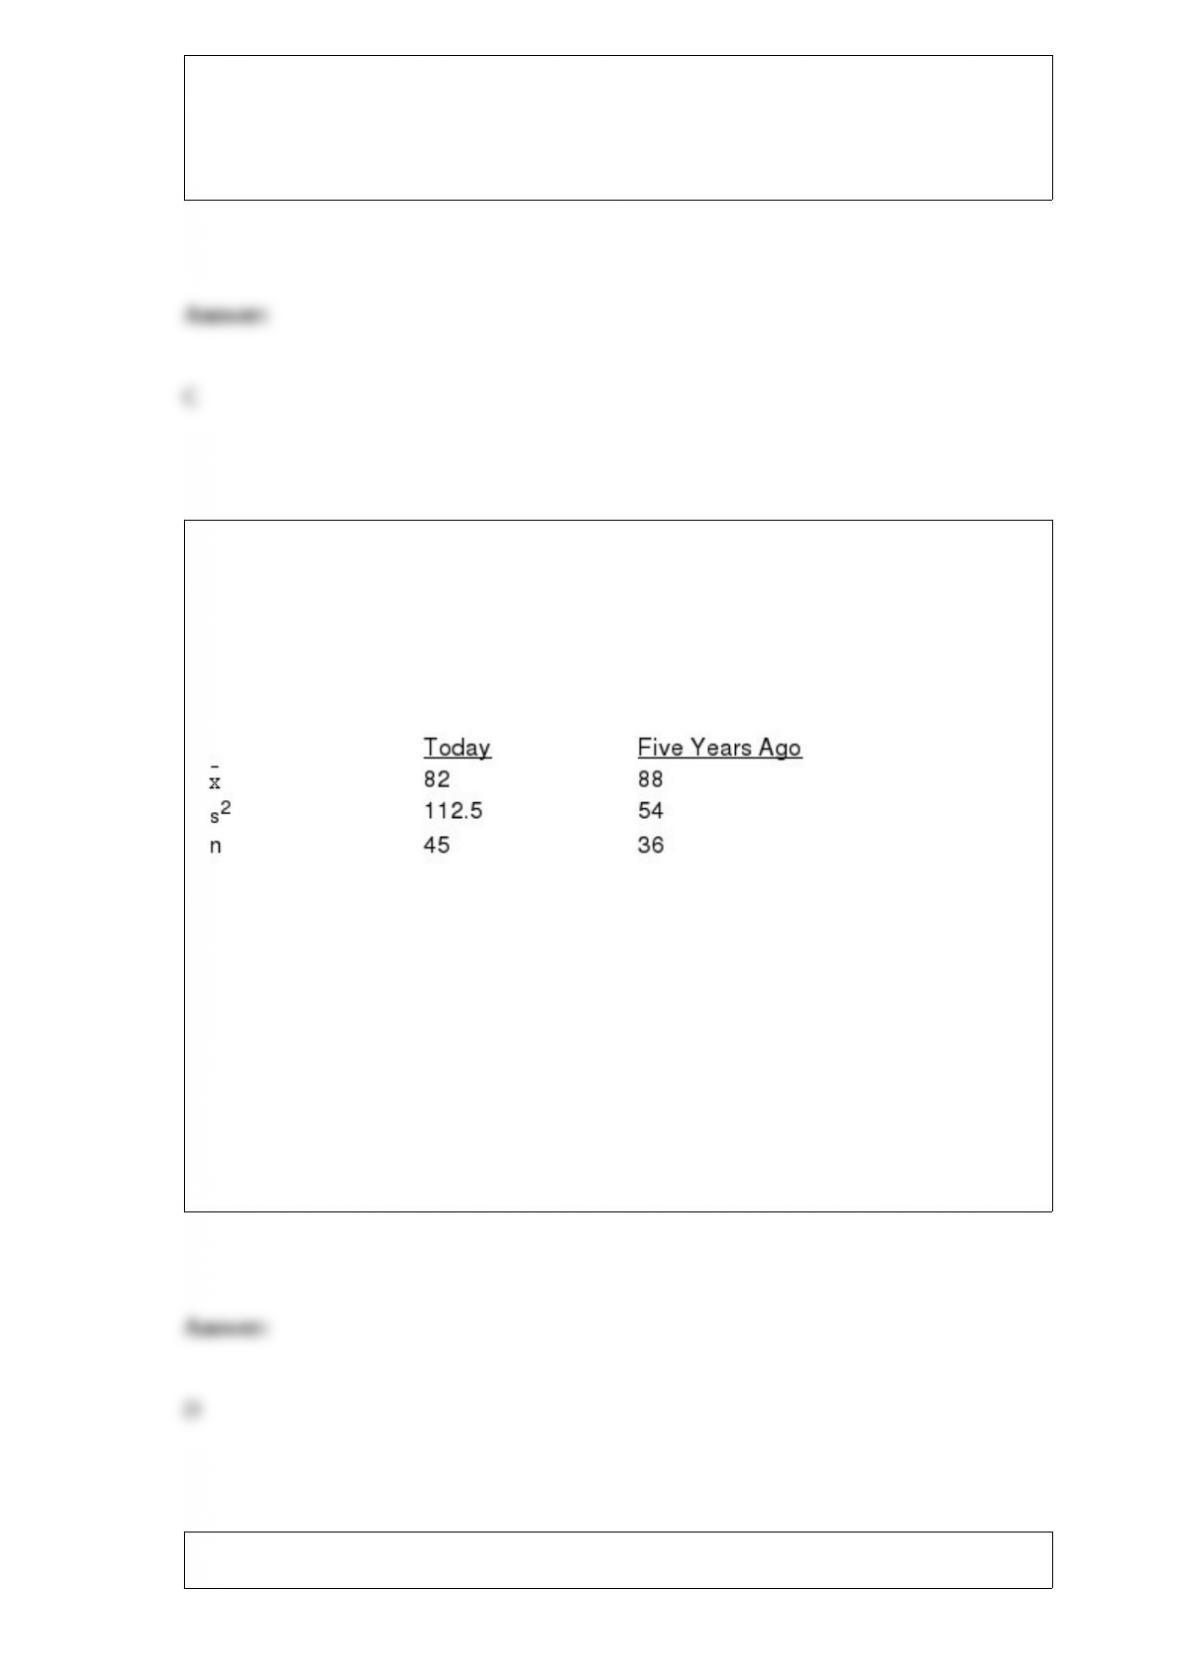
Exhibit 10-3
A statistics teacher wants to see if there is any difference in the abilities of students
enrolled in statistics today and those enrolled five years ago. A sample of final
examination scores from students enrolled today and from students enrolled five years
ago was taken. You are given the following information.
Refer to Exhibit 10-3. The point estimate for the difference between the means of the
two populations is
a. 58.5
b. 9
c. -9
d. -6
Exhibit 9-5
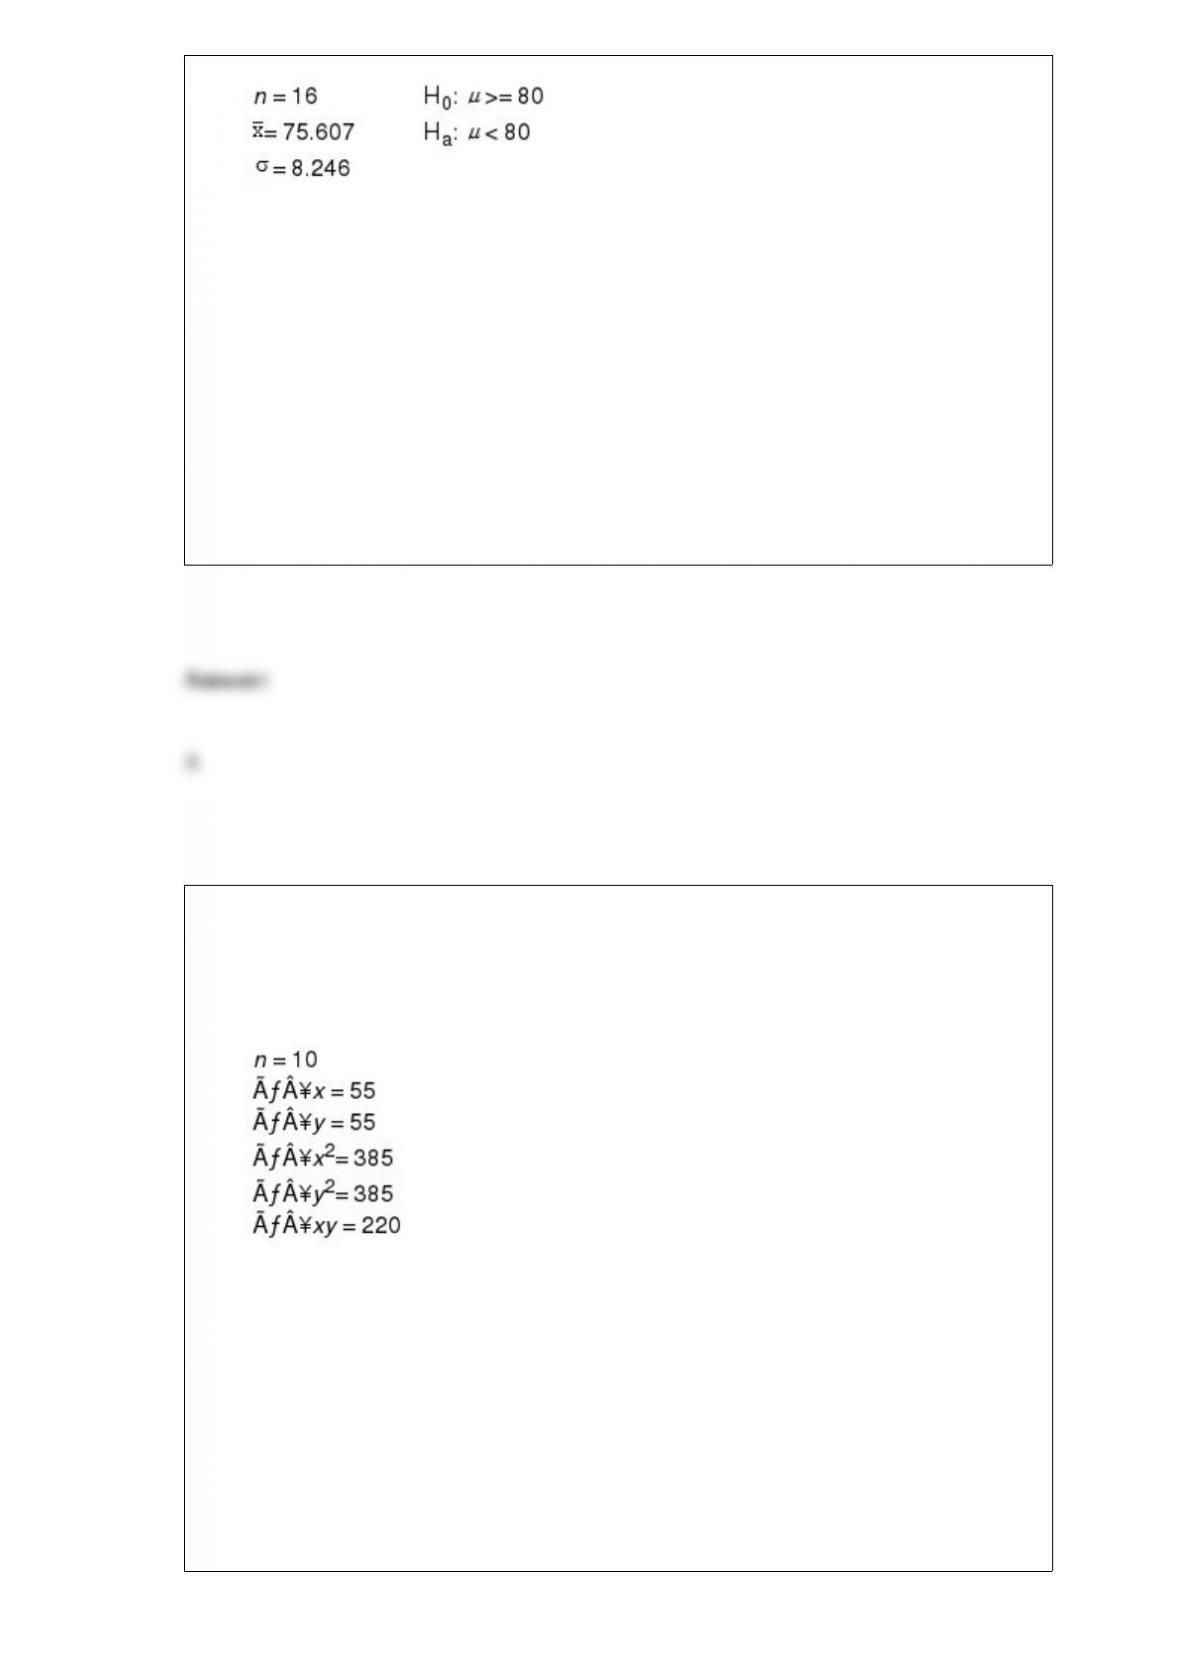
Assume population is normally distributed.
Refer to Exhibit 9-5. The test statistic equals
a. -2.131
b. -0.53
c. 0.53
d. 2.131
Exhibit 14-1
A regression analysis resulted in the following information regarding a dependent
variable (y) and an independent variable (x).
Refer to Exhibit 14-1. The least squares estimate of b1 equals
a. 1
b. -1
c. 5.5
d. 11

37. Excel’s ____ function is used to perform a test of independence.
a. z-Test: Two Sample for Means
b. t-Test: Two Sample Assuming Equal Variances
c. CHISQ.TEST
d. NORM.S.DIST
Below you are given information on crime statistics for Middletown.
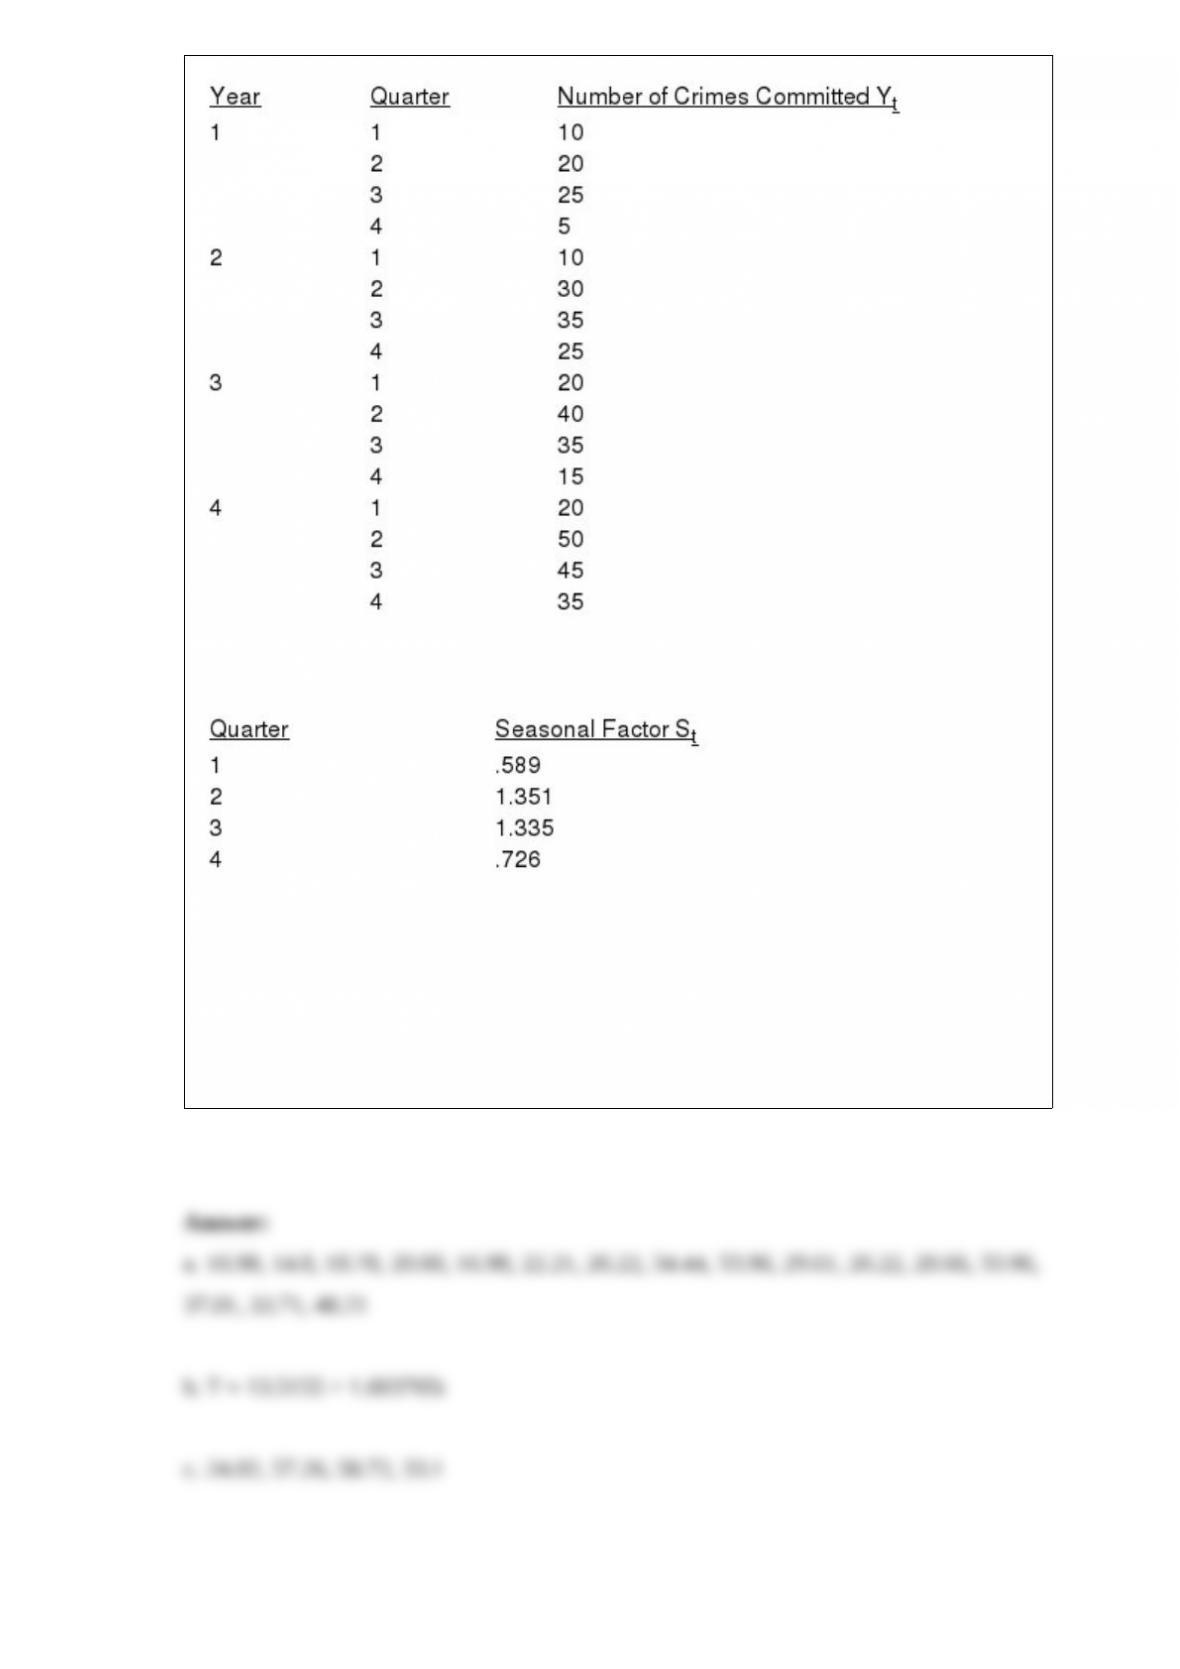
The seasonal factors for these data are
a. Deseasonalize the series.
b. Obtain an estimate of the linear trend for this series.
c. Use the seasonal and trend components to forecast the number of crimes for each
quarter of Year 5.
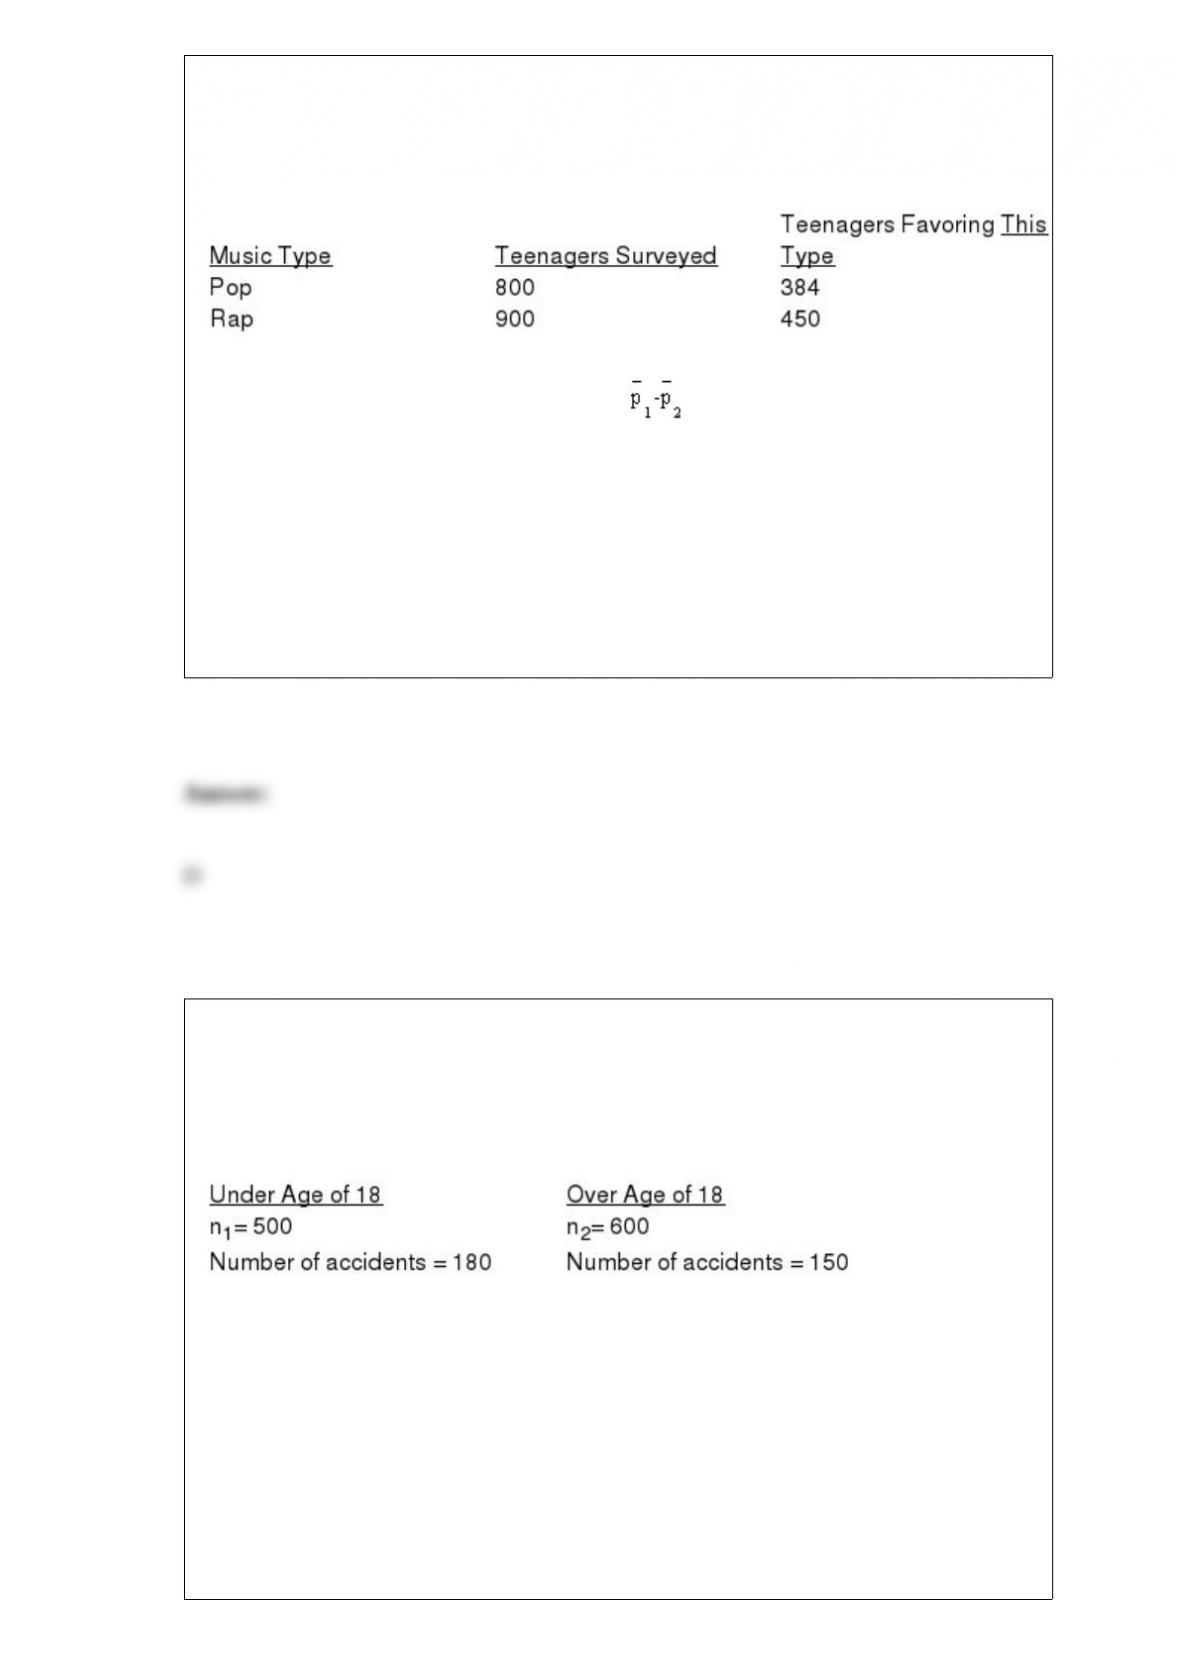
Exhibit 10-12
The results of a recent poll on the preference of teenagers regarding the types of music
they listen to are shown below.
Refer to Exhibit 10-12. The standard error of is
a. 0.48
b. 0.50
c. 0.03
d. 0.0243
Exhibit 10-11
An insurance company selected samples of clients under 18 years of age and over 18
and recorded the number of accidents they had in the previous year. The results are
shown below.
We are interested in determining if the accident proportions differ between the two age
groups.
Refer to Exhibit 10-11. The pooled proportion is
a. 0.305
b. 0.300
c. 0.027
d. 0.450
In the ANOVA, treatment refers to
a. experimental units
b. different levels of a factor
c. a factor
d. applying antibiotic to a wound
The average life expectancy of tires produced by the Whitney Tire Company has been
40,000 miles. Management believes that due to a new production process, the life
expectancy of its tires has increased. In order to test the validity of this belief, the
correct set of hypotheses is
a. H0: 40,000 Ha: 40,000
b. H0: 40,000 Ha: 40,000
c. H0: 40,000 Ha: 40,000
d. H0: 40,000 Ha: 40,000
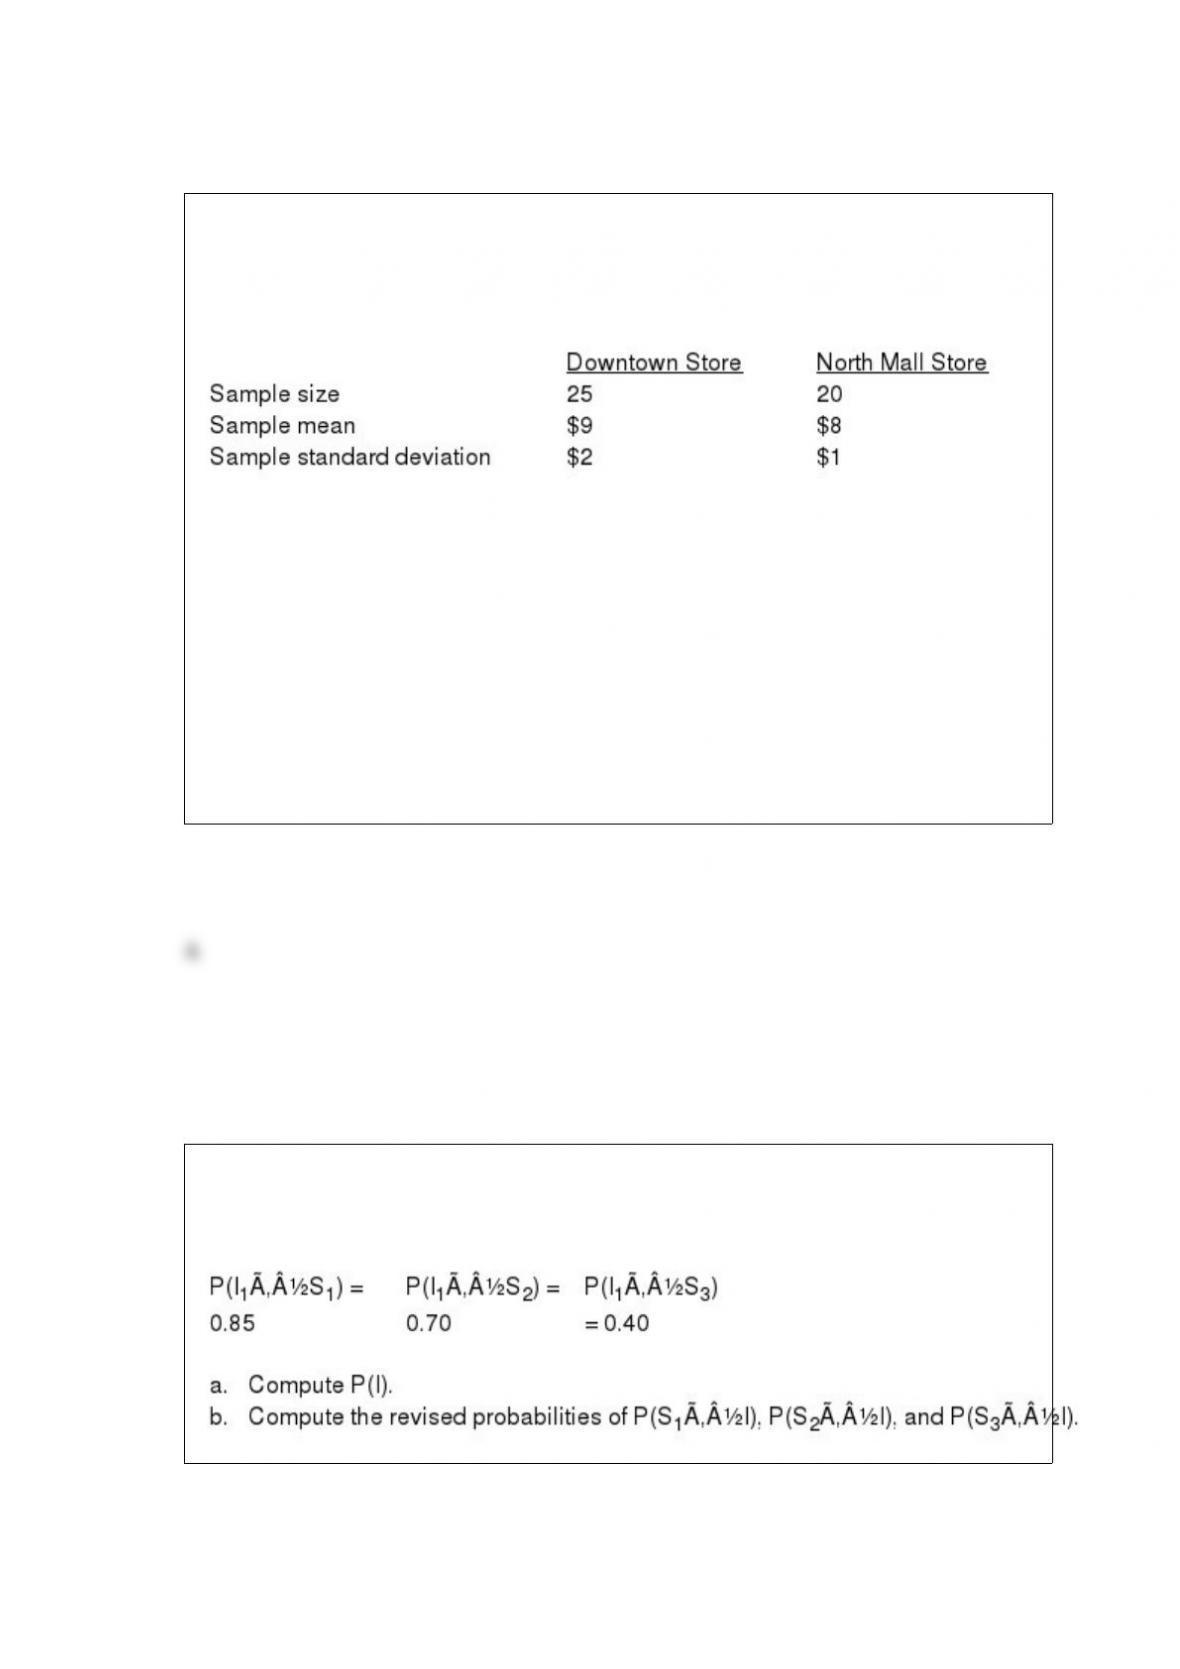
Exhibit 10-7
In order to estimate the difference between the average hourly wages of employees of
two branches of a department store, the following data have been gathered.
Refer to Exhibit 10-7. A 95% interval estimate for the difference between the two
population means is
a. 0.078 to 1.922
b. 1.922 to 2.078
c. 1.09 to 4.078
d. 1.078 to 2.922
You are given a decision situation with three possible states of nature S1, S2, and S3.
The prior probabilities of the three states are 0.20, 0.45, and 0.35. With sample
information I, you are provided with the following information.

The monthly income of residents of Daisy City is normally distributed with a mean of
$3000 and a standard deviation of $500.
a. Define the random variable in words.
b. The mayor of Daisy City makes $2,250 a month. What percentage of Daisy City’s
residents has incomes that are more than the mayor’s?
c. Individuals with incomes of less than $1,985 per month are exempt from city taxes.
What percentage of residents is exempt from city taxes?
d. What are the minimum and the maximum incomes of the middle 95% of the
residents?
e. Two hundred residents have incomes of at least $4,440 per month. What is the
population of Daisy City?
An experiment consists of measuring the speed of automobiles on a highway by the use
of radar equipment. The random variable in this experiment is speed, measured in miles
per hour. This random variable is a
a. discrete random variable
b. continuous random variable
c. complex random variable
d. None of the answers is correct.
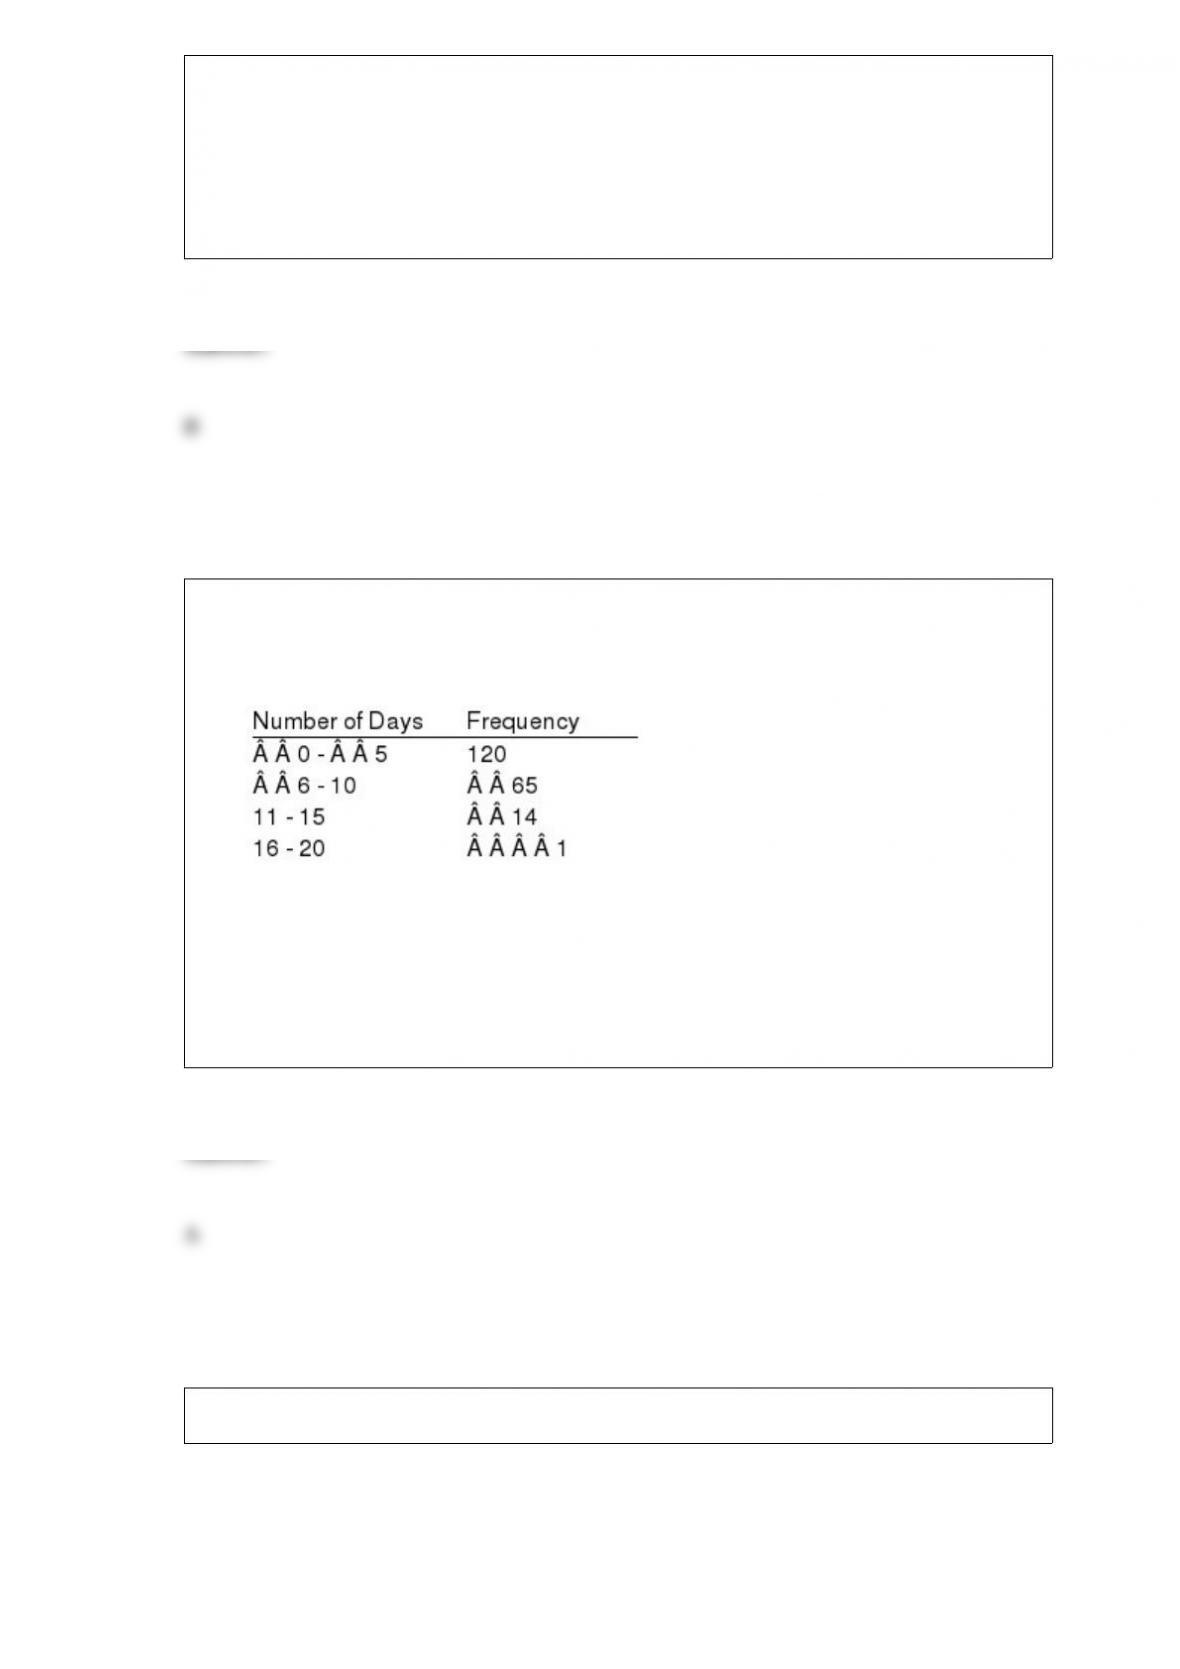
Exhibit 2-3
The number of sick days taken (per month) by 200 factory workers is summarized
below.
Refer to Exhibit 2-3. The number of workers who took more than 10 sick days per
month
a. was 15
b. was 200
c. was 185
d. was 65
The following observations are given for two variables.
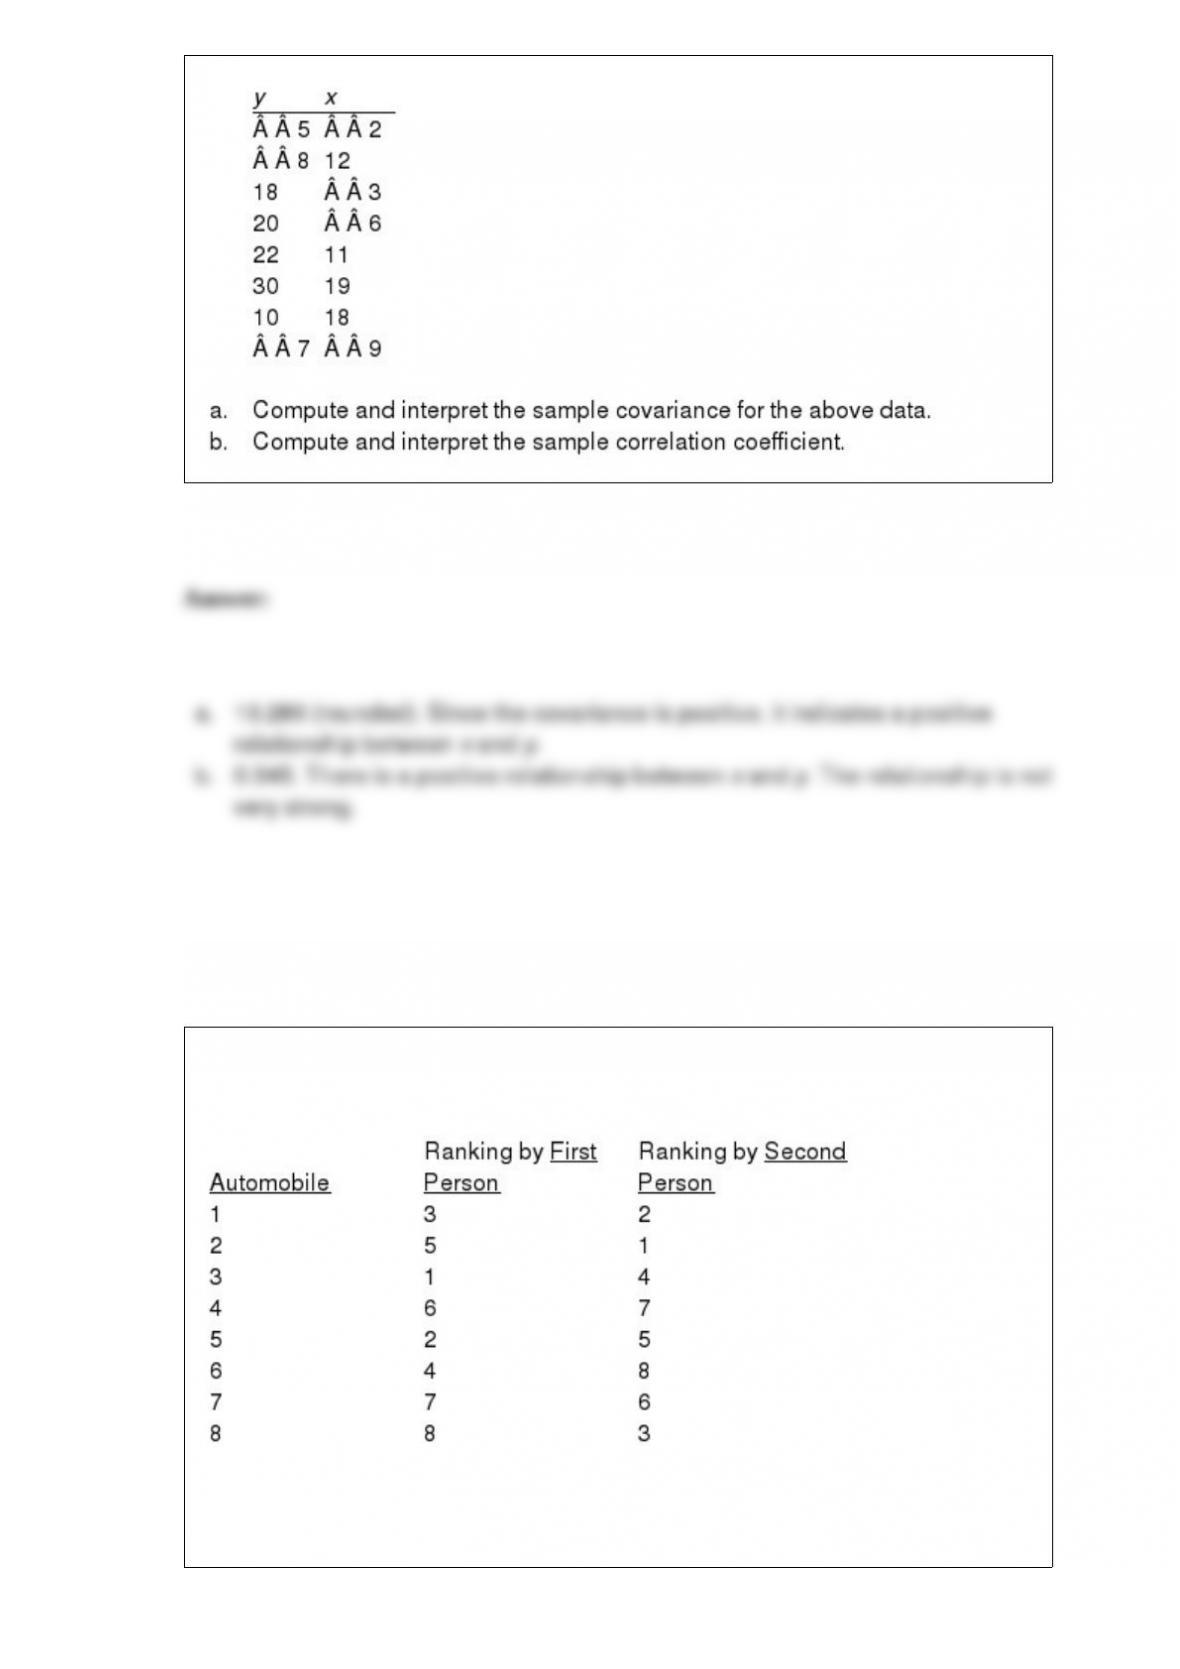
Two individuals were asked to rank the performances of eight different automobiles.
The following show their rankings.
Determine the Spearman rank-correlation coefficient and test for a significant
correlation with = 0.05.
The average grade of a sample of 25 students on their second statistics examination was
85 with a standard deviation of 9. Is the variance of the population significantly more
than 80? Use a 0.05 level of significance.
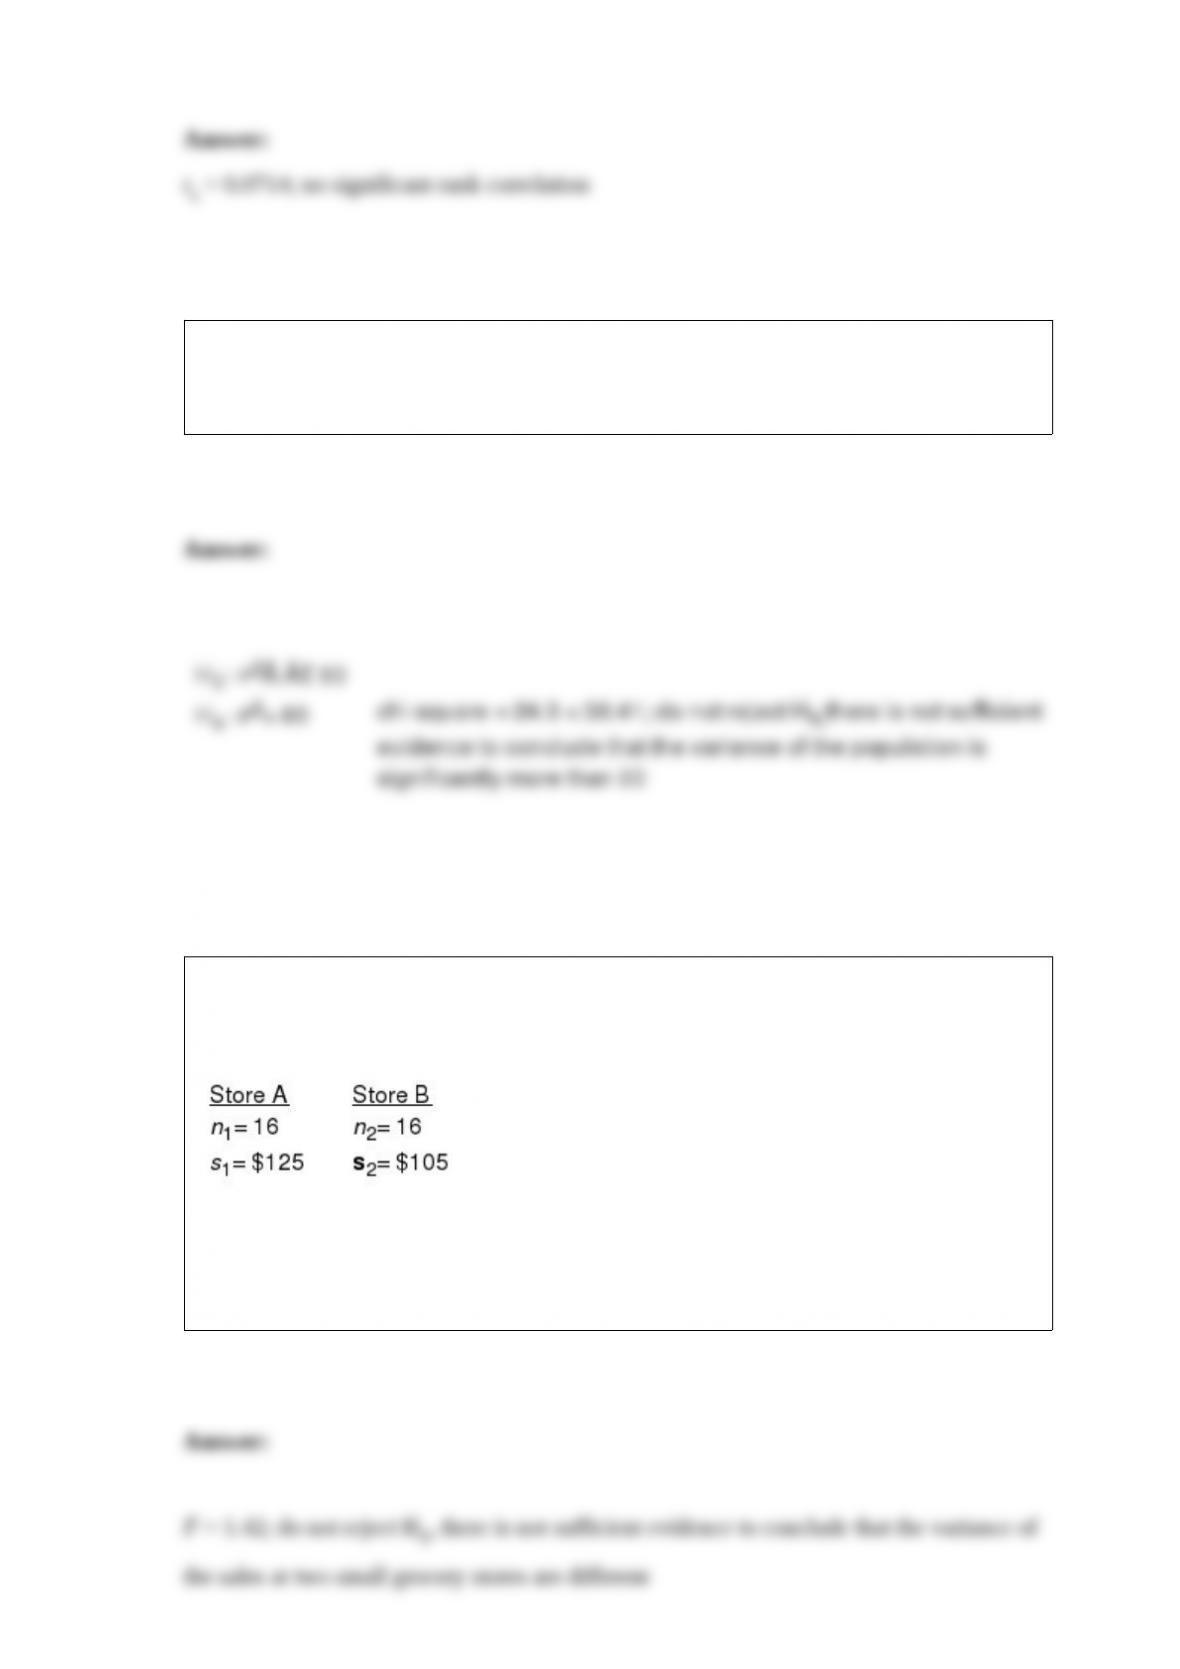
We are interested in determining whether or not the variances of the sales at two small
grocery stores are equal. A sample of 16 days of sales at each store indicated the
following.
Are the variances of the populations (from which these samples came) equal?
Use = 0.05.
The upper and lower control limits of a process are 66 and 54. Samples of size 16 are
used for the inspection process. Determine the mean and the standard deviation for this
process.
A soft drink filling machine, when in perfect adjustment, fills the bottles with 12 ounces
of soft drink. A random sample of 25 bottles is selected, and the contents are measured.
The sample yielded a mean content of 11.88 ounces, with a standard deviation of 0.24
ounces. With a 0.05 level of significance, test to see if the machine is in perfect
adjustment. Assume the distribution of the population is normal.
A coal company wants to determine a 95% confidence interval estimate for the average
daily tonnage of coal that they mine. Assuming that the company reports that the
standard deviation of daily output is 200 tons, how many days should they sample so
that the margin of error will be 39.2 tons or less?
Samples were selected from three populations. The data obtained are shown below.
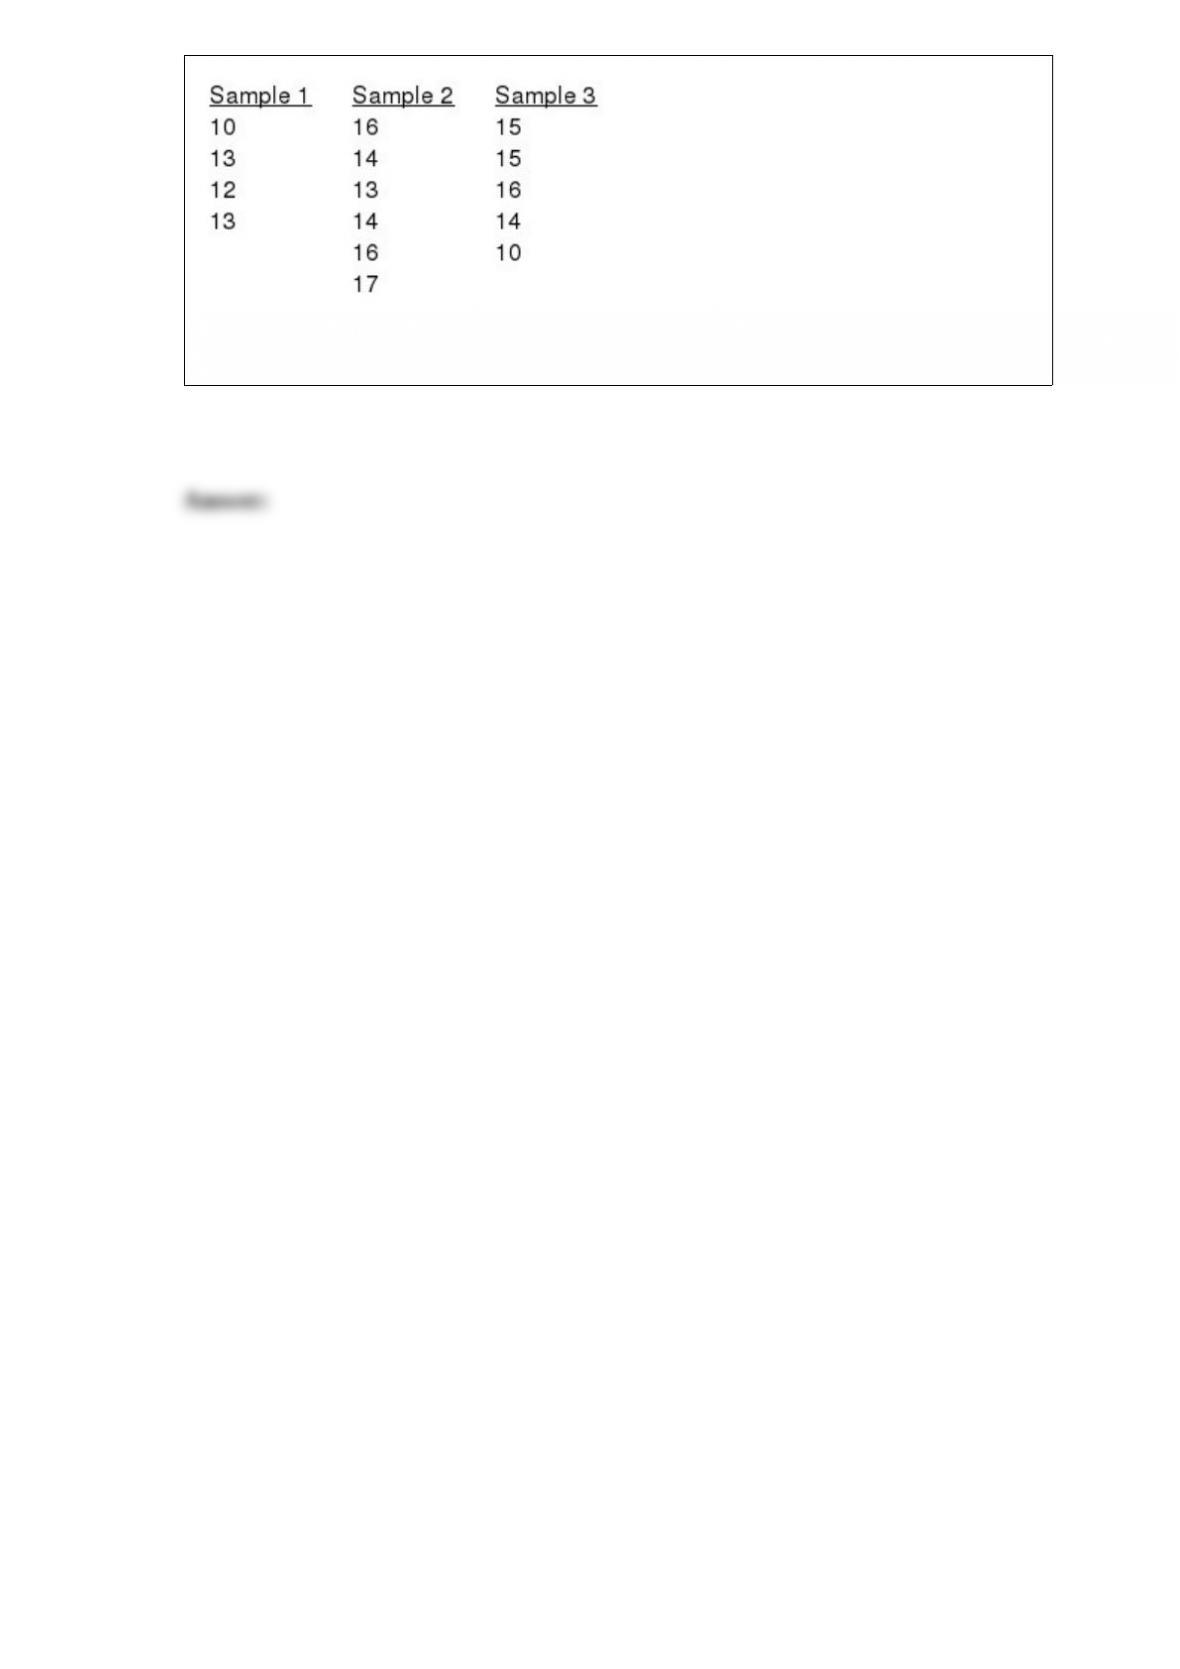
At a 5% level of significance, use Excel to test to determine whether there is a
significant difference in the means of the three populations.
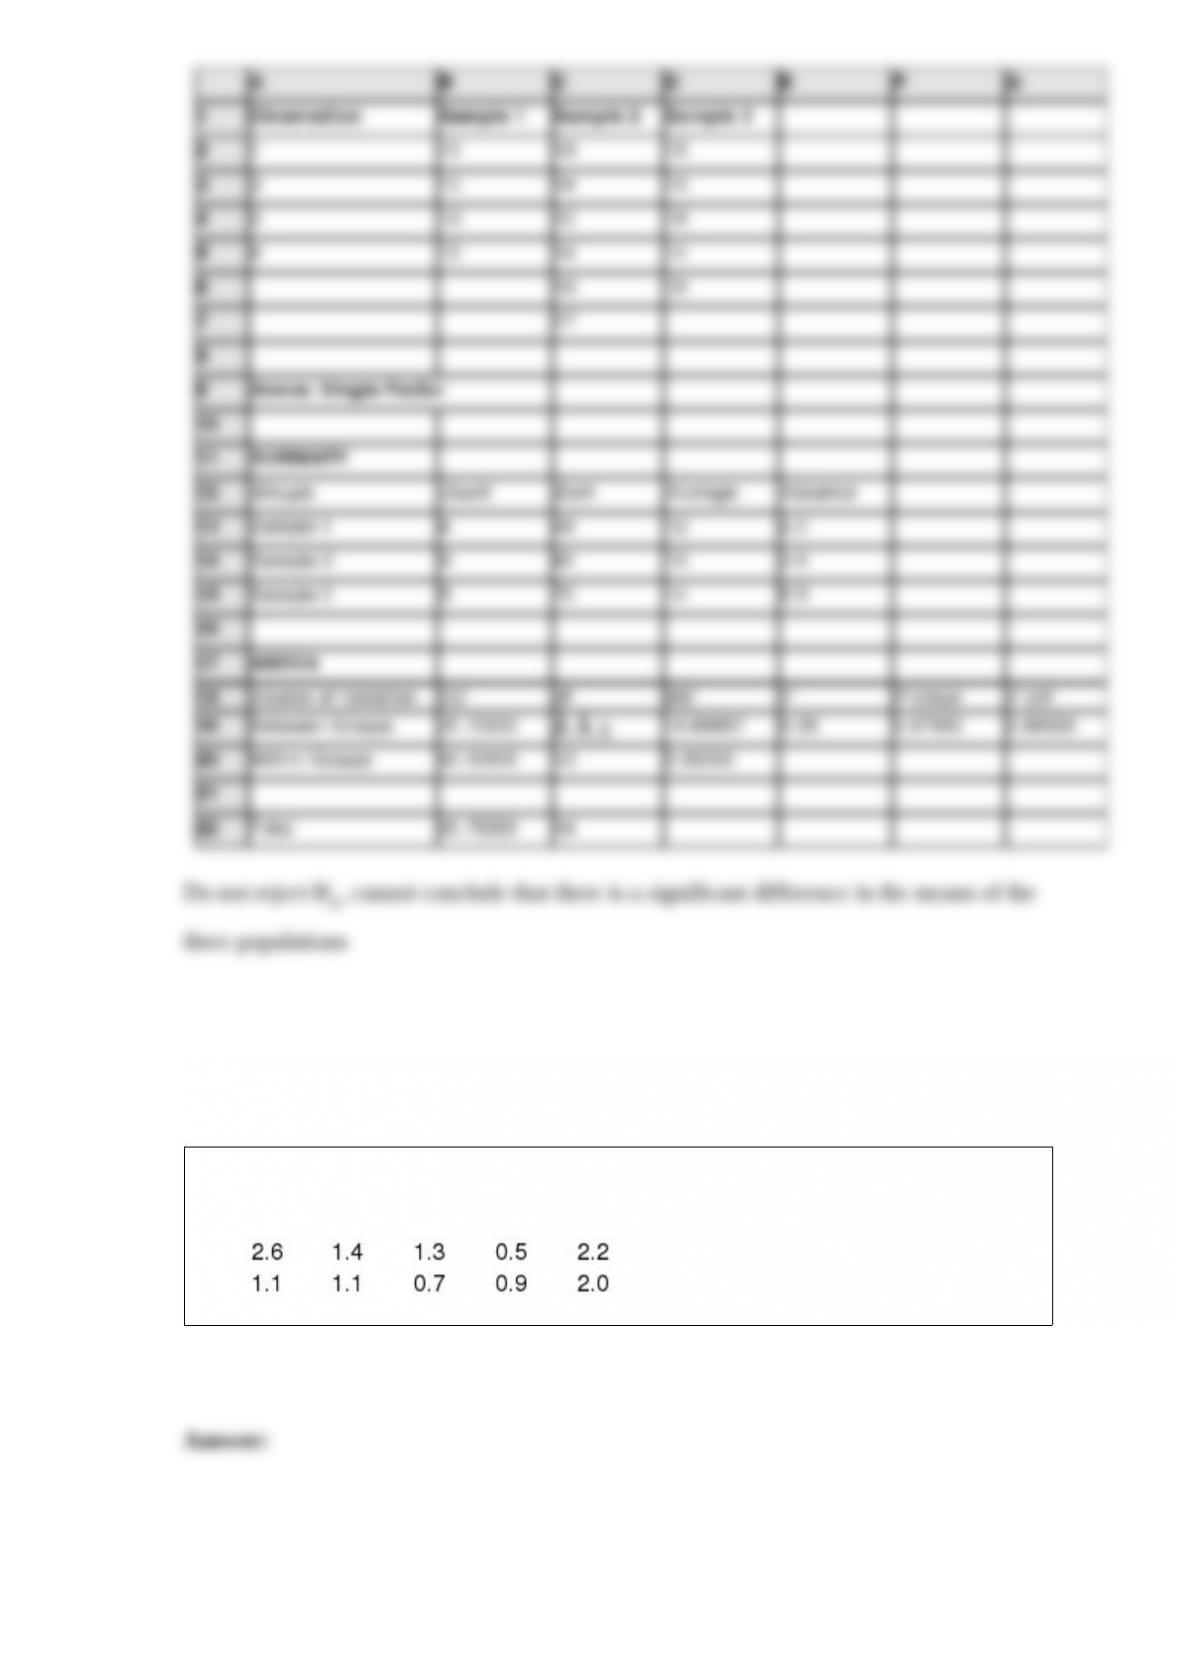
You are given the following data on the earnings per share for ten companies. Construct
a stem-and-leaf display. Specify the leaf unit for the display.

A random sample of 81 children with working mothers showed that they were absent
from school an average of 6 days per term. The population standard deviation is known
to be 1.8 days. Provide a 90% confidence interval for the average number of days
absent per term for all the children.
A company plans to interview 10 recent graduates for possible employment. The
company has three positions open. How many groups of three can the company select?