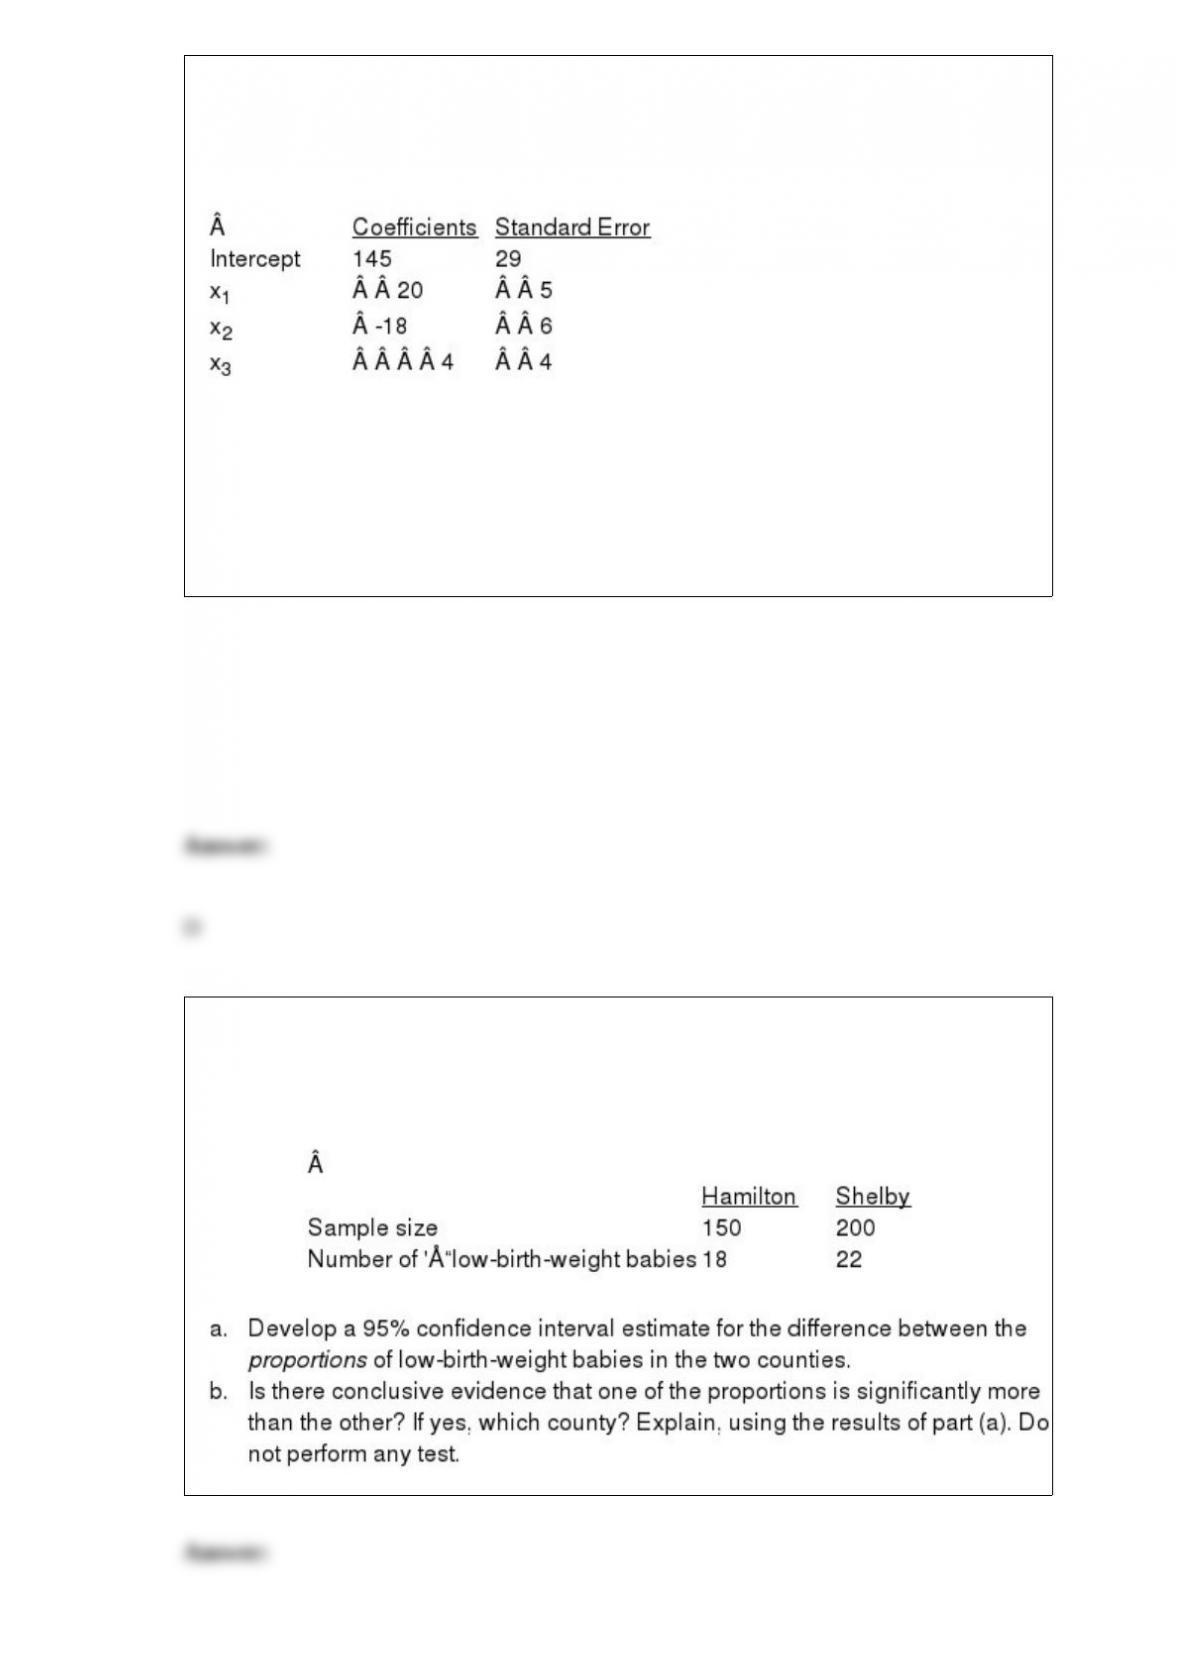
Exhibit 16-3
Below you are given a partial Excel output based on a sample of 25 observations.
Refer to Exhibit 16-3. We want to test whether the parameter 2 is significant. The test
statistic equals
a. 4
b. 5
c. 3
d. -3
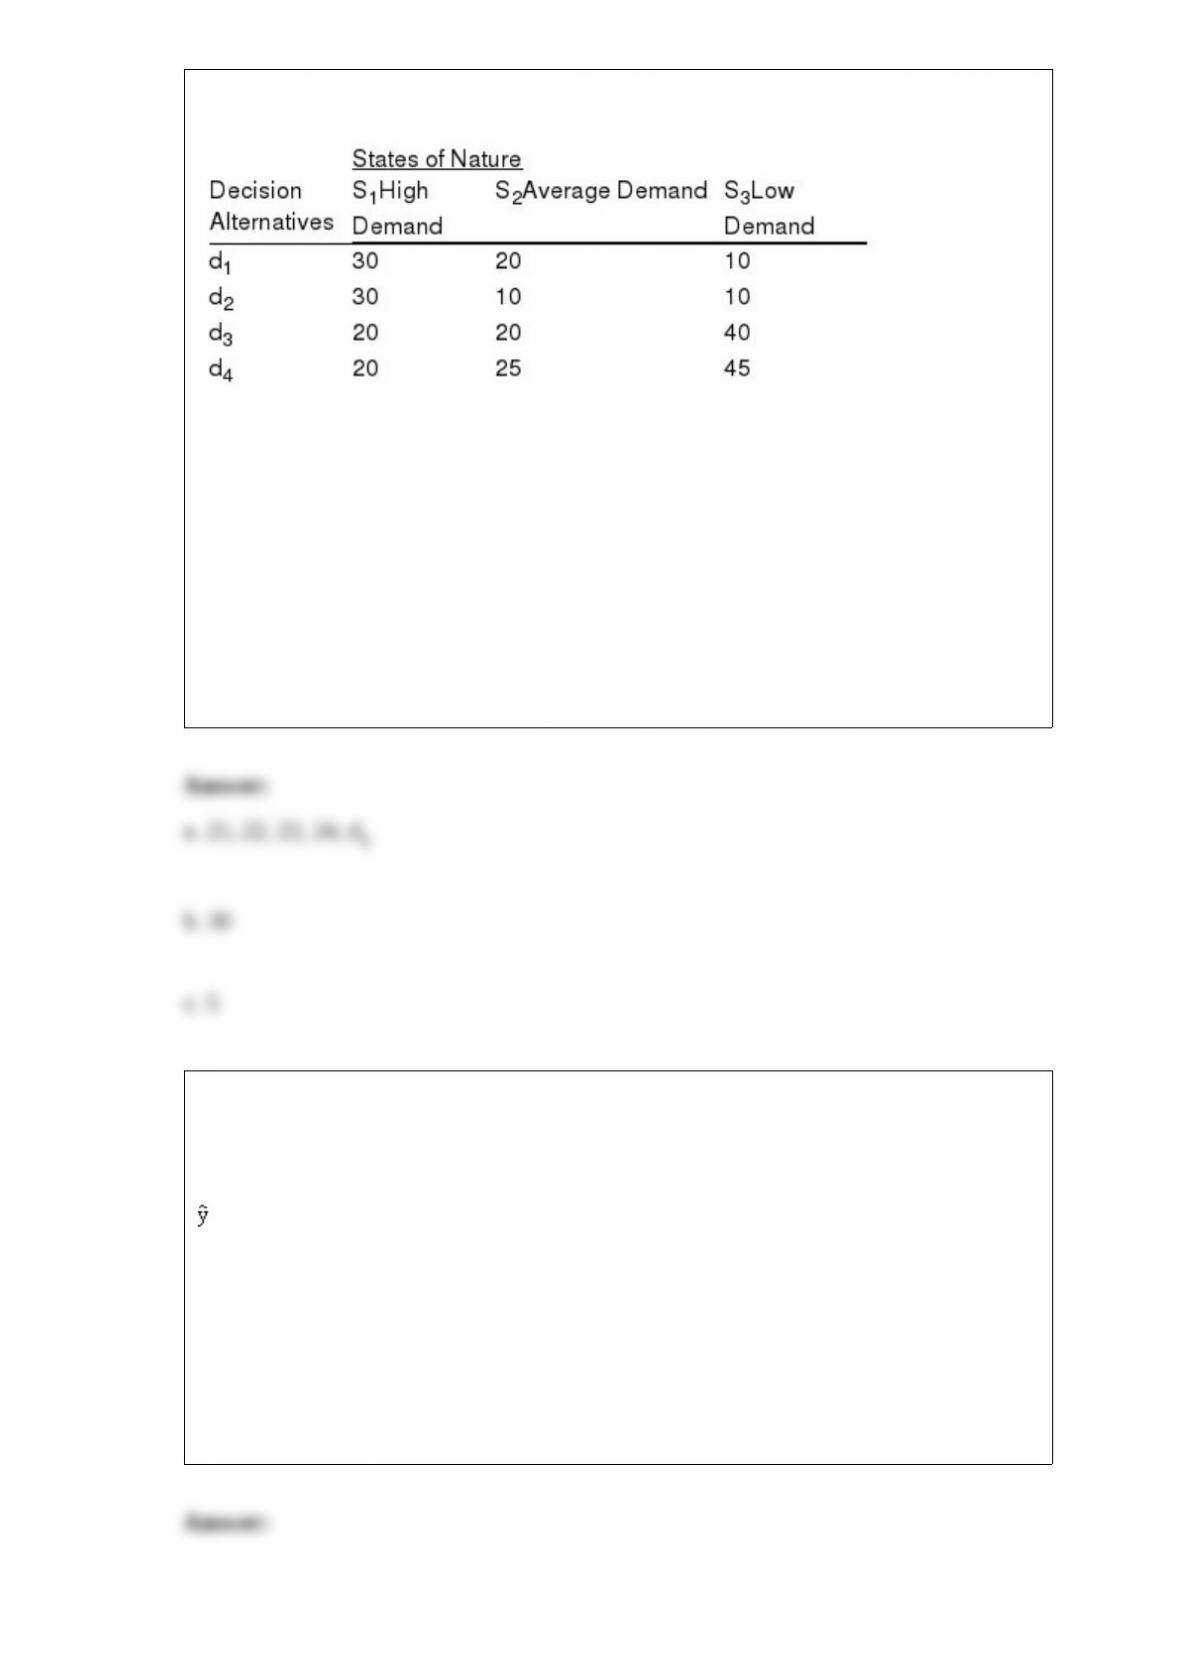
Babies weighing less than 5.5 pounds at birth are considered ‘œlow-birth-weight
babies.’ In the United States, 7.6% of newborns are low-birth-weight babies. The
following information was accumulated from samples of new births taken from two
counties.

A tabular presentation of the expected gain from the various options open to a decision
maker is called
a. a payoff table
b. a decision tree
c. the expected opportunity loss
d. the expected value of perfect information
Exhibit 7-5
Random samples of size 17 are taken from a population that has 200 elements, a mean
of 36, and a standard deviation of 8.
Refer to Exhibit 7-5. The mean and the standard deviation of the sampling distribution
of the sample means are
a. 8.7 and 1.94
b. 36 and 1.94
c. 36 and 1.86
d. 36 and 8
The owner of a new gourmet kitchenware shop wishes to determine how many days
and evenings to keep the shop open. The various payoffs (in $ 1,000s) are indicated in
the table below.
Assume the probabilities of the three states of nature are P(S1) = 0.60, P(S2) = 0.30, and
P(S3) = 0.1.
a. Determine the expected value of each alternative and indicate which decision
alternative is the best.
b. Determine the expected value with perfect information about the states of nature.
c. Determine the expected value of perfect information.
Exhibit 16-2
In a regression model involving 30 observations, the following estimated regression
equation was obtained.
= 170 + 34x1 – 3x2 + 8x3 + 58x4 + 3x5
For this model, SSR = 1,740 and SST = 2,000.
Refer to Exhibit 16-2. The degrees of freedom associated with SSR are
a. 24
b. 6
c. 19
d. 5
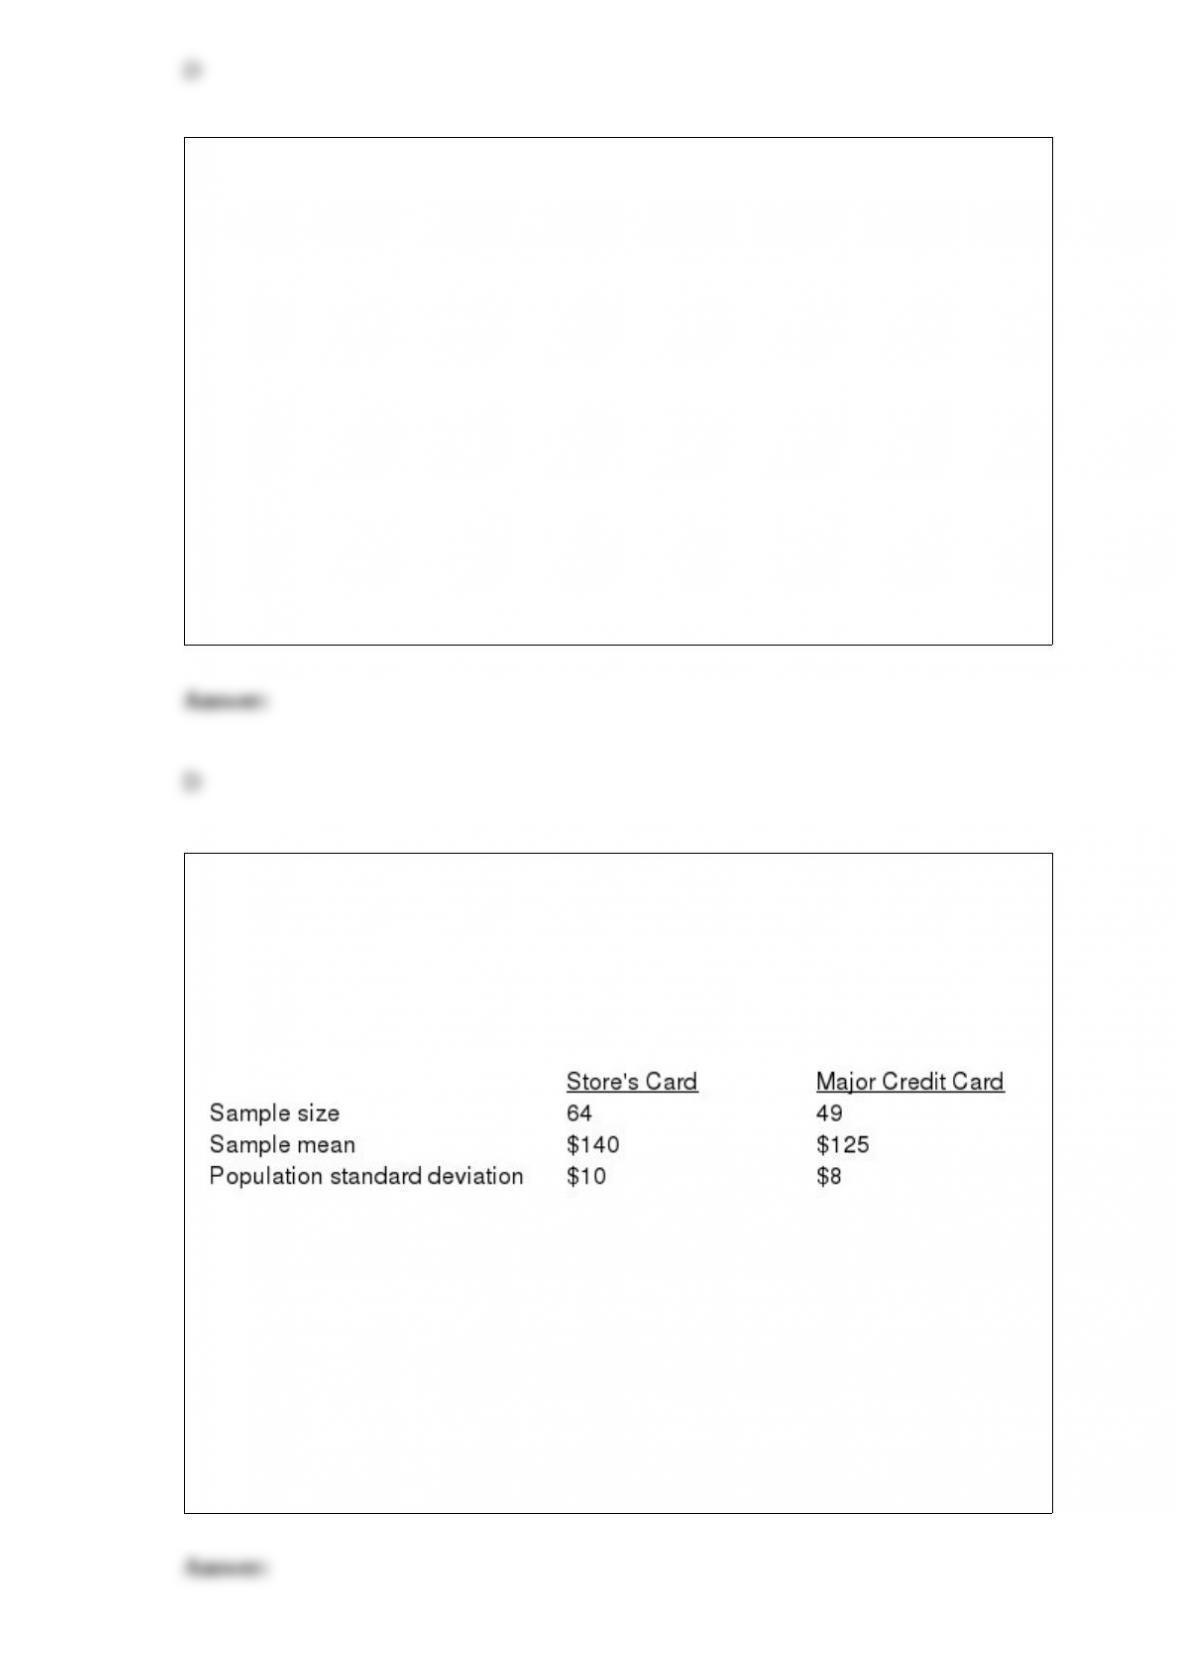
Exhibit 18-1
Ten people were given two types of cereal, Brand X and Brand Y. Three people
preferred Brand X, 5 people preferred Brand Y, and 2 people were undecided. We want
to determine whether or not the two products are equal.
Refer to Exhibit 18-1. The null hypothesis that is being tested is
a. H0: = 5
b. H0: = 0.5
c. H0: p = 5
d. H0: p = 0.5
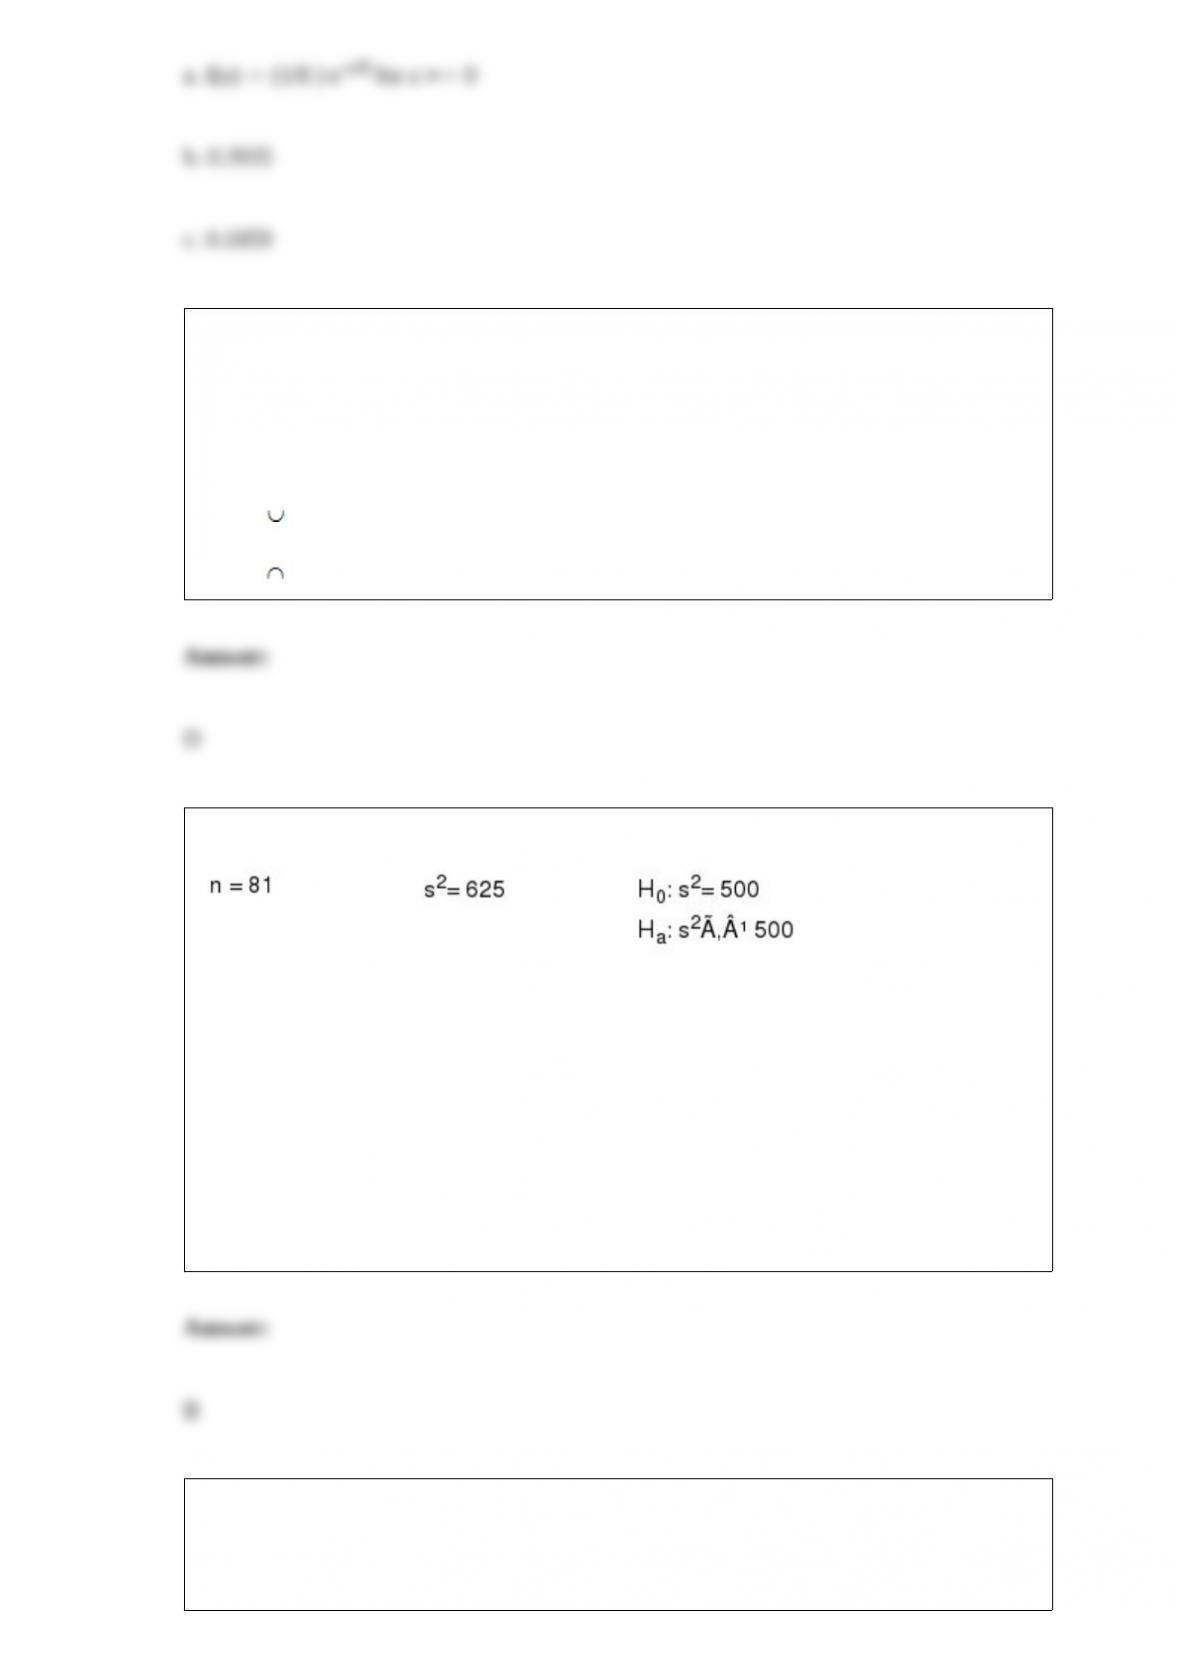
Exhibit 10-6
The management of a department store is interested in estimating the difference
between the mean credit purchases of customers using the store’s credit card versus
those customers using a national major credit card. You are given the following
information.
Refer to Exhibit 10-6. At 95% confidence, the margin of error is
a. 1.694
b. 3.32
c. 1.96
d. 15

Exhibit 13-5
Part of an ANOVA table is shown below.
Refer to Exhibit 13-5. The mean square between treatments (MSTR) is
a. 20
b. 60
c. 300
d. 15
The expected value of a random variable is the
a. value of the random variable that should be observed on the next repeat of the
experiment
b. value of the random variable that occurs most frequently
c. square root of the variance
d. None of the answers is correct.
Exhibit 2-4
A survey of 400 college seniors resulted in the following crosstabulation regarding their
undergraduate major and whether or not they plan to go to graduate school.

Refer to Exhibit 2-4. What percentage of the students does not plan to go to graduate
school?
a. 280
b. 520
c. 65
d. 32
Using exponential smoothing, the demand forecast for time period 10 equals the
demand forecast for time period 9 plus
a. times (the demand forecast for time period 8)
b. times (the error in the demand forecast for time period 9)
c. times (the observed demand in time period 9)
d. times (the demand forecast for time period 9)
The time it takes a worker on an assembly line to complete a task is exponentially
distributed with a mean of 8 minutes.
a. What is the probability density function for the time it takes to complete the task?
b. What is the probability that it will take a worker less than 4 minutes to complete the
task?
c. What is the probability that it will take a worker between 6 and 10 minutes to
complete the task?
If P(A|B) = .3 and P(B) = .8, then
a. P(A) = .24
b. P(B|A) = .7
c. P(A B) = .5
d. P(A B) = .24
Exhibit 11-10
Refer to Exhibit 11-10. At 95% confidence, the null hypothesis
a. should be rejected
b. should not be rejected
c. should be revised
d. None of these alternatives is correct.
A variable such as z, whose value is z = x1x2 is added to a general linear model in order
to account for potential effects of two variables x1 and x2 acting together. This type of
effect is

a. impossible to occur
b. called interaction
c. called multicollinearity effect
d. called transformation effect
The set of all possible sample points (experimental outcomes) is called
a. a sample
b. an event
c. the sample space
d. a population
A salesperson contacts eight potential customers per day. From past experience, we
know that the probability of a potential customer making a purchase is 0.10.
a. Define the random variable in words for this experiment.
b. What is the probability the salesperson will make exactly two sales in a day?
c. What is the probability the salesperson will make at least two sales in a day?
d. What percentage of days will the salesperson not make a sale?
e. What is the expected number of sales per day?

Fifteen percent of the students in a School of Business Administration are majoring in
Economics, 20% in Finance, 35% in Management, and 30% in Accounting. The
graphical device(s) that can be used to present these data is (are)
a. a line graph
b. only a bar chart
c. only a pie chart
d. both a bar chart and a pie chart
For a standard normal distribution, a negative value of z indicates
a. a mistake has been made in computations, because z is always positive
b. the area corresponding to the z is negative
c. the z is to the left of the mean
d. the z is to the right of the mean