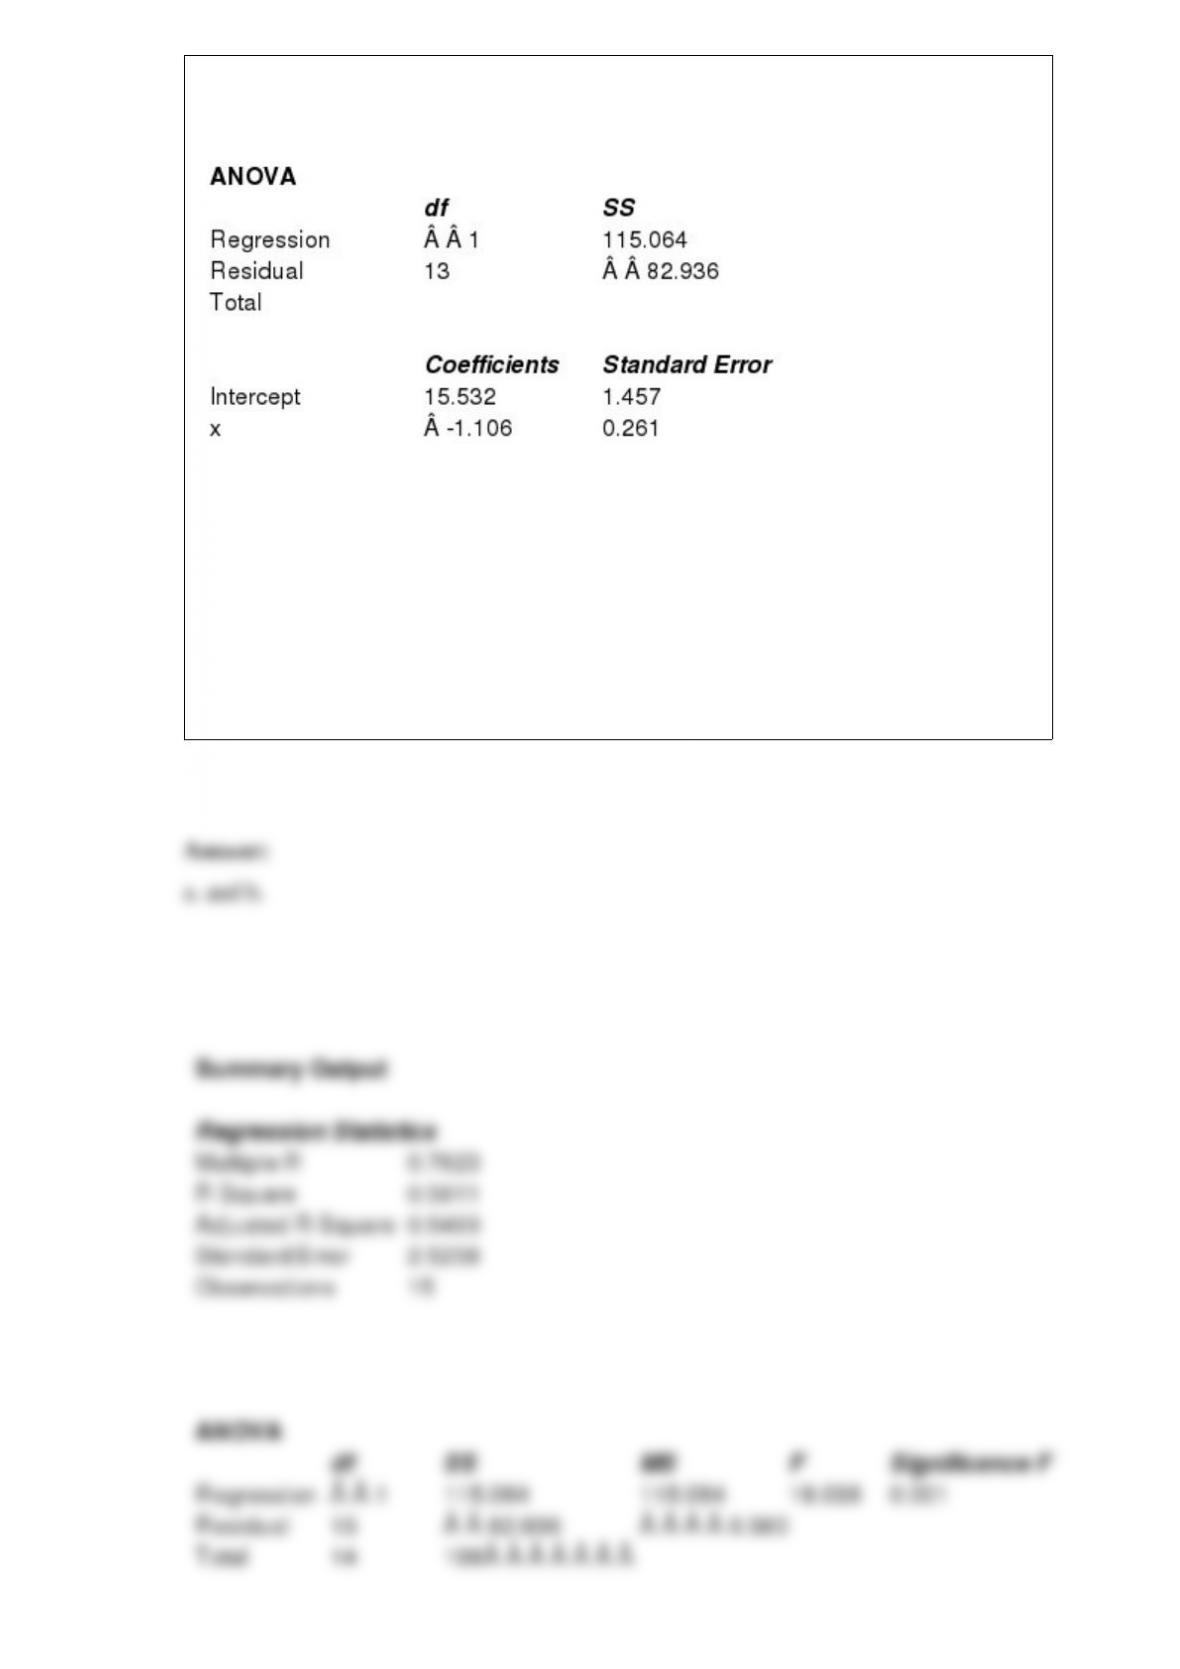
Shown below is a portion of a computer output for a regression analysis relating Y
(dependent variable) and X (independent variable).
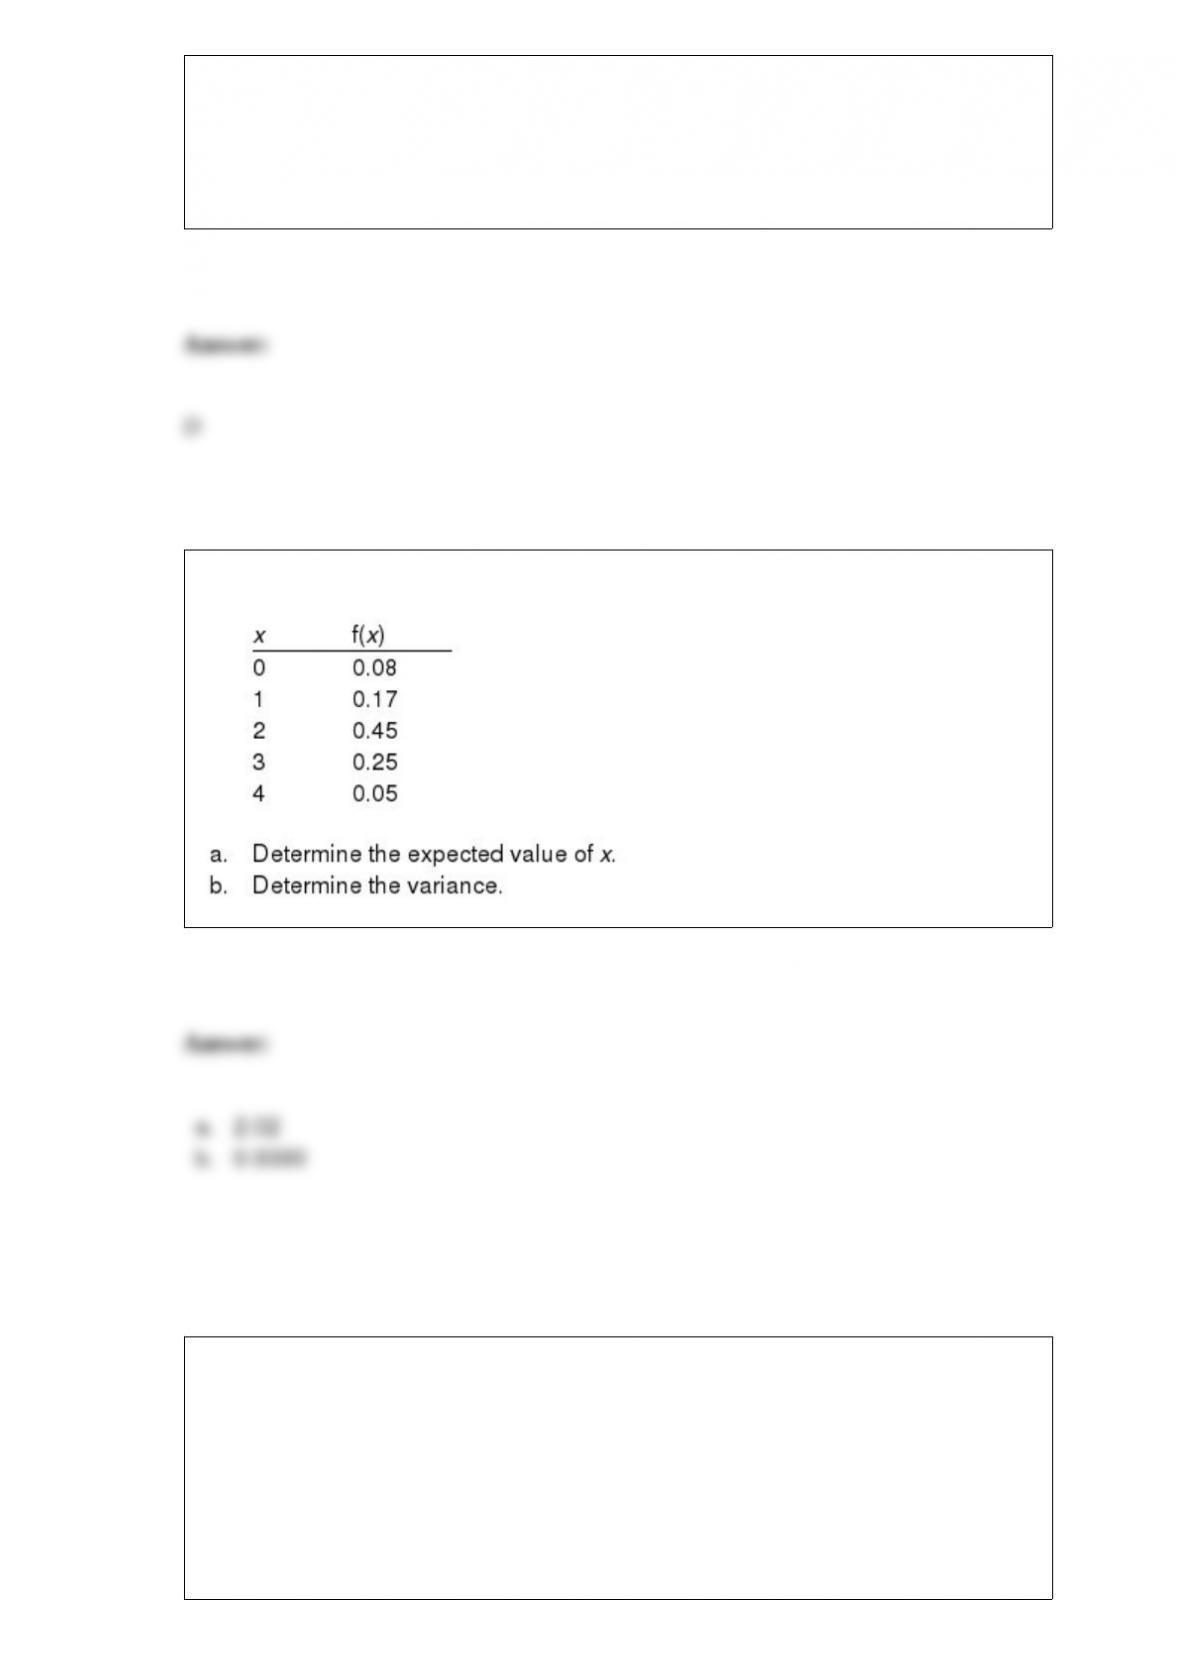
a. Perform a t test using the p-value approach and determine whether or not Y and X are
related. Let = 0.05.
b. Using the p-value approach, perform an F test and determine whether or not X and Y
are related.
c. Compute the coefficient of determination and fully interpret its meaning. Be very
specific.
In a multiple regression model, the values of the error term ,, are assumed to be
a. zero
b. dependent on each other
c. independent of each other
d. always negative
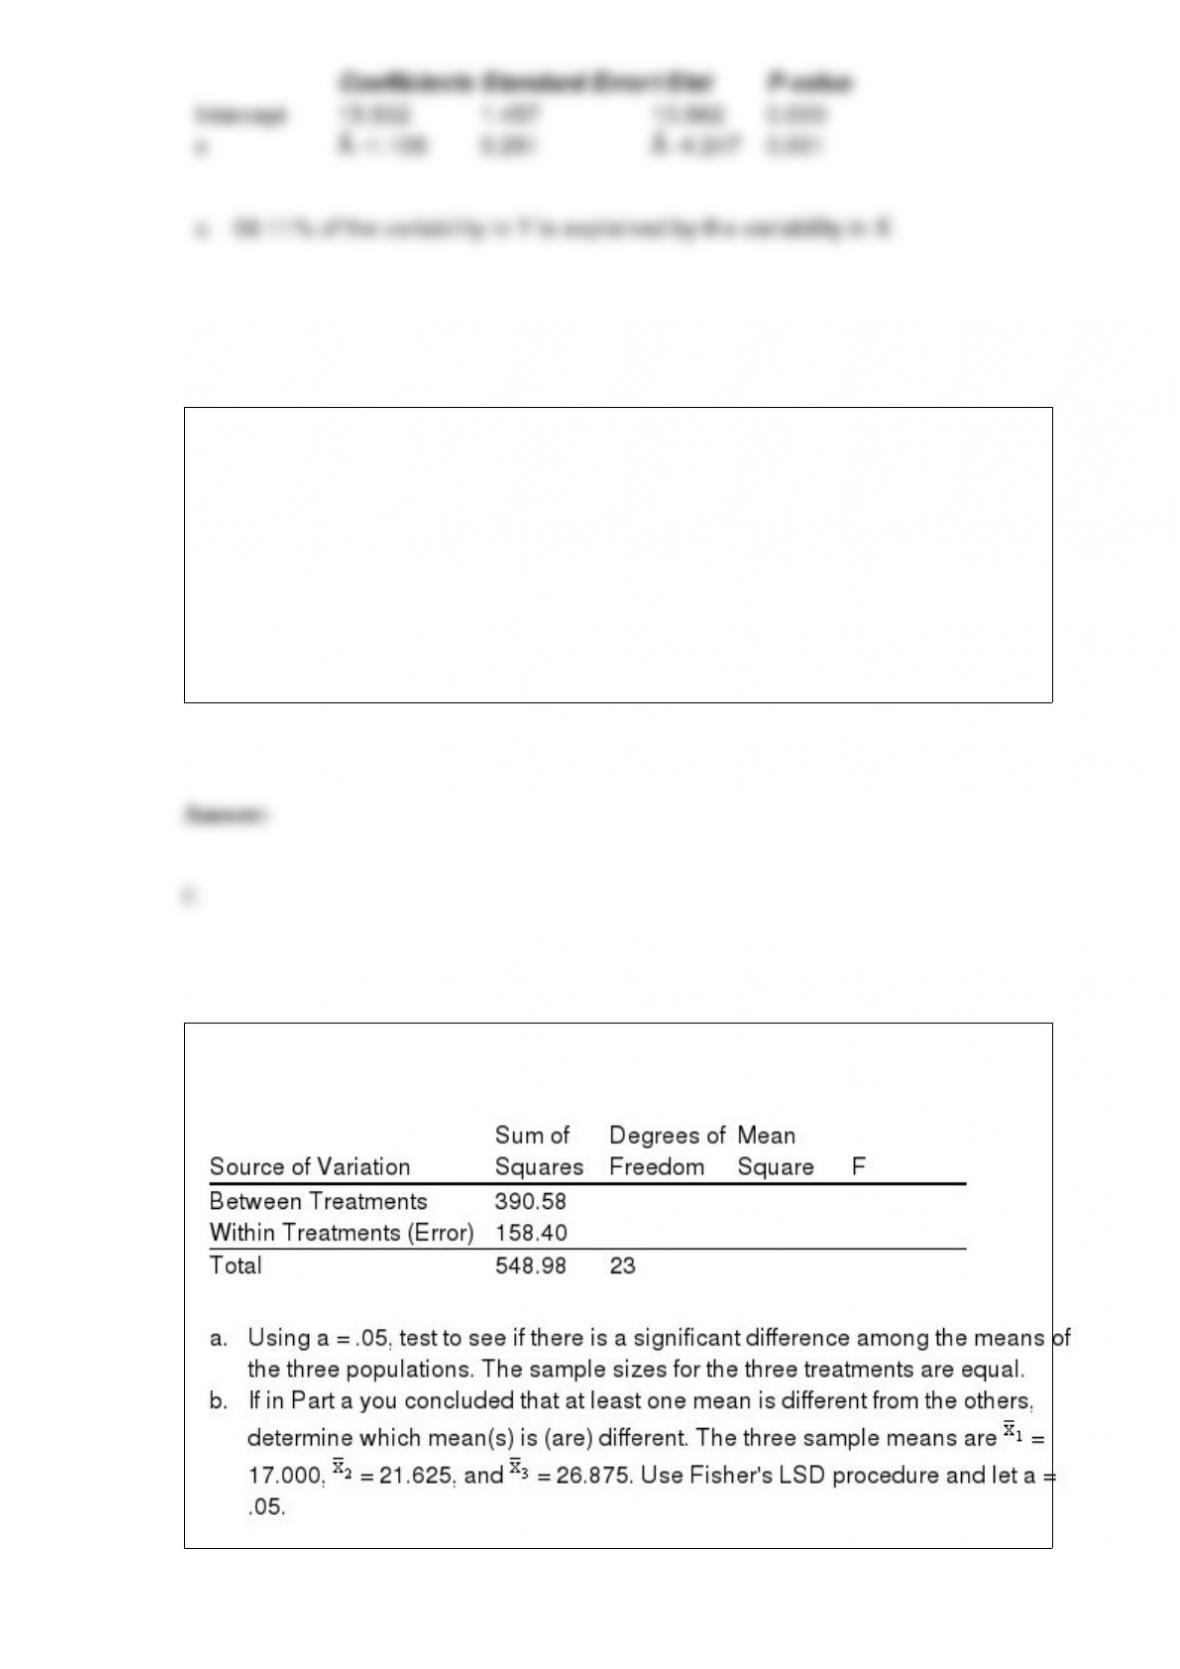
The following are the results from a completely randomized design consisting of 3
treatments.

A graphical summary of data that is based on a five-number summary is a
a. histogram
b. stem-and-leaf display
c. scatter diagram
d. box plot
For a standard normal distribution, the probability of z 0 is
a. zero
b. -0.5
c. 0.5
d. one
A soft drink filling machine is set up to fill bottles with 12 ounces of soft drink. The
standard deviation s is known to be 0.4 ounces. The quality control department
periodically selects samples of 16 bottles and measures their contents. Assume the
distribution of filling volumes is normal.
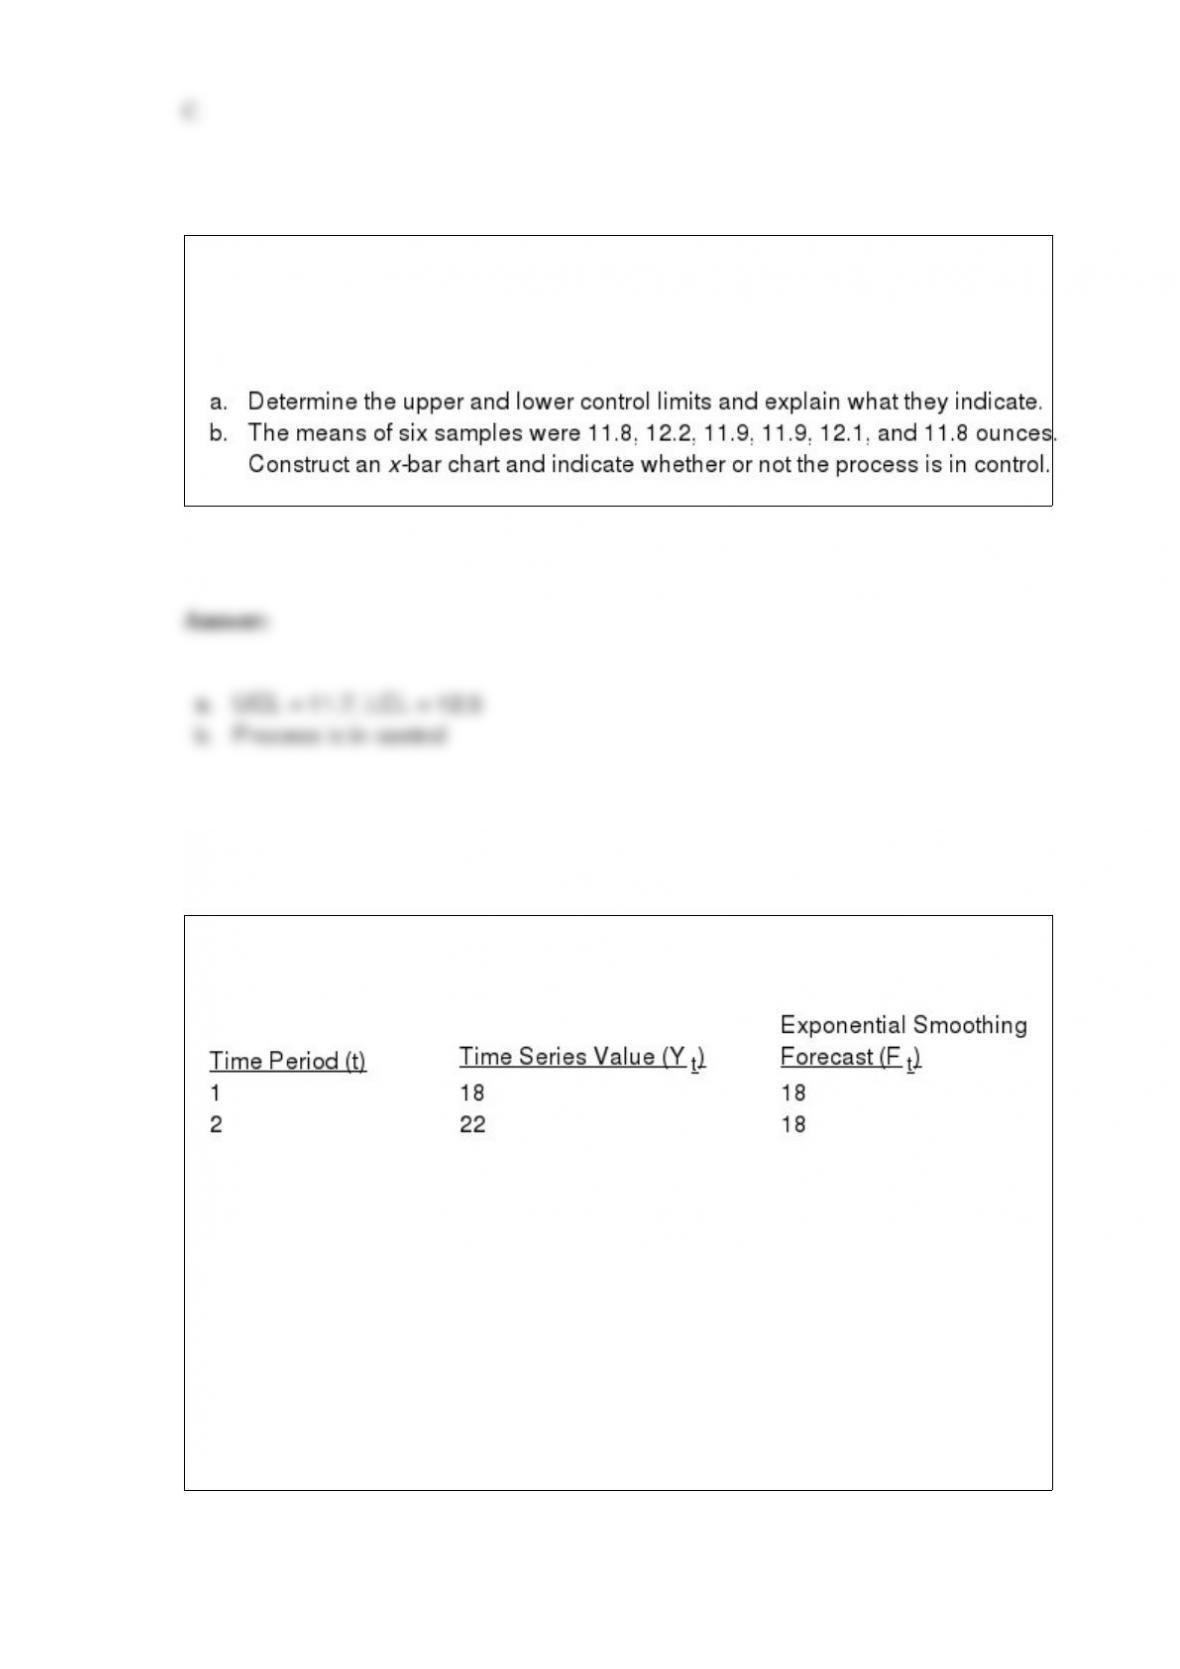
Below you are given the first two values of a time series. You are also given the first
two values of the exponential smoothing forecast.
If the smoothing constant equals .3, then the exponential smoothing forecast for time
period three is
a. 18
b. 19.2
c. 20
d. 40

Z is the standard normal random variable. Use Excel to calculate the following:
a. P(z 2.5)
b. P(0 z 2.5)
c. P(-2 z 2)
d. P(z -0.38)
e. P(z 1.62)
f. z value with .05 in the lower tail
g. z value with .05 in the upper tail

Exhibit 9-2
The manager of a grocery store has taken a random sample of 100 customers. The
average length of time it took the customers in the sample to check out was 3.1 minutes.
The population standard deviation is known to be 0.5 minutes. We want to test to
determine whether or not the mean waiting time of all customers is significantly more
than 3 minutes.
Refer to Exhibit 9-2. The p-value is
a. 0.025
b. 0.0456
c. 0.05
d. 0.0228
Consider the following data.
Use Excel’s Regression Tool to estimate a general linear model of the form

If a penny is tossed three times and comes up heads all three times, the probability of
heads on the fourth trial is
a. smaller than the probability of tails
b. larger than the probability of tails
c. 1/16
d. None of the other answers is correct.

A machine produces pipes used in airplanes. The average length of the pipe is 16
inches. The acceptable variance for the length is .3 inches. A sample of 25 pipes was
taken. The average length in the sample was 95 inches with a variance of .4 inches.
a. Construct a 95% confidence interval for the population variance.
b. State the null and alternative hypotheses to be tested.
c. Compute the test statistic.
d. The null hypothesis is to be tested at the 5% level of significance. State the decision
rule for the test.
e. What do you conclude about the population variance?

Since the population size is always larger than the sample size, then the sample statistic
a. can never be larger than the population parameter
b. can never be equal to the population parameter
c. can never be zero
d. None of the other answers are correct.
In computing an expected value (EV), the weights are
a. decision alternative probabilities
b. in pounds or some unit of weight
c. in dollars or some units of currency
d. the state-of-nature probabilities
Which scale of measurement can be either numeric or nonnumeric?
a. nominal
b. ordinal
c. interval
d. nominal and ordinal
A population has a mean of 84 and a standard deviation of 12. A sample of 36
observations will be taken. The probability that the sample mean will be between 80.54
and 88.9 is
a. 0.0347
b. 0.7200
c. 0.9511
d. None of the alternative answers is correct.
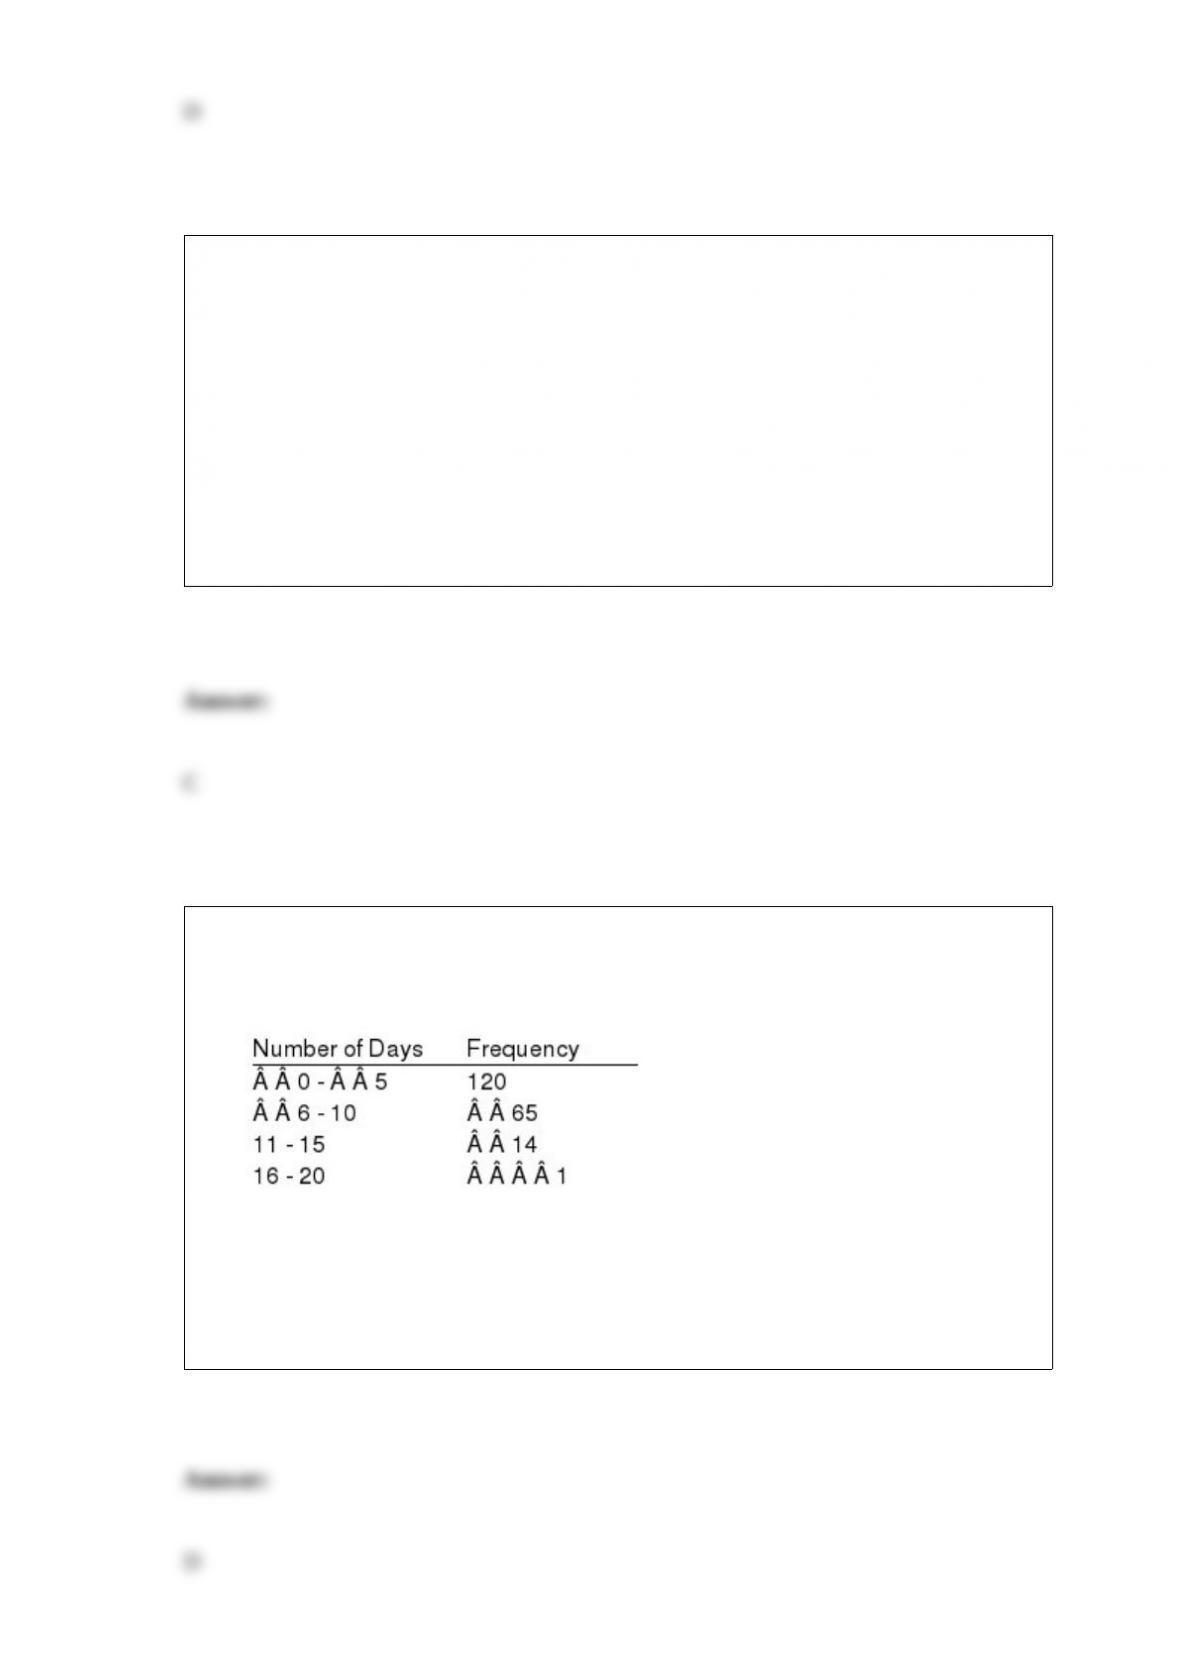
Exhibit 2-3
The number of sick days taken (per month) by 200 factory workers is summarized
below.
Refer to Exhibit 2-3. The cumulative relative frequency for the class of 11 15
a. is 199
b. is 0.07
c. is 1
d. is 0.995

Which of the following is not a categorical variable?
a. your age on your last birthday
b. your cell phone area code
c. your accounting class start time
d. your high school graduation year
Exhibit 16-2
In a regression model involving 30 observations, the following estimated regression
equation was obtained.
= 170 + 34x1 – 3x2 + 8x3 + 58x4 + 3x5
For this model, SSR = 1,740 and SST = 2,000.
Refer to Exhibit 16-2. The coefficient of determination for this model is
a. 0.6923
b. 0.1494
c. 0.1300
d. 0.8700
In hypothesis testing if the null hypothesis is rejected,
a. no conclusions can be drawn from the test
b. the alternative hypothesis must also be rejected
c. the data must have been accumulated incorrectly
d. None of the other answers are correct.
A random variable x has the following probability distribution:
The probabilities of states of nature after revising the prior probabilities based on given
indicator information are
a. the expected probabilities
b. the posterior probabilities
c. the prior probabilities

d. None of the answers are correct.
Exhibit 3-2
A researcher has collected the following sample data. The mean of the sample is 5.
Refer to Exhibit 3-2. The interquartile range is
a. 1
b. 2
c. 10
d. 12
A coach is deciding on whether to buy stopwatches from company A or company B. A
test was set up to see how many seconds each stopwatch was off in a precise ten minute
test period. For samples of watches from companies A and B, the following information
on stopwatch errors was found.
Test the hypothesis of equal variances using a .05 level of significance. Be sure to state
the null and alternative hypotheses being tested and the final conclusions of the test.
It is estimated that 3% of the athletes competing in a large tournament are users of an
illegal drug to enhance performance. The test for this drug is 90% accurate. What is the
probability that an athlete who tests positive is actually a user?
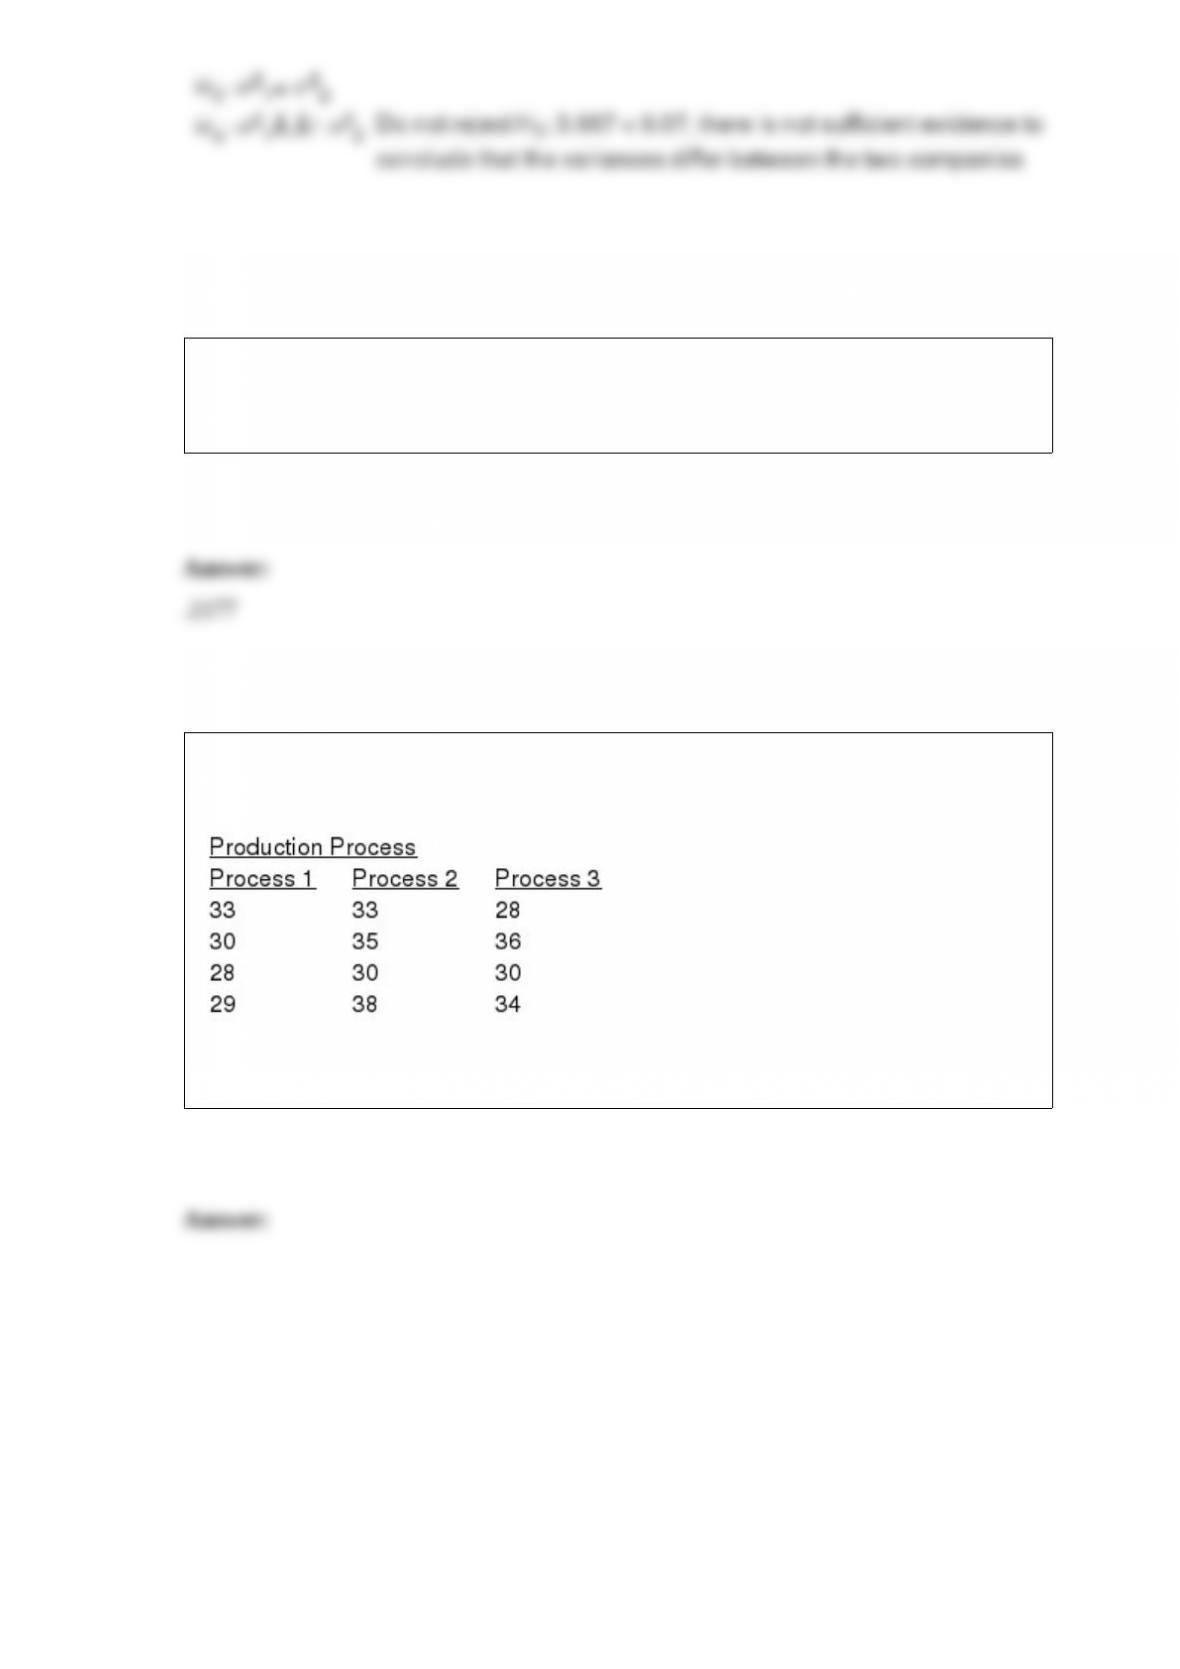
Individuals were randomly assigned to three different production processes. The hourly
units of production for the three processes are shown below.
Use Excel with = 0.05 to determine if there is a significant difference in the mean
hourly units of production for the three types of production processes.

A sample of 25 patients in a doctor’s office showed that they had to wait an average of
35 minutes with a standard deviation of 10 minutes before they could see the doctor.
Provide a 98% confidence interval estimate for the average waiting time of all the
patients who visit this doctor. Assume the population of waiting times is normally
distributed.
The following information regarding the number of semester hours taken from random
samples of day and evening students is provided.
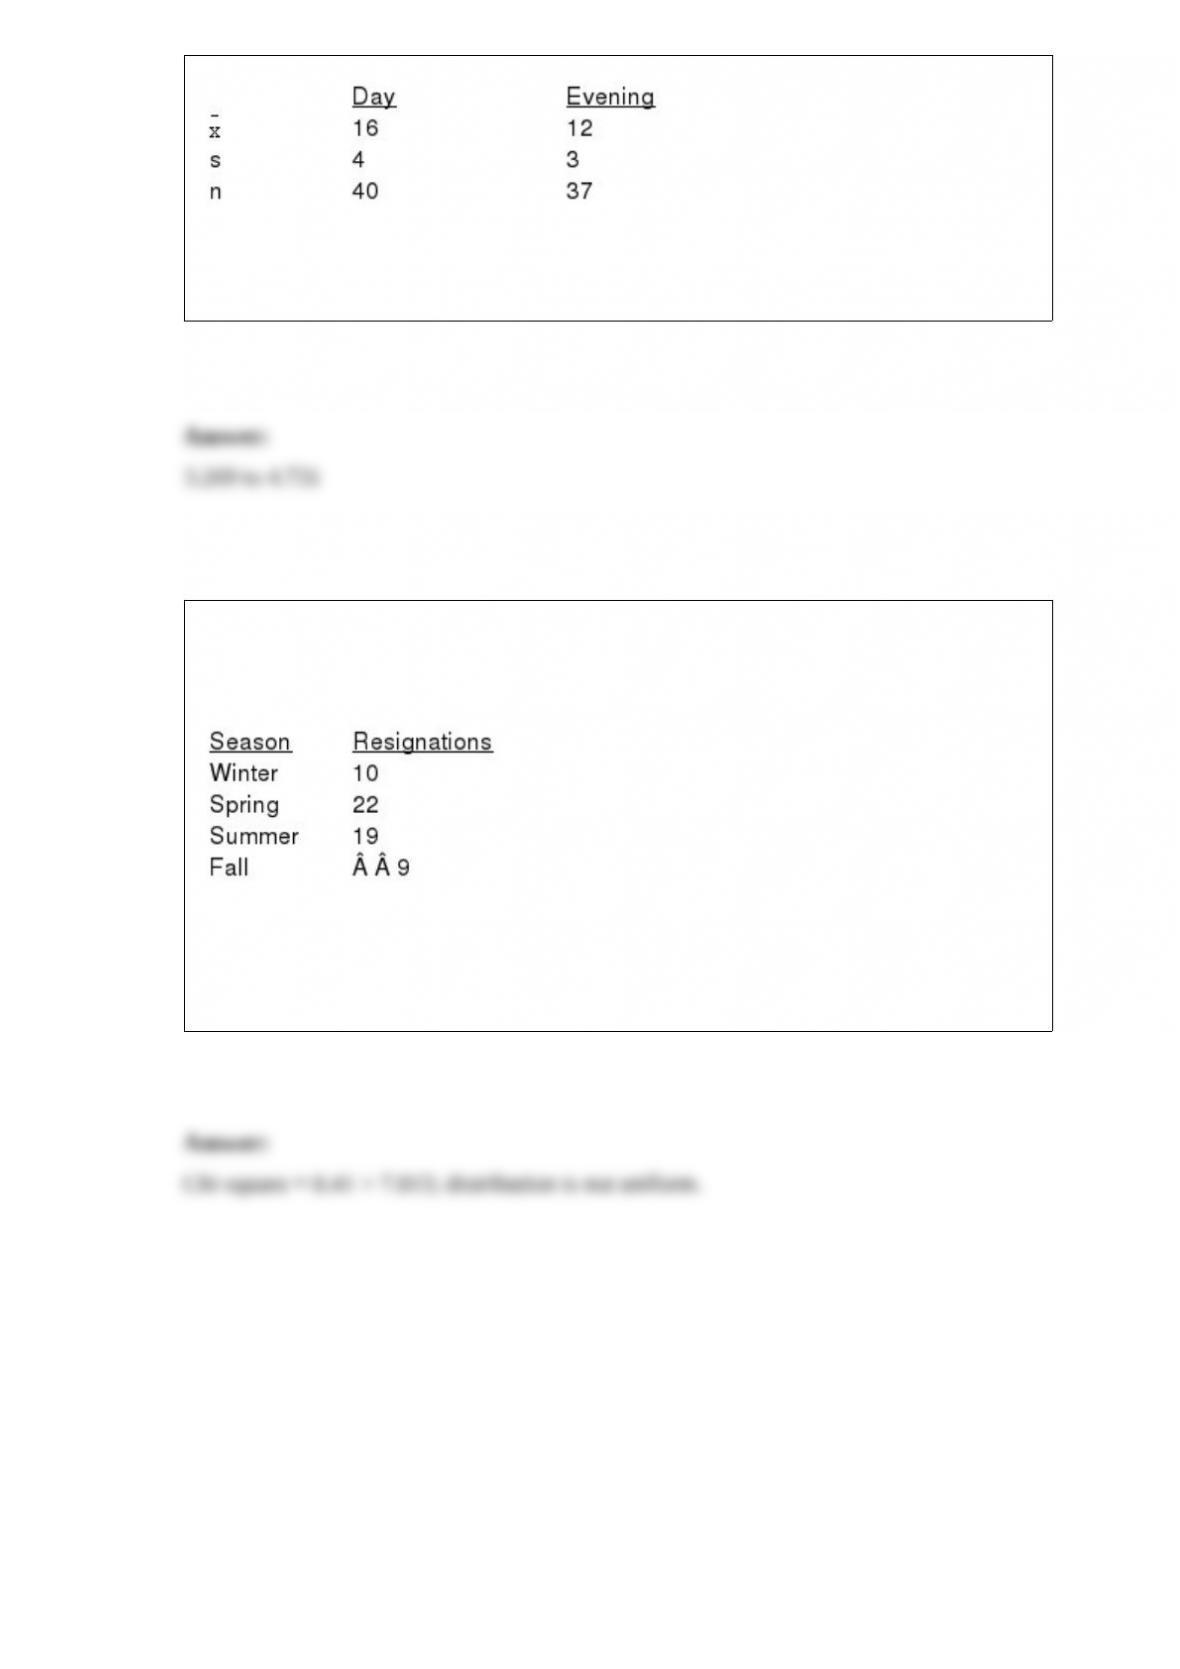
Develop a 95% confidence interval estimate for the difference between the mean
semester hours taken by the two groups of students.
The personnel department of a large corporation reported sixty resignations during the
last year. The following table groups these resignations according to the season in
which they occurred:
Test to see if the number of resignations is uniform over the four seasons.
Let = 0.05.