
The manager of University Credit Union (UCU) is concerned about checking account
transaction discrepancies. Customers are bringing transaction errors to the attention of
the bank’s staff several months after they occur. The manager would like to know what
proportion of his customers balance their checking accounts within 30 days of receiving
a transaction statement from the bank.
Using random sampling, 400 checking account customers are contacted by telephone
and asked if they routinely balance their accounts within 30 days of receiving a
statement. 271 of the 400 customers respond Yes.
a. Develop a 95% confidence interval estimate for the proportion of the population of
checking account customers at UCU that routinely balance their accounts in a timely
manner.
b. Suppose UCU wants a 95% confidence interval estimate of the population proportion
with a margin of error of E = .025. How large a sample size is needed?
Exhibit 13-4
In a completely randomized experimental design involving five treatments, thirteen
observations were recorded for each of the five treatments. The following information
is provided.
SSTR = 200 (Sum Square Between Treatments)
SST = 800 (Total Sum Square)
Refer to Exhibit 13-4. The number of degrees of freedom corresponding to within
treatments is
a. 60
b. 59
c. 5
d. 4
Computing the necessary sample size for an interval estimate of a population proportion
requires a planning value for p-bar. In case of any uncertainty about an appropriate
planning value, we know the value that will provide the largest sample size
recommendation is
a. .10
b. .50
c. .90
d. 1.0
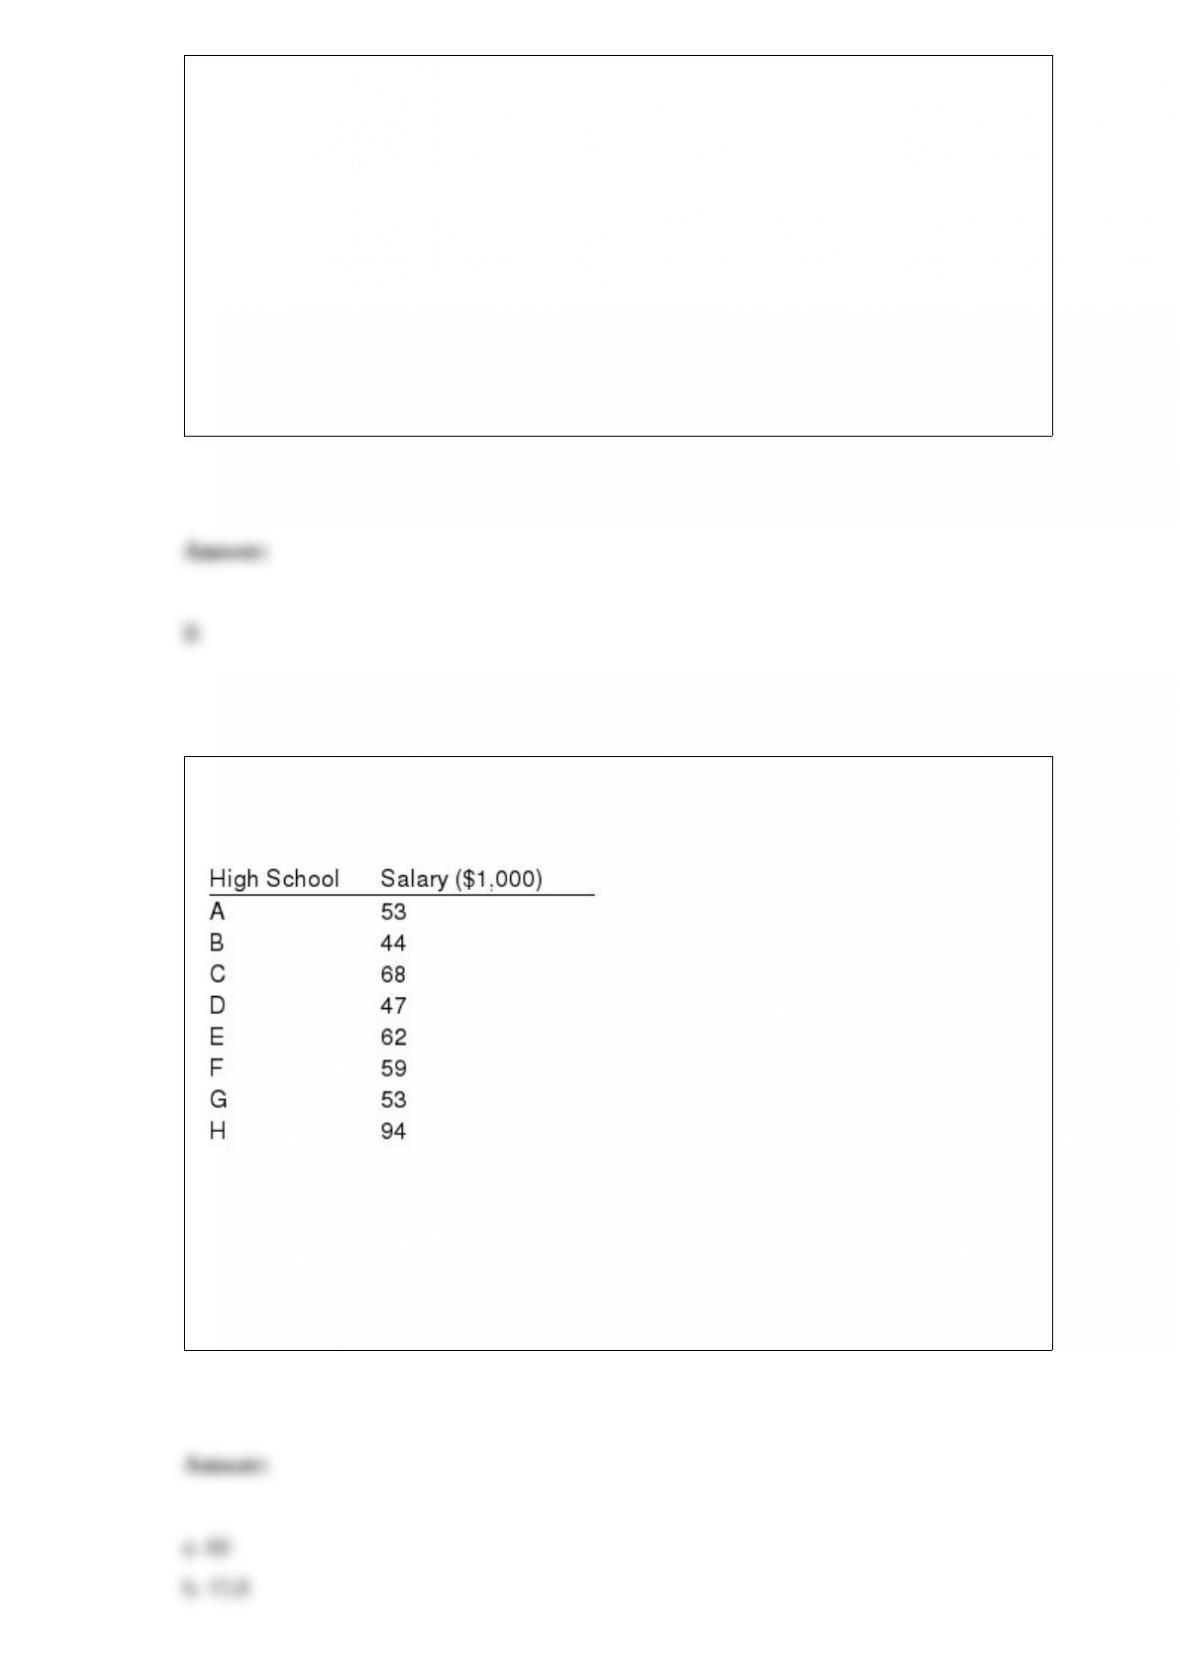
The following data show the yearly salaries of football coaches at some public high
schools.
For the above sample, determine the following measures.
a. The mean yearly salary
b. The standard deviation
c. The mode
d. The median
e. The 70th percentile
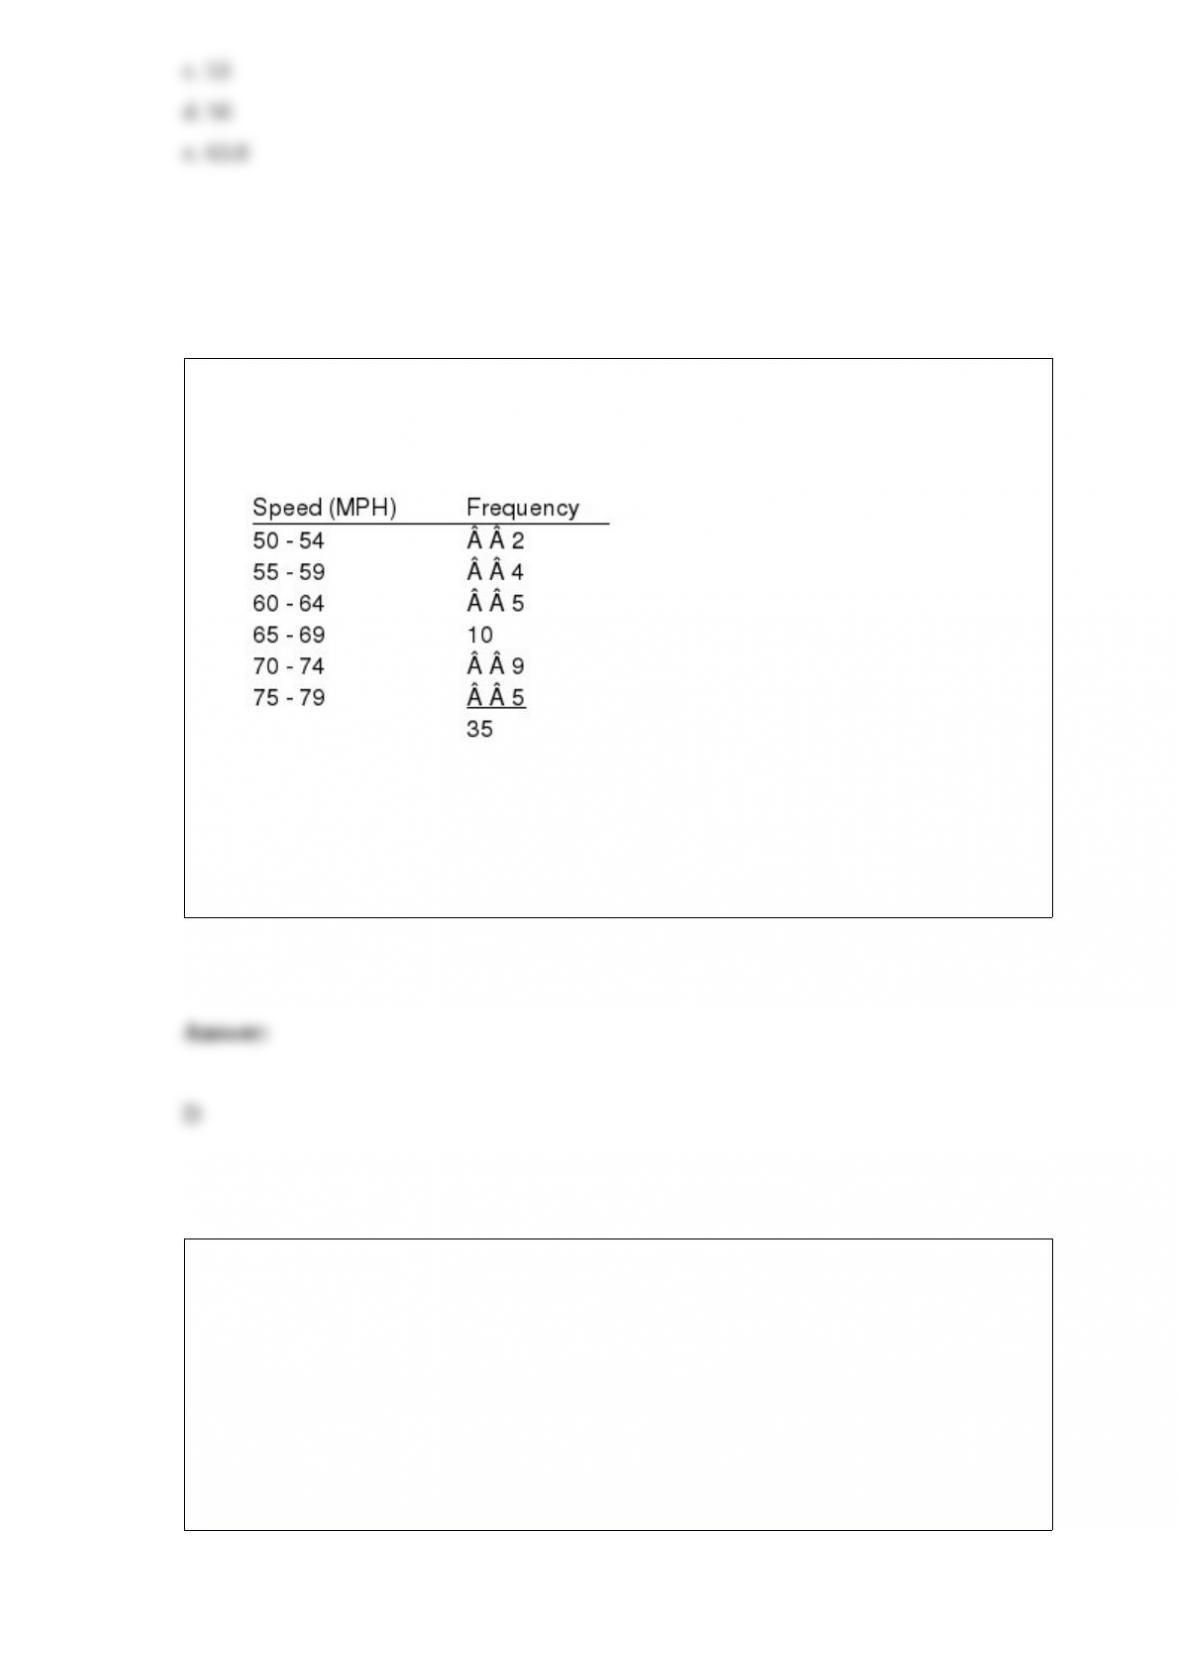
Exhibit 3-4
The following is the frequency distribution for the speeds of a sample of automobiles
traveling on an interstate highway.
Refer to Exhibit 3-4. The variance is
a. 6.969
b. 7.071
c. 48.570
d. 50.000
Revised probabilities of events based on additional information are
a. joint probabilities
b. posterior probabilities
c. marginal probabilities
d. complementary probabilities

The following probability model describes the number of snowstorms for Washington,
D.C. for a given year:
The probability of 7 or more snowstorms in a year is 0.
a. What is the probability of more than 2 but less than 5 snowstorms?
b. Given this a particularly cold year (in which 2 snowstorms have already been
observed), what is the conditional probability that 4 or more snowstorms will be
observed?
c. If at the beginning of winter there is a snowfall, what is the probability of at least one
more snowstorm before winter is over?
Eight observations were selected from each of 3 populations, and an analysis of
variance was performed on the data. The following are part of the results.
Using = .05, test to see if there is a significant difference among the means of the

three populations. The sample sizes for the three treatments are equal.
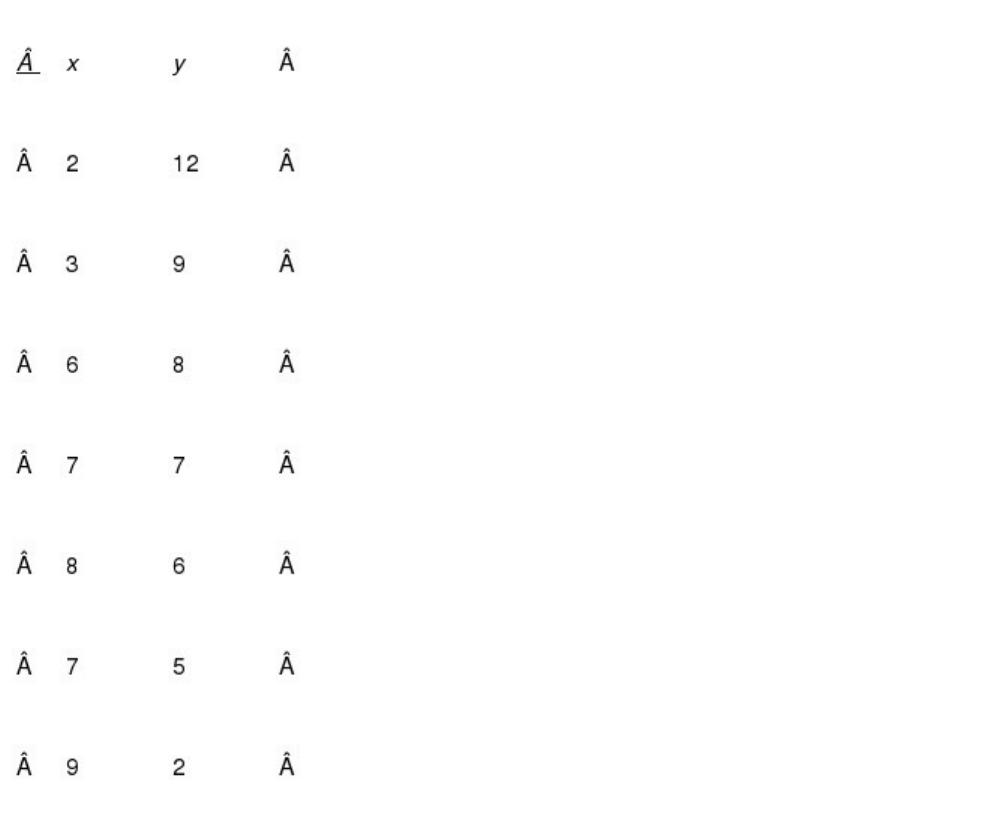
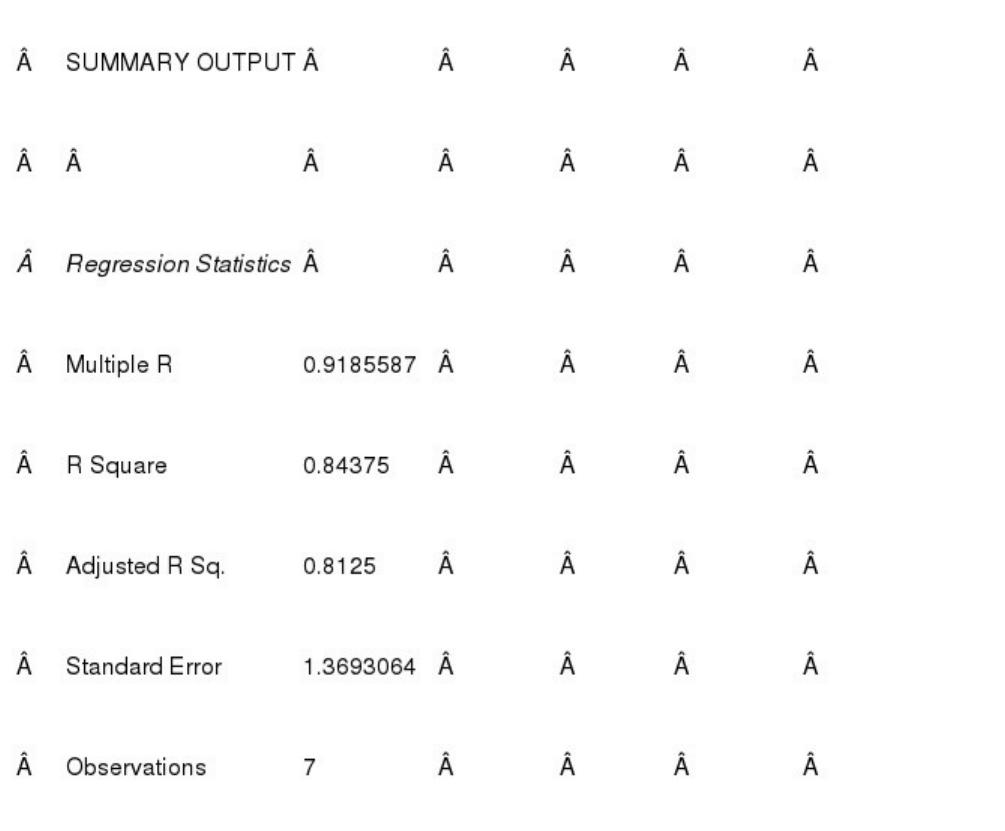
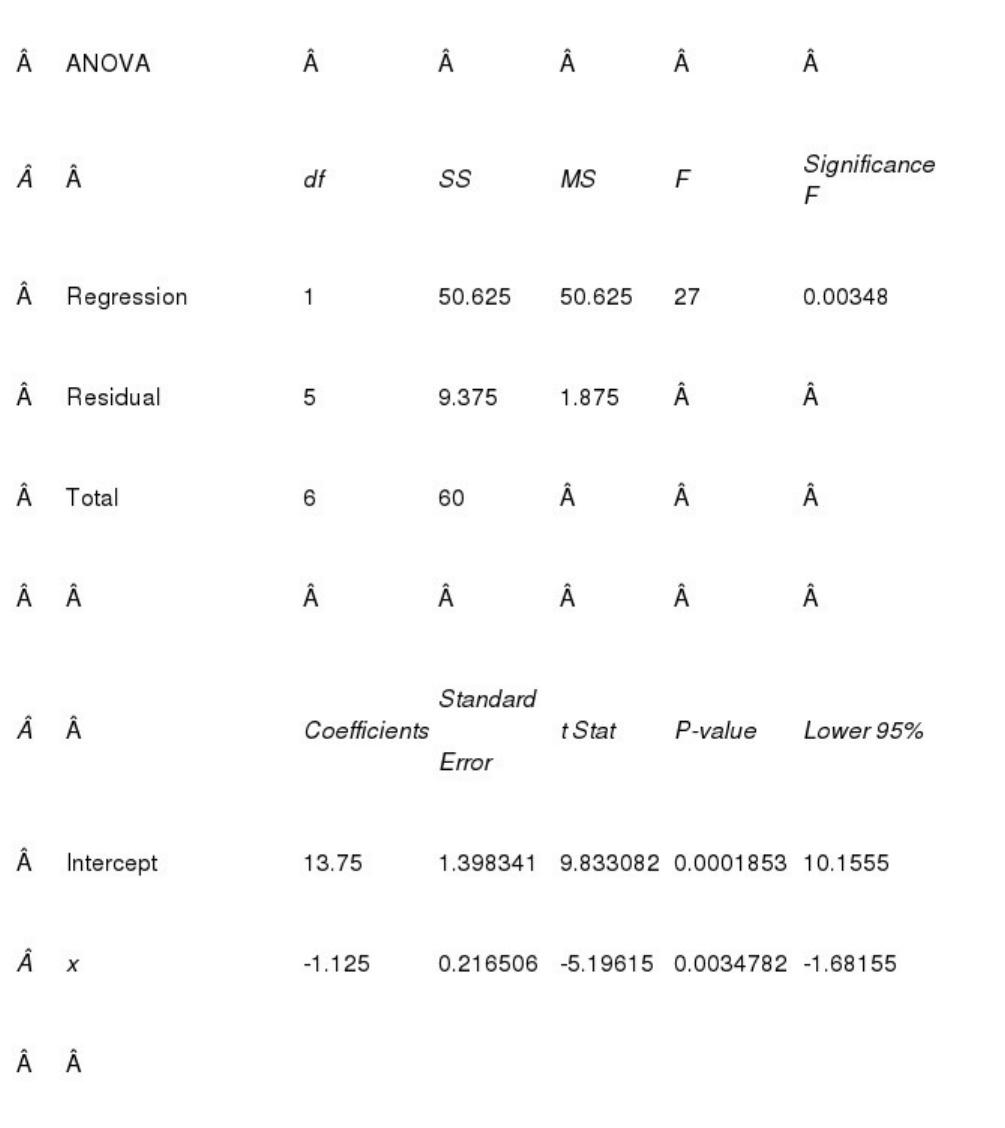
Given below are seven observations collected in a regression study on two variables, x
(independent variable) and y (dependent variable). Use Excel’s Regression Tool to
answer the following questions.
a. What is the estimated regression equation?
b. Perform a t test and determine whether or not x and y are related. Use 0.05.
c. Perform an F test and determine whether or not x and y are related. Use 0.05.
d. Find and interpret the coefficient of determination.

A line or arc connecting the nodes of a decision tree is called a(n)
a. junction
b. intersection
c. branch
d. node
Excel’s __________ function can be used to compute the variance of a discrete random
variable.
a. SUMPRODUCT
b. AVERAGE
c. MEDIAN
d. VAR

Which Excel function would not be appropriate to use when conducting a hypothesis
test for a population proportion?
a. NORM.S.DIST
b. COUNTIF
c. STDEV
d. All are appropriate.
The z value for a 97.8% confidence interval estimation is
a. 2.02
b. 1.96
c. 2.00
d. 2.29
Exhibit 5-10
The probability that Pete will catch fish on a particular day when he goes fishing is 0.8.
Pete is going fishing 3 days next week.
Refer to Exhibit 5-10. The probability that Pete will catch fish on one day or less is
a. .008
b. .096
c. .104
d. .8
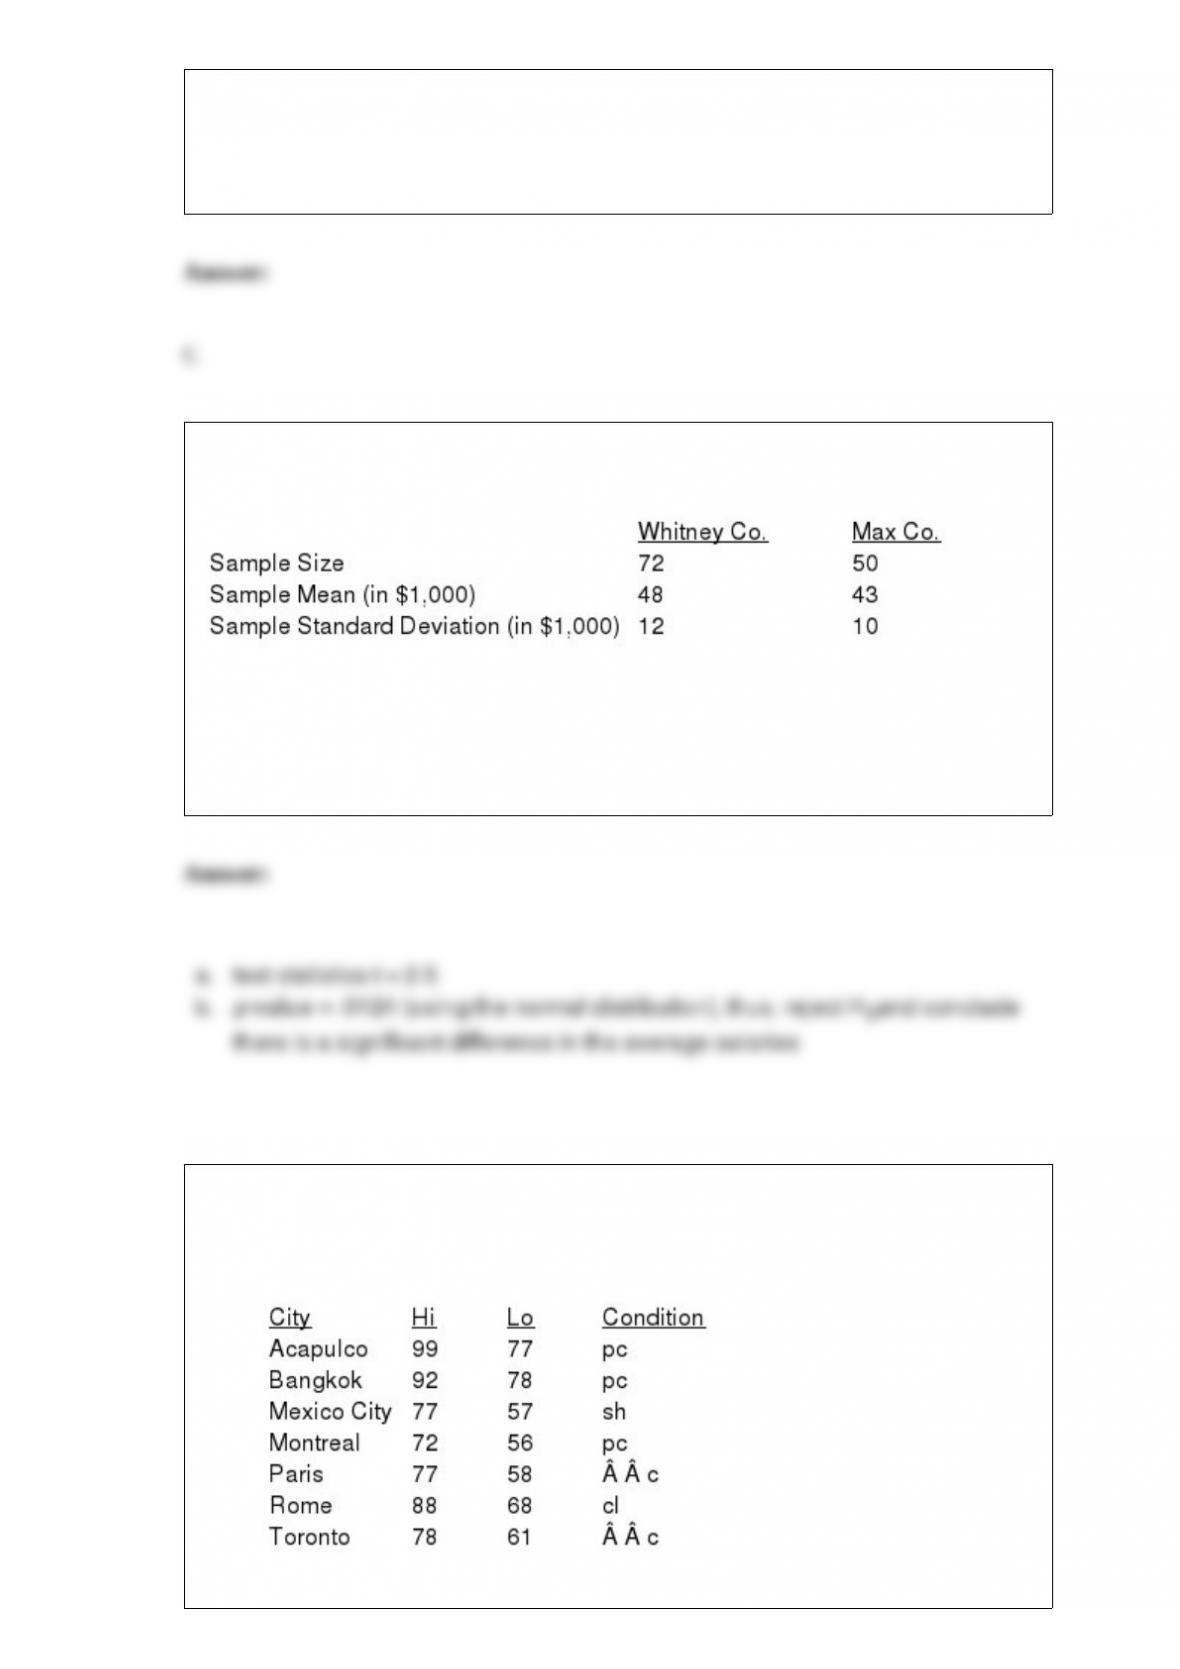
Independent random samples taken at two companies provided the following
information regarding annual salaries of the employees.
a. We want to determine whether or not there is a significant difference between the
average salaries of the employees at the two companies. Compute the test statistic.
b. Compute the p-value; and at 95% confidence, test the hypotheses.
The following shows the temperatures (high, low) and weather conditions in a given
Sunday for some selected world cities. For the weather conditions, the following
notations are used: c clear; cl cloudy; sh showers; pc partly cloudy.
a. How many elements are in this data set?
b. How many variables are in this data set?
c. How many observations are in this data set?
d. Name the scale of measurement for each of the variables.
e. Name the variables and indicate whether they are categorical or quantitative.
f. For which variables are arithmetic operations appropriate and for which are they not
appropriate?
Exhibit 11-8
Refer to Exhibit 11-8. The null hypothesis
a. should be rejected
b. should not be rejected
c. should be revised
d. None of these alternatives is correct.

Assume that you have a binomial experiment with p 0.4 and a sample size of 50. The
variance of this distribution is
a. 20
b. 12
c. 3.46
d. Not enough information is given to answer this question.
For the standard normal probability distribution, the area to the left of the mean is
a. -0.5
b. 0.5
c. any value between 0 to 1
d. 1
The manager of the service department of a local car dealership has noted that the
service times of a sample of 15 new automobiles has a standard deviation of 4 minutes.
A 95% confidence interval estimate for the variance of service times for all their new
automobiles is
a. 8.58 to 39.79
b. 4 to 16
c. 4 to 15
d. 1.64 to 1.96

Common types of data patterns that can be identified when examining a time series plot
include all of the following except
a. horizontal
b. vertical
c. seasonal
d. cyclical
Laura Naples, Manager of Heritage Inn, periodically collects and tabulates
information about a sample of the hotel’s overnight guests. This information
aids her in pricing and scheduling decisions she must make. The table below
lists data on ten randomly selected hotel registrants, collected as the registrants
checked out. The data listed are:
•Number of people in the group
•Hotel’s shuttle service used: yes or no
•Total telephone charges incurred
•Reason for stay: business or personal
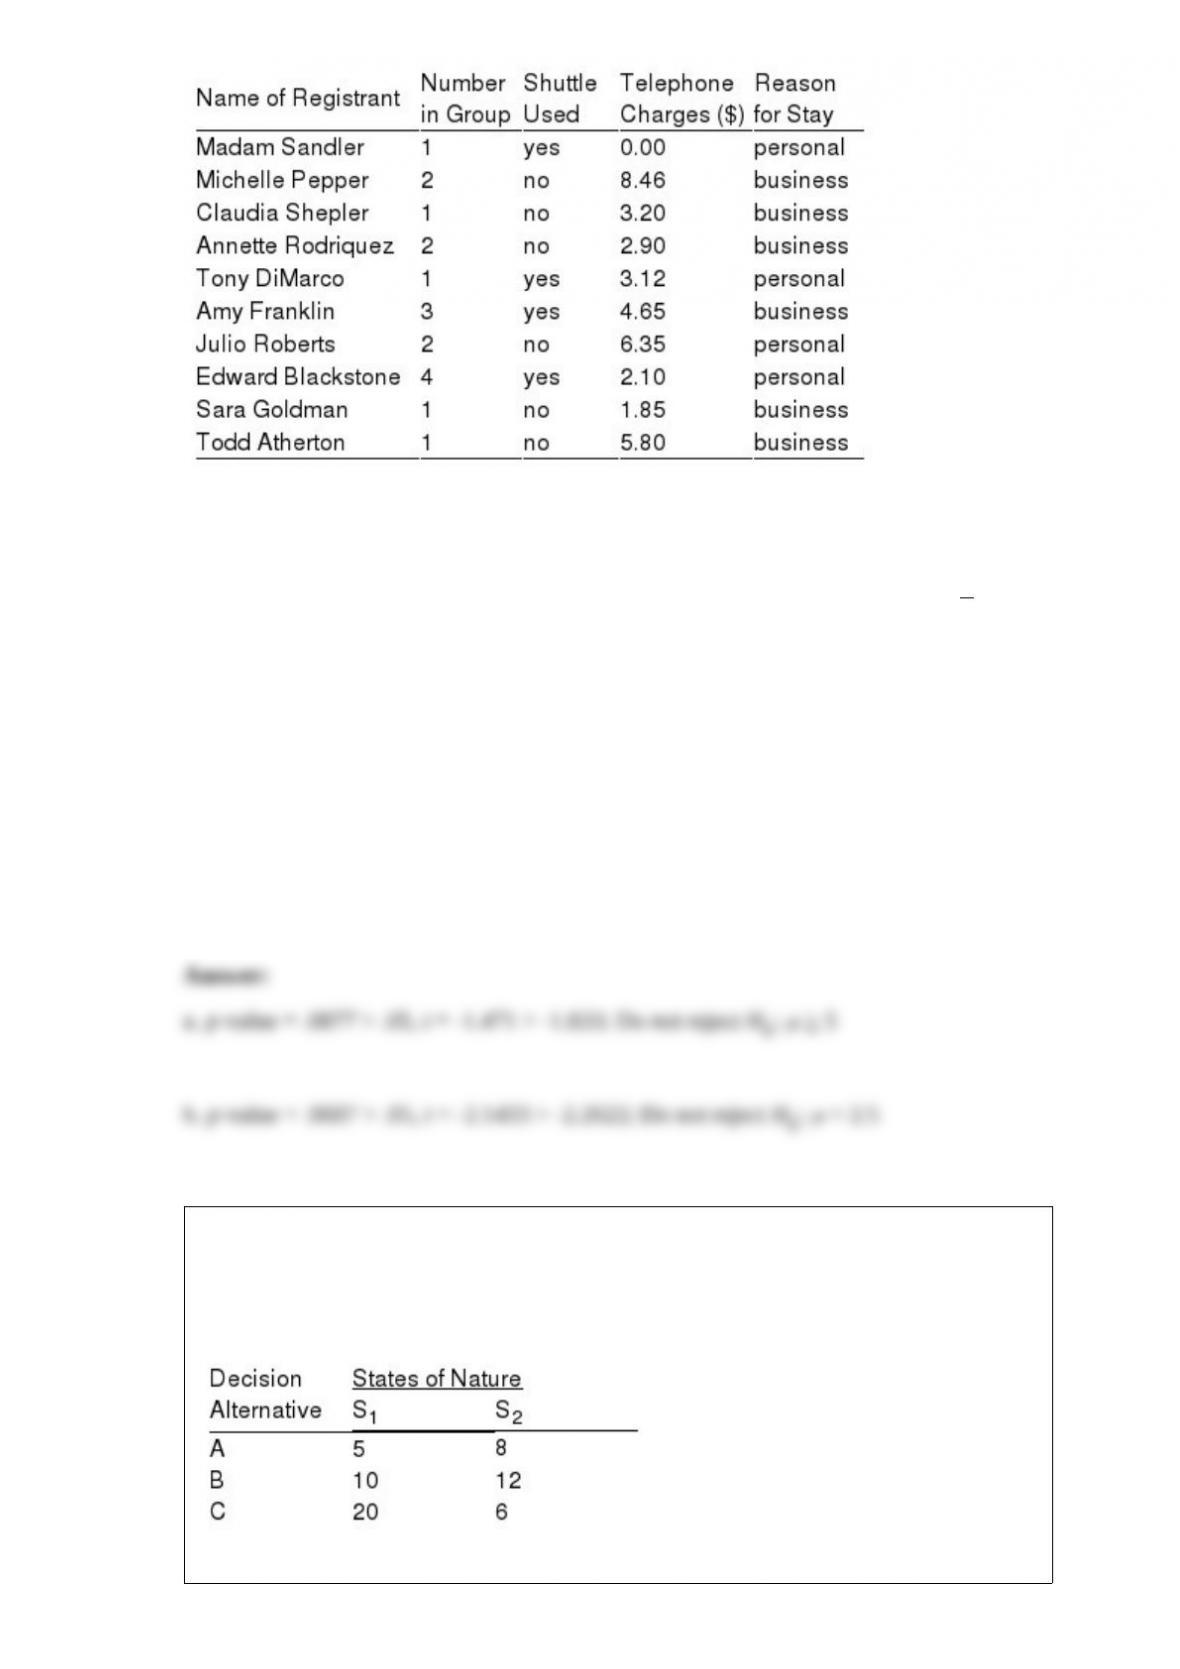
a. Before cell telephones became so common, the average telephone charge per registered
group was at least $5.00. Laura suspects that the average has dropped. Test H0:
> 5 and
Ha:
< 5 using a .05 level of significance. Use both the critical value and p-value
approaches to hypothesis testing.
b. In the past, Laura has made some important managerial decisions based on the
assumption that the average number of people in a registered group is 2.5. Now she
wonders if the assumption is still valid. Test the assumption with a = .05 and use both the
critical value and p-value approaches.
Exhibit 20-1
Below you are given a payoff table involving two states of nature and three decision
alternatives.

The probability of occurrence of S1 = 0.2.
Refer to Exhibit 20-1. The recommended decision alternative based on the expected
value is
a. A
b. B
c. C
d. All alternatives are the same.
Exhibit 15-2
A regression model between sales (y in $1,000), unit price (x1 in dollars) and television
advertisement (x2 in dollars) resulted in the following function:
= 7 – 3x1 + 5x2
For this model SSR = 3500, SSE = 1500, and the sample size is 18.
Refer to Exhibit 15-2. The multiple coefficient of determination for this problem is
a. 0.4368
b. 0.6960
c. 0.3040
d. 0.2289
Exhibit 3-1
A researcher has collected the following sample data.

Refer to Exhibit 3-1. The mean is
a. 5
b. 6
c. 7
d. 8
A student has to take 7 more courses before she can graduate. If none of the courses are
prerequisites to others, how many groups of three courses can she select for the next
semester?
The average starting salary of this year’s vocational school graduates is $35,000 with a
standard deviation of $5,000. Furthermore, it is known that the starting salaries are
normally distributed. What are the minimum and the maximum starting salaries of the
middle 95% of the graduates?
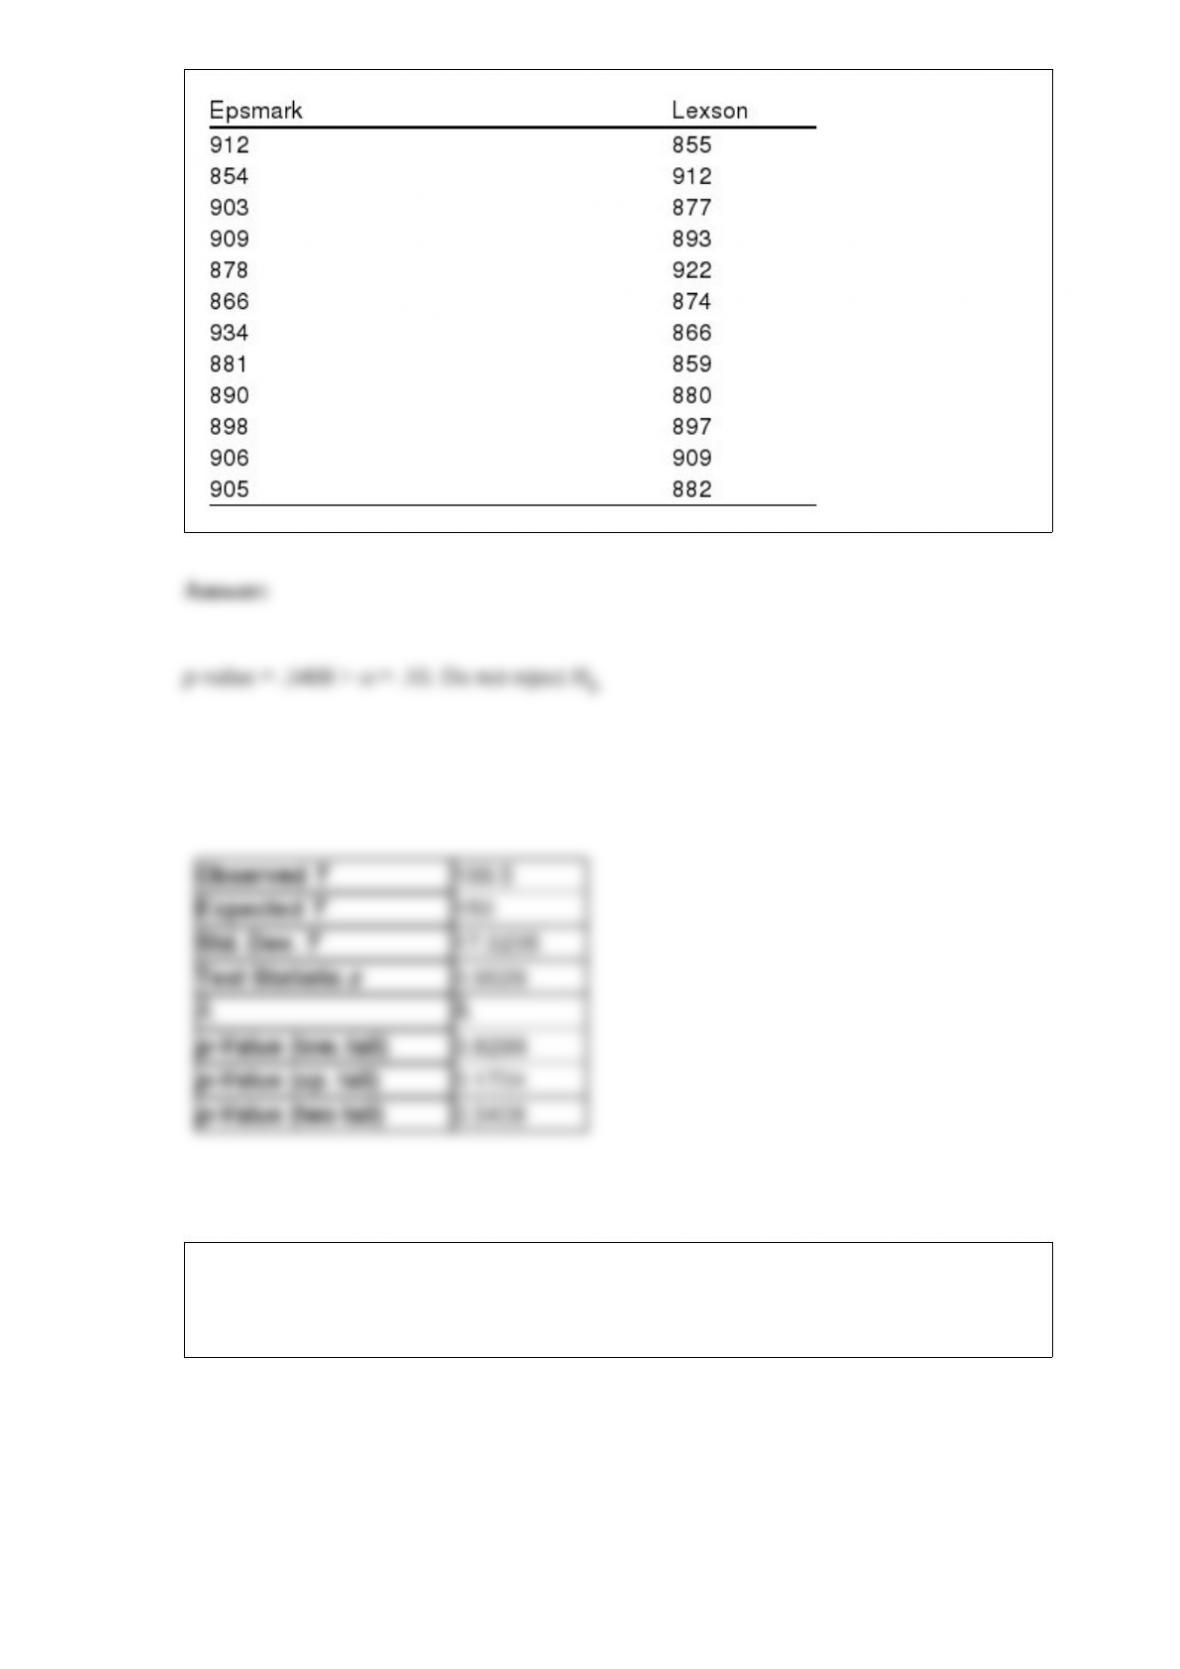
The print capacity of ink cartridges in computer printers is a concern to many buyers
due to the cost of cartridges. The observed print capacities (in number of pages) of
black ink cartridges in a sample of 12 Epsmark printers and a sample of 12 Lexson
printers are shown below. Do the data indicate, using
= .10, that a difference exists in
the print capacities associated with the two brands of printers?
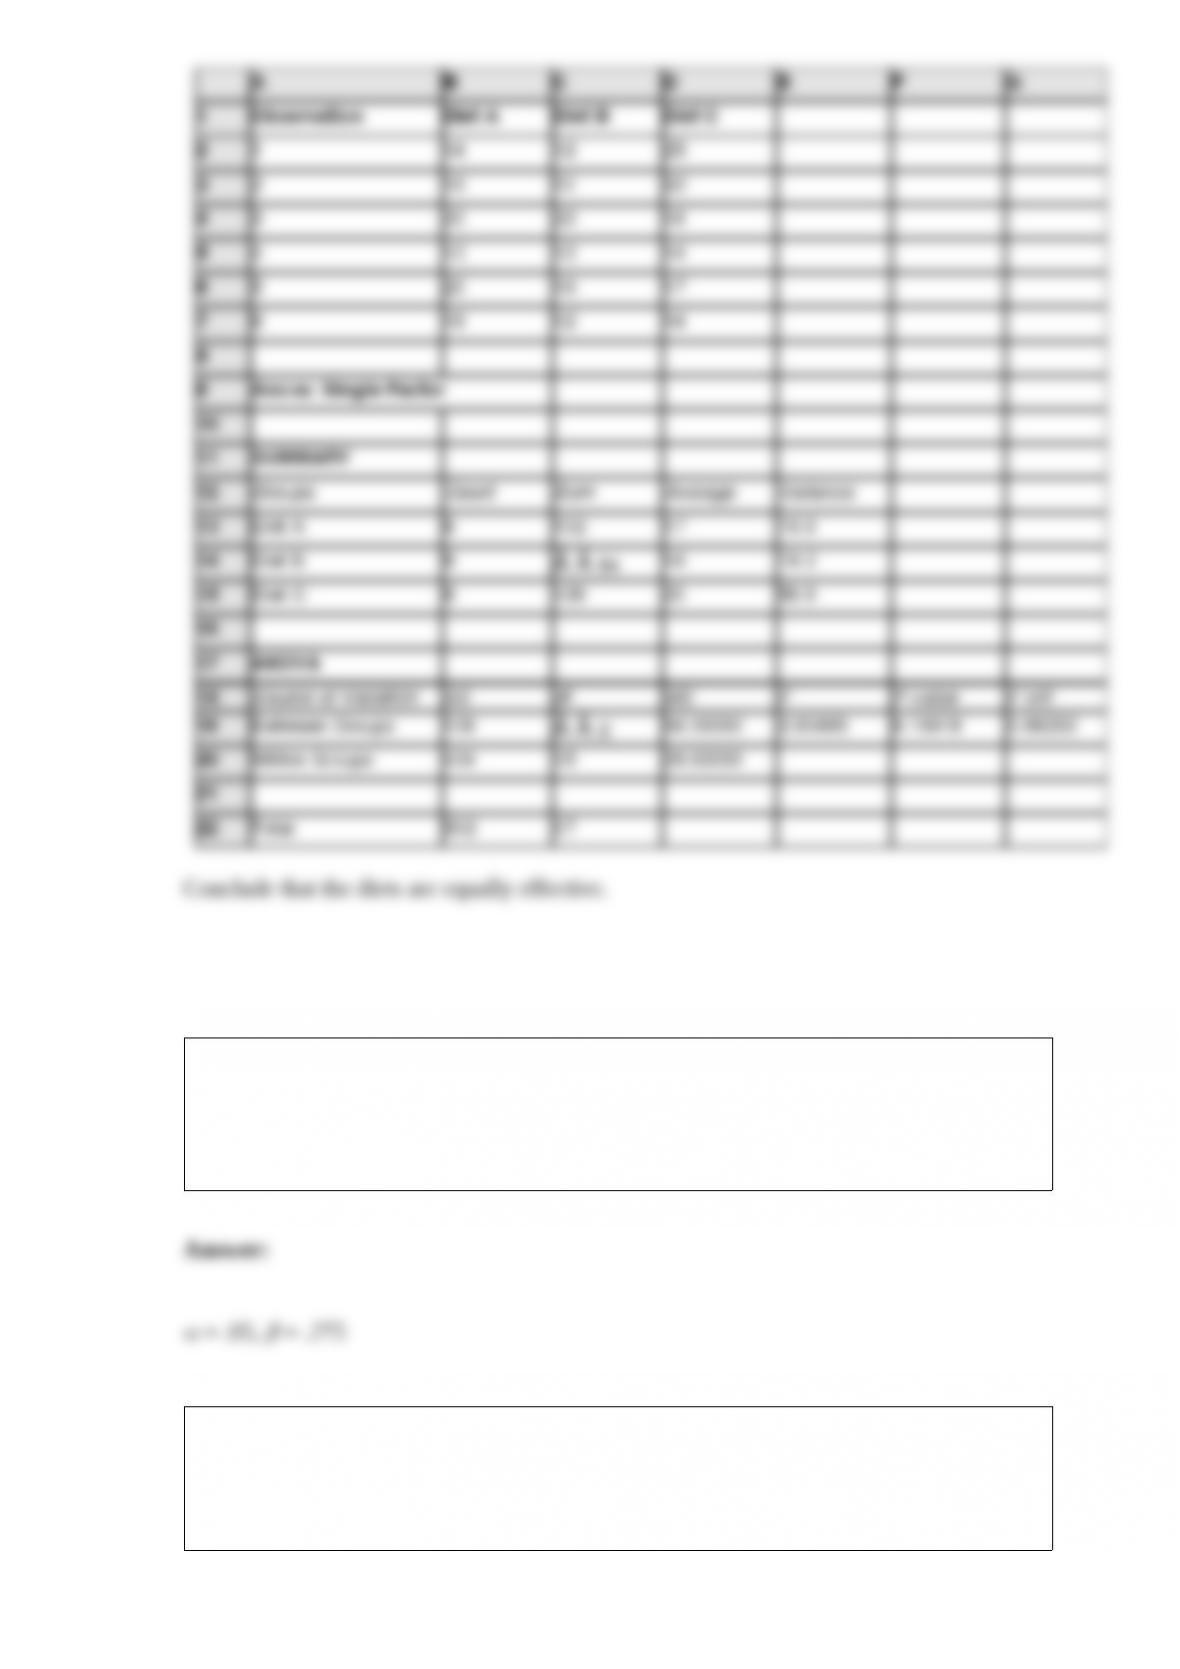
A dietician wants to see if there is any difference in the effectiveness of three diets.
Eighteen people, comprising a sample, were randomly assigned to the three diets.
Below you are given the total amount of weight lost in a month by each person.

What would you advise the dietician about the effectiveness of the three diets? Use
Excel and a .05 level of significance.
A U.S. manufacturer of digital video recorders purchases a circuit board from a
Taiwanese firm. The circuit boards are shipped in lots of 2000. The acceptance
sampling procedure uses 12 randomly selected circuit boards. The acceptance number is
1. If p0 is .03 and p1 is .20, what are the producer’s and consumer’s risks for this plan?
The monthly earnings of computer programmers are normally distributed with a mean
of $4,000. If only 1.7 percent of programmers have monthly incomes of less than
$2,834, what is the value of the standard deviation of the monthly earnings of the
computer programmers?
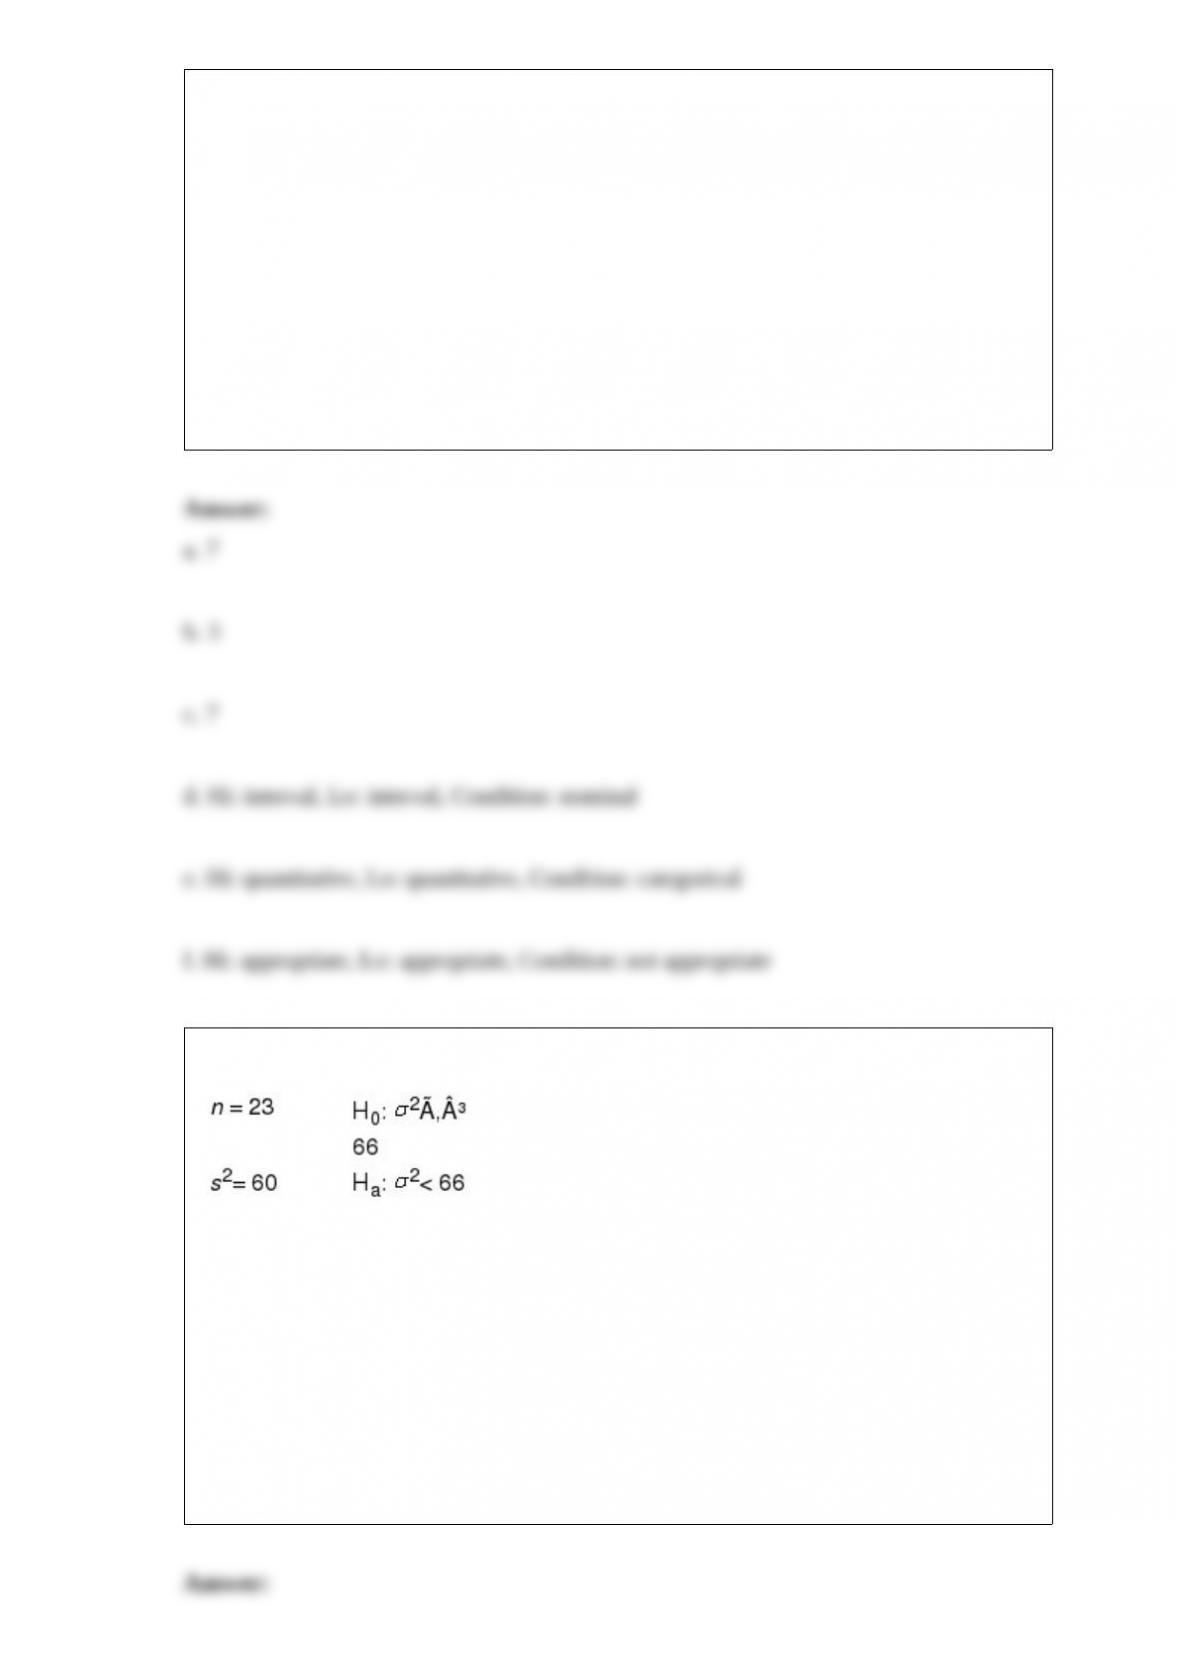
A sample of 61 items provided a sample mean of 932, a sample mode of 900, and a
sample standard deviation of 11. Test the following hypotheses using = 0.05. What is
your conclusion?
H0: 2 80
Ha: 2 > 80
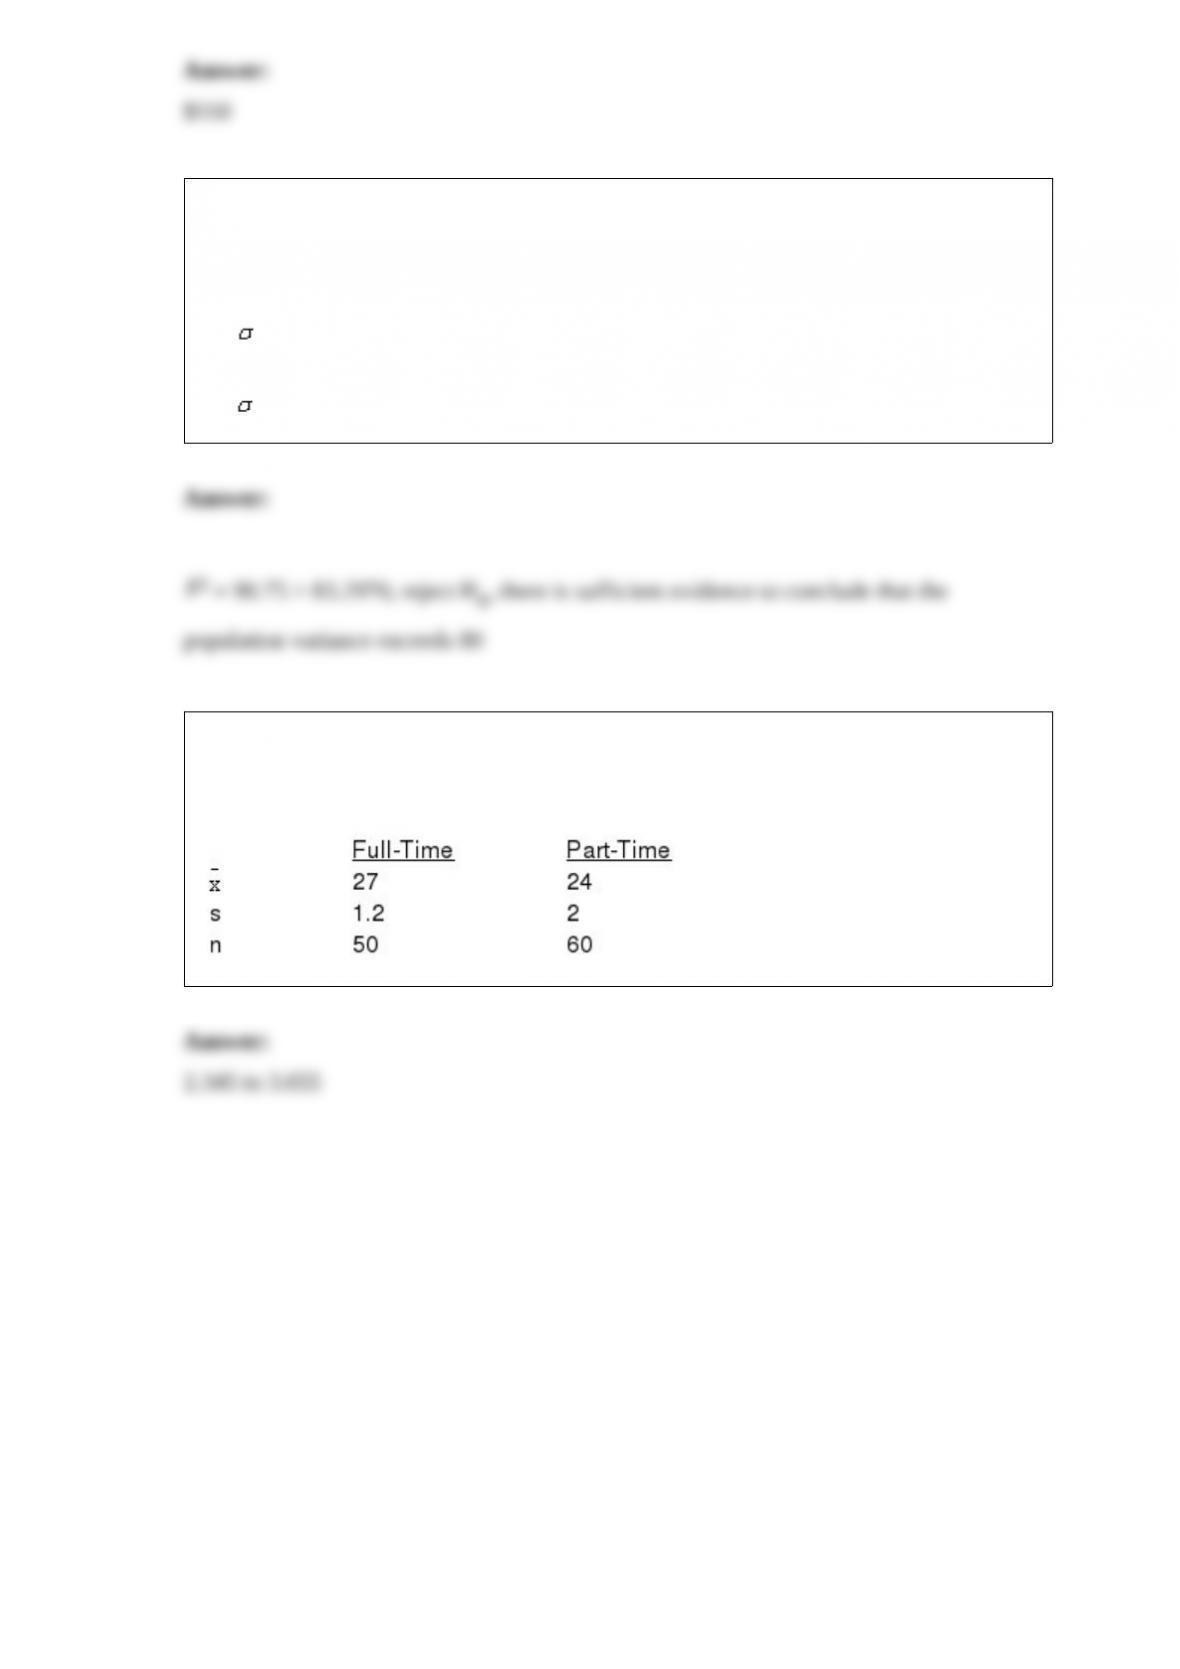
The following information regarding the ages of full-time and part-time students are
given. Using the following data, develop an interval estimate for the difference between
the mean ages of the two populations. Use a 5% level of significance.