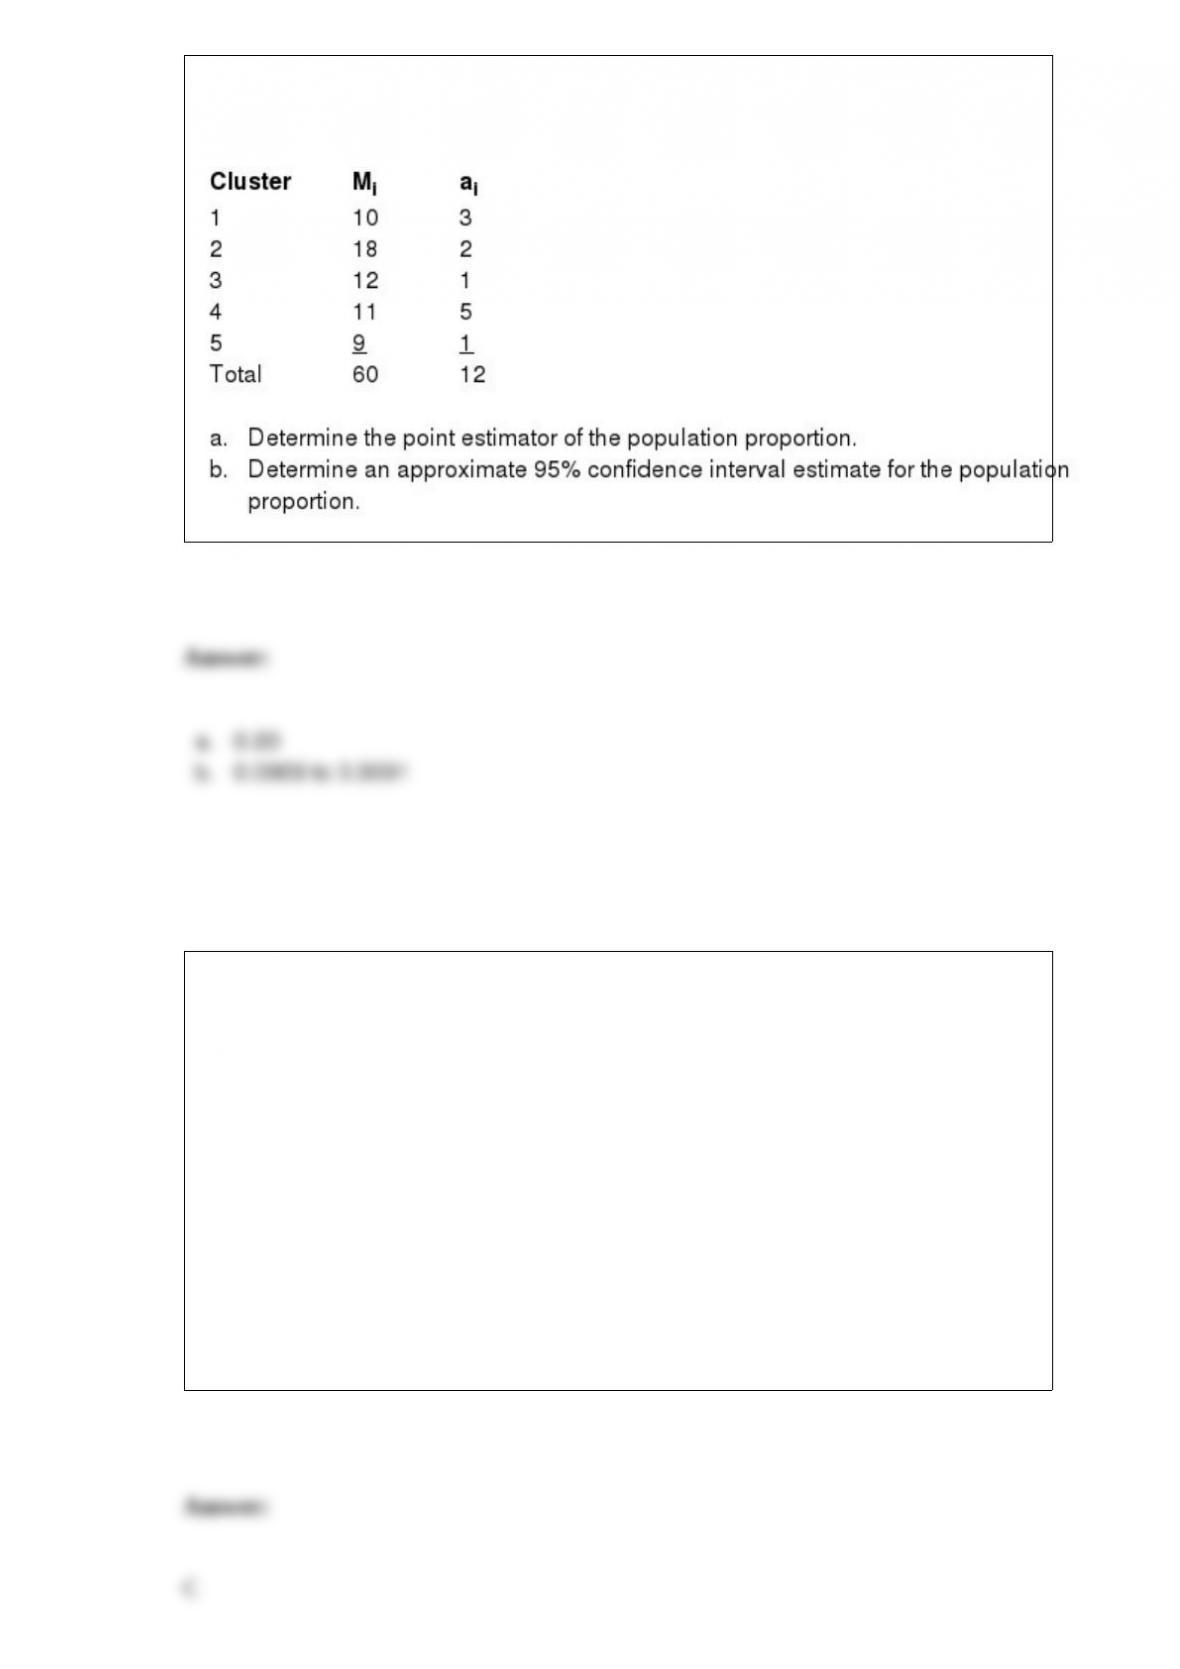
A sample of 5 clusters is to be taken from a population with N = 30 clusters and M =
420 clusters in the population. The values of Mi and ai are shown below.
Exhibit 5-8
The student body of a large university consists of 60% female students. A random
sample of 8 students is selected.
Refer to Exhibit 5-8. What is the random variable in this experiment?
a. the 60% of female students
b. the random sample of 8 students
c. the number of female students out of 8
d. the student body size
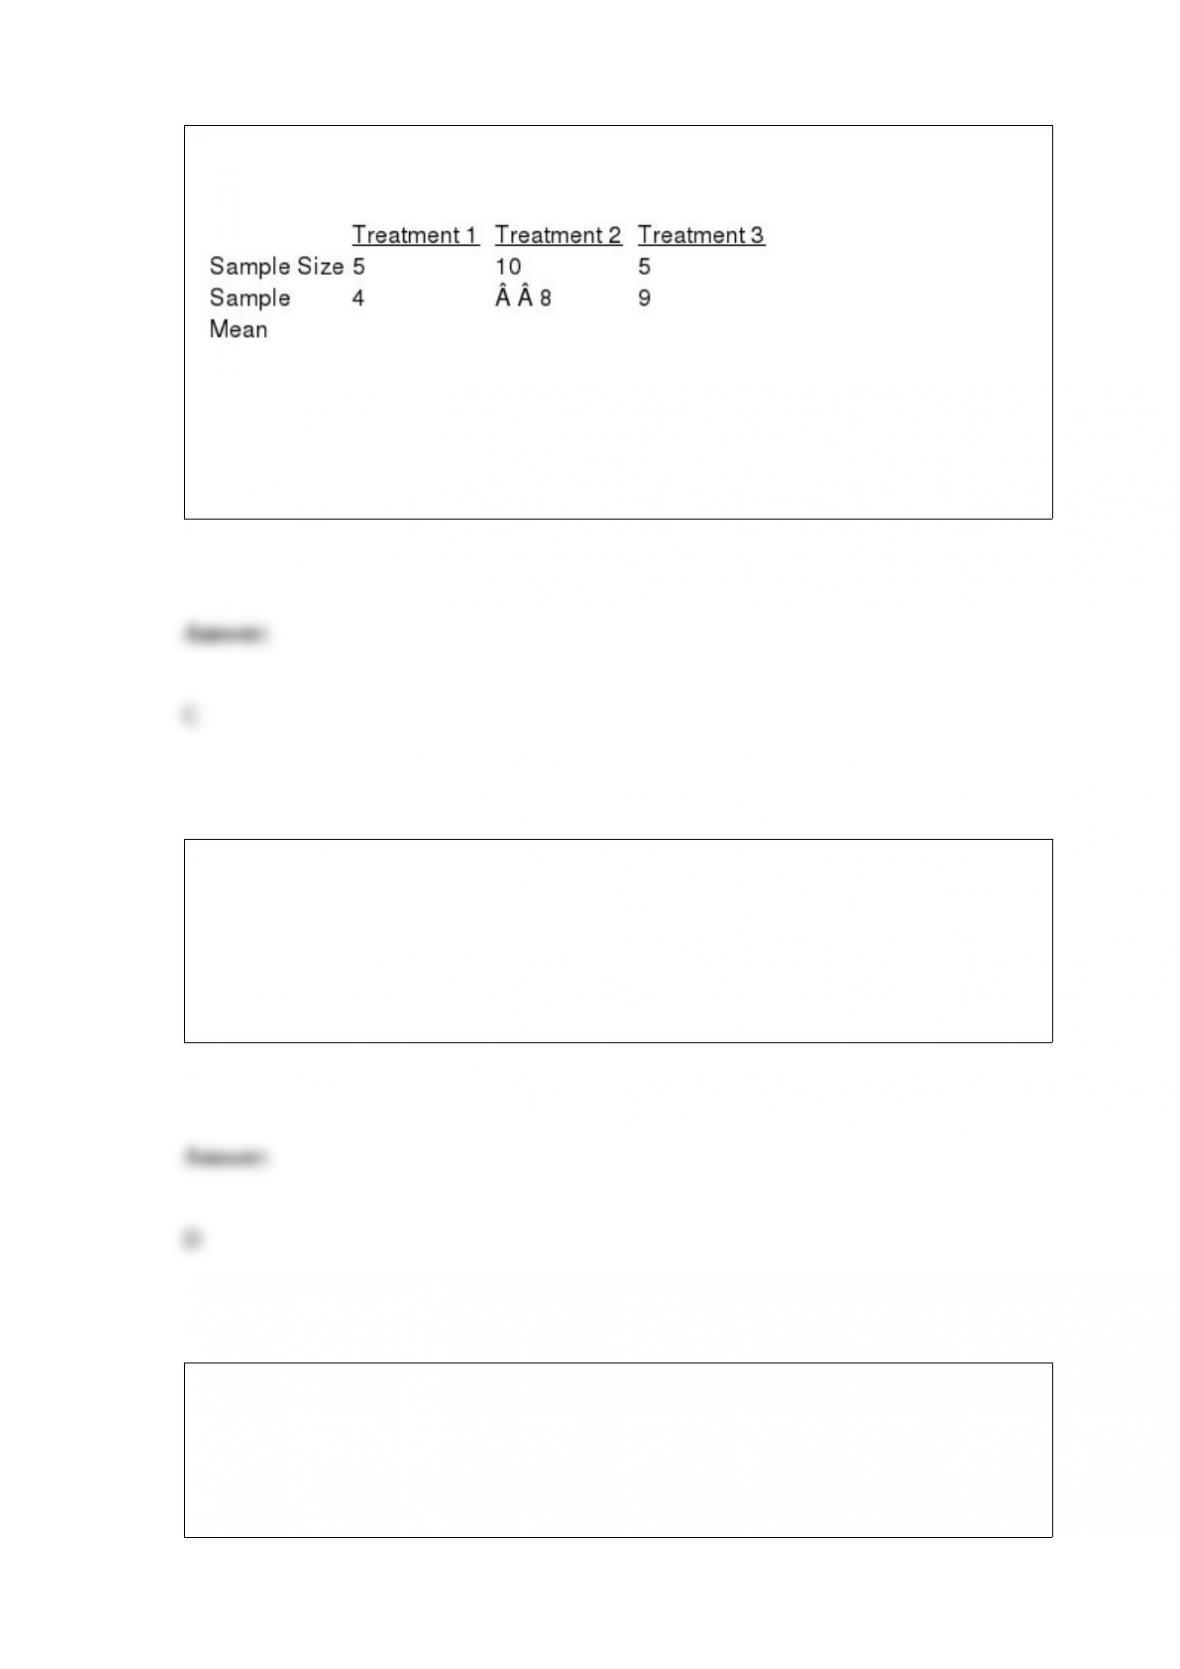
In a completely randomized design involving three treatments, the following
information is provided:
The overall mean for all the treatments is
a. 7.00
b. 6.67
c. 7.25
d. 4.89
The standard deviation of a sample of 100 observations equals 64. The variance of the
sample equals
a. 8
b. 10
c. 6,400
d. 4,096
An important measure of location for categorical data is the
a. mean
b. median
c. mode
d. margin
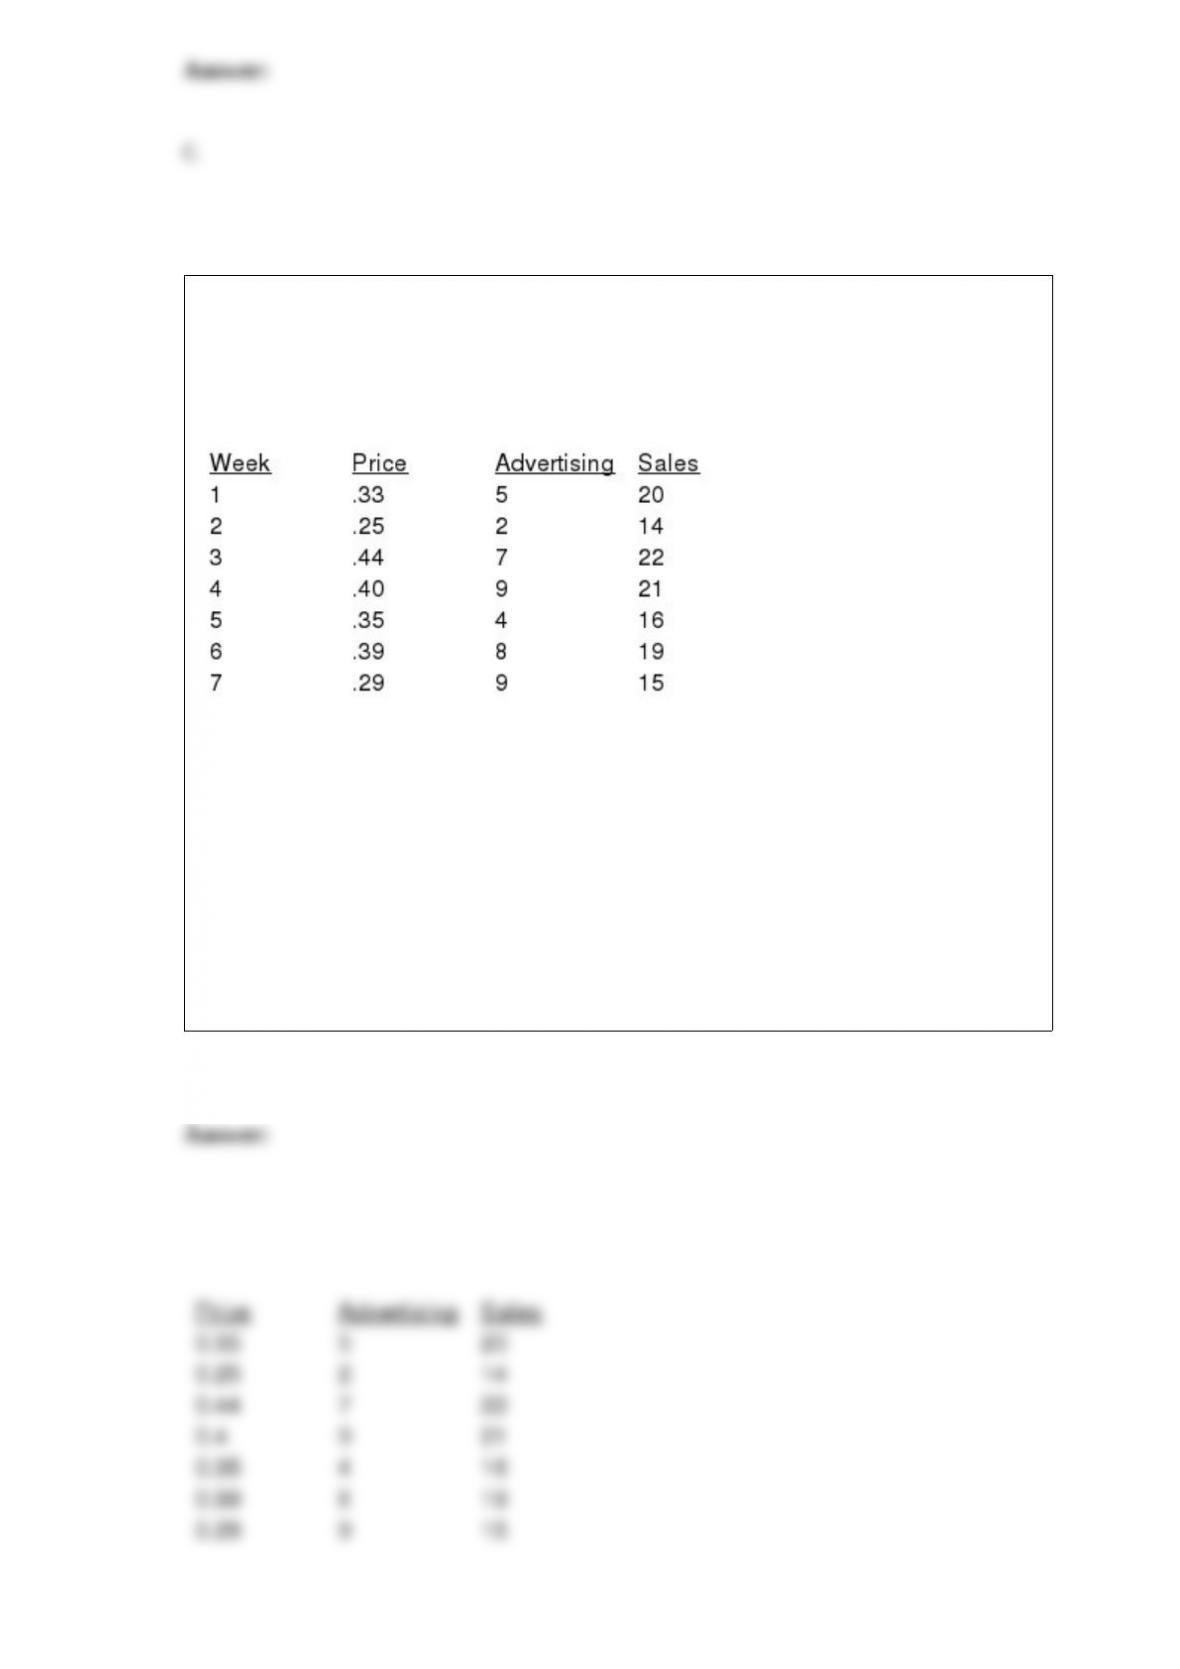
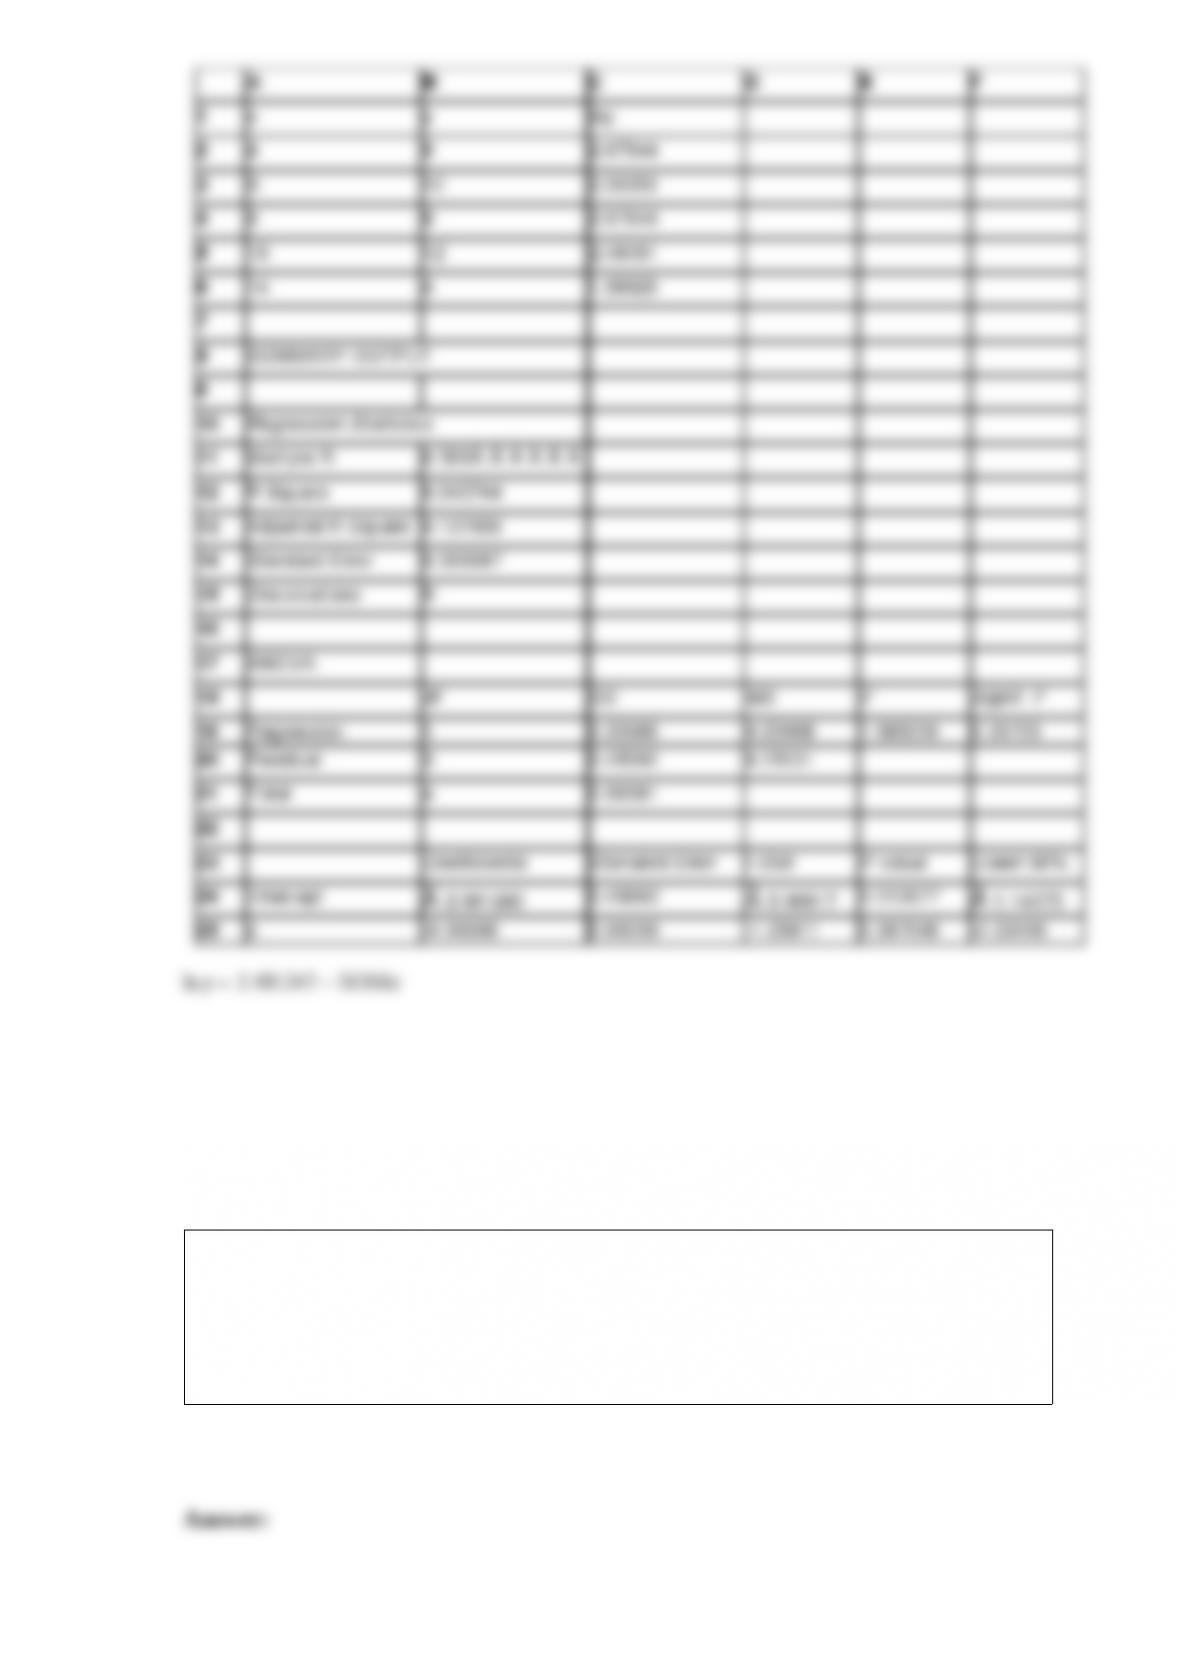
A company has recorded data on the weekly sales for its product (y), the unit price of
the competitor’s product (x1), and advertising expenditures (x2). The data resulting from
a random sample of 7 weeks follows. Use Excel’s Regression Tool to answer the
following questions.
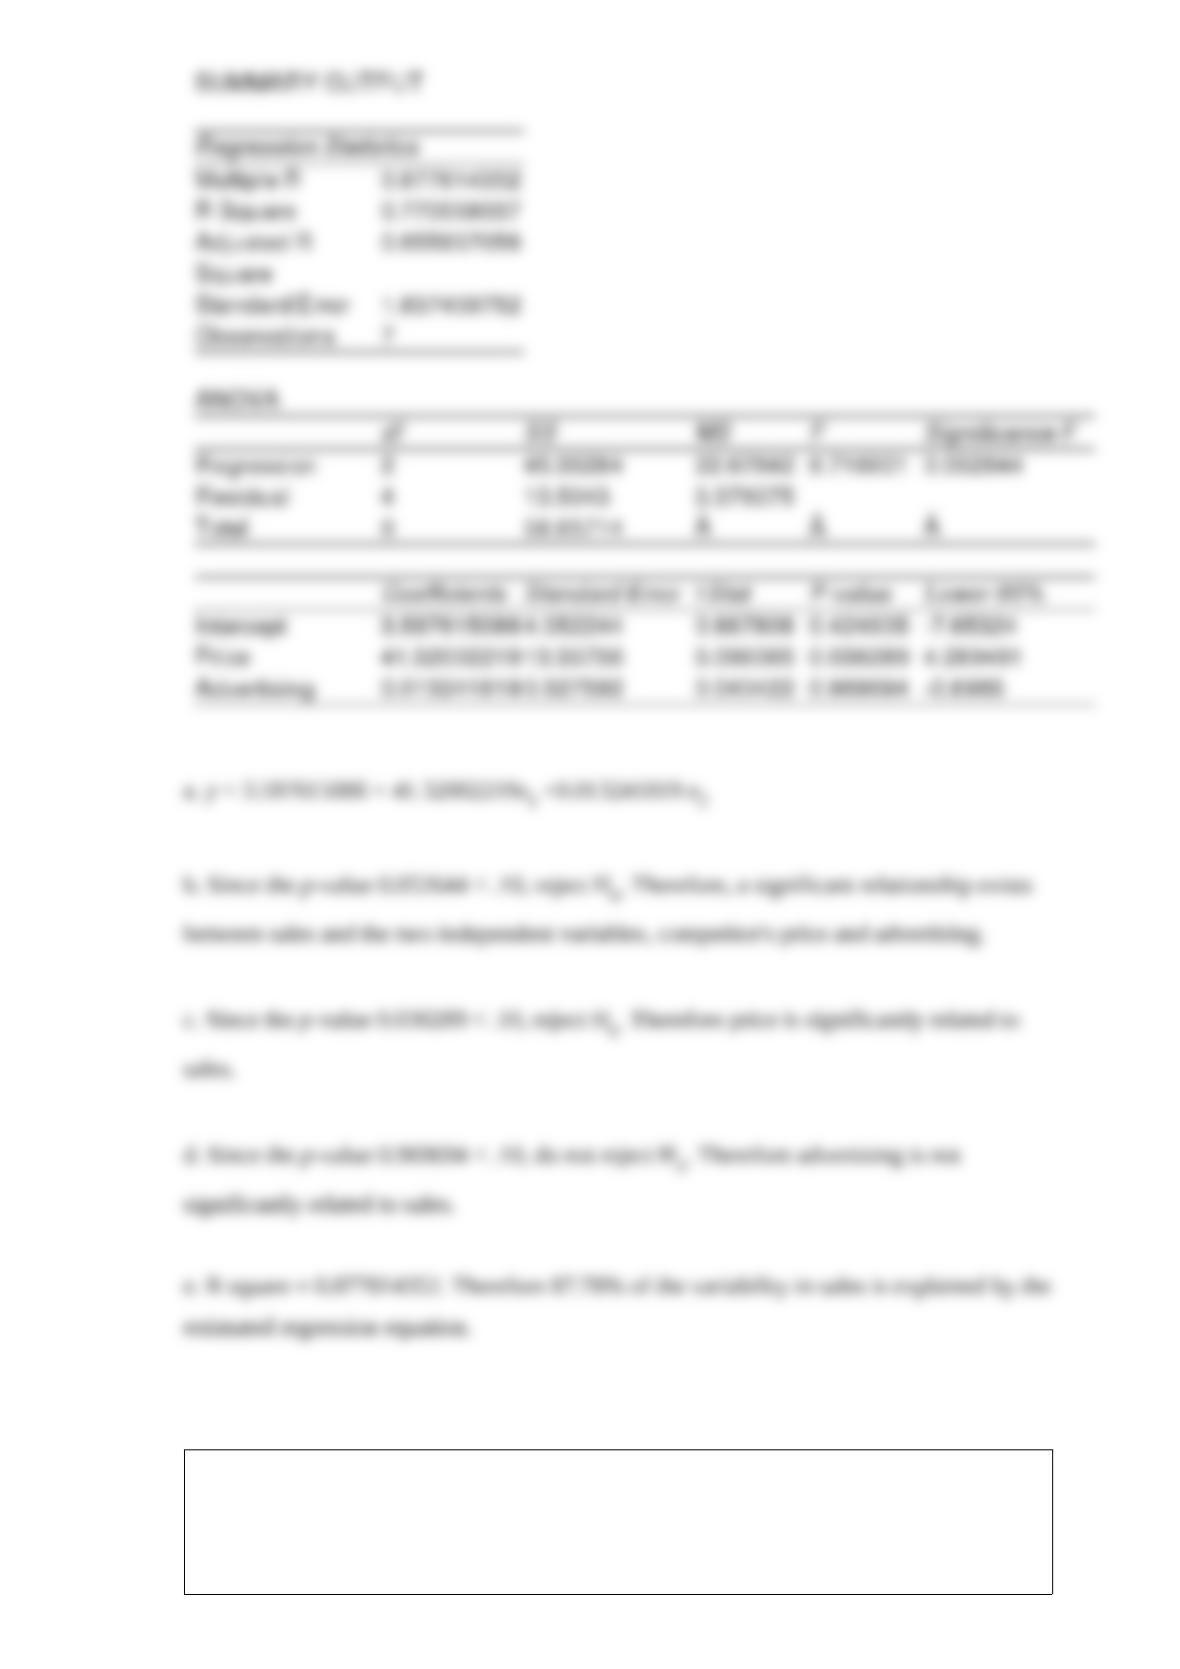
a. What is the estimated regression equation?
b. Determine whether the model is significant overall. Use = 0.10.
c. Determine if price is significantly related to sales. Use = 0.10.
d. Determine if advertising is significantly related to sales. Use = 0.10.
e. Find and interpret the multiple coefficient of determination.
Stratified random sampling is a method of selecting a sample in which
a. the sample is first divided into strata, and then random samples are taken from each
stratum
b. various strata are selected from the sample
c. the population is first divided into strata, and then random samples are drawn from
each stratum
d. None of these alternatives is correct.
Since a sample is a subset of the population, the sample mean
a. is always smaller than the mean of the population
b. is always larger than the mean of the population
c. must be equal to the mean of the population
d. can be larger, smaller, or equal to the mean of the population
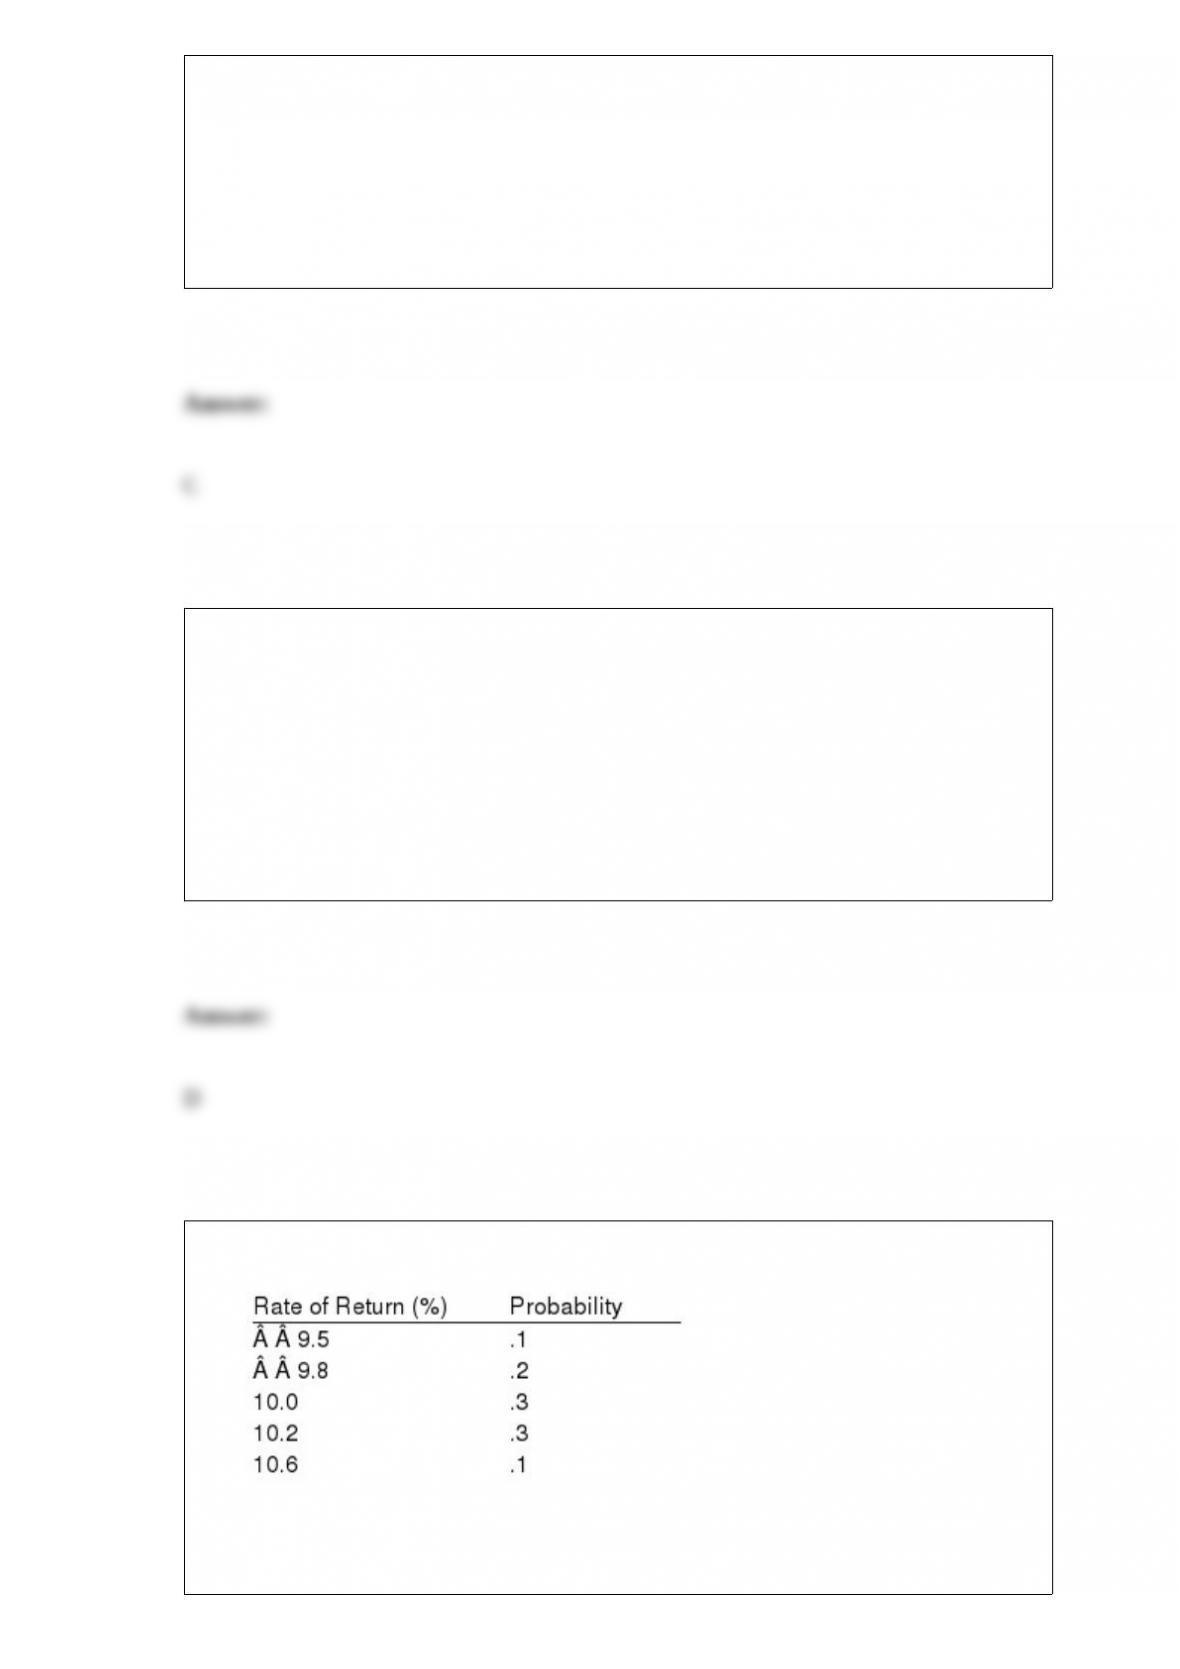
The probability distribution for the rate of return on an investment is
a. What is the probability that the rate of return will be at least 10%?
b. What is the expected rate of return?
c. What is the variance of the rate of return?
All the variables in a multiple regression analysis
a. must be quantitative
b. must be either quantitative or qualitative but not a mix of both
c. must be positive
d. None of these alternatives is correct.
The expected value of equals the mean of the population from which the sample is
drawn
a. only if the sample size is 30 or greater
b. only if the sample size is 50 or greater
c. only if the sample size is 100 or greater
d. for any sample size
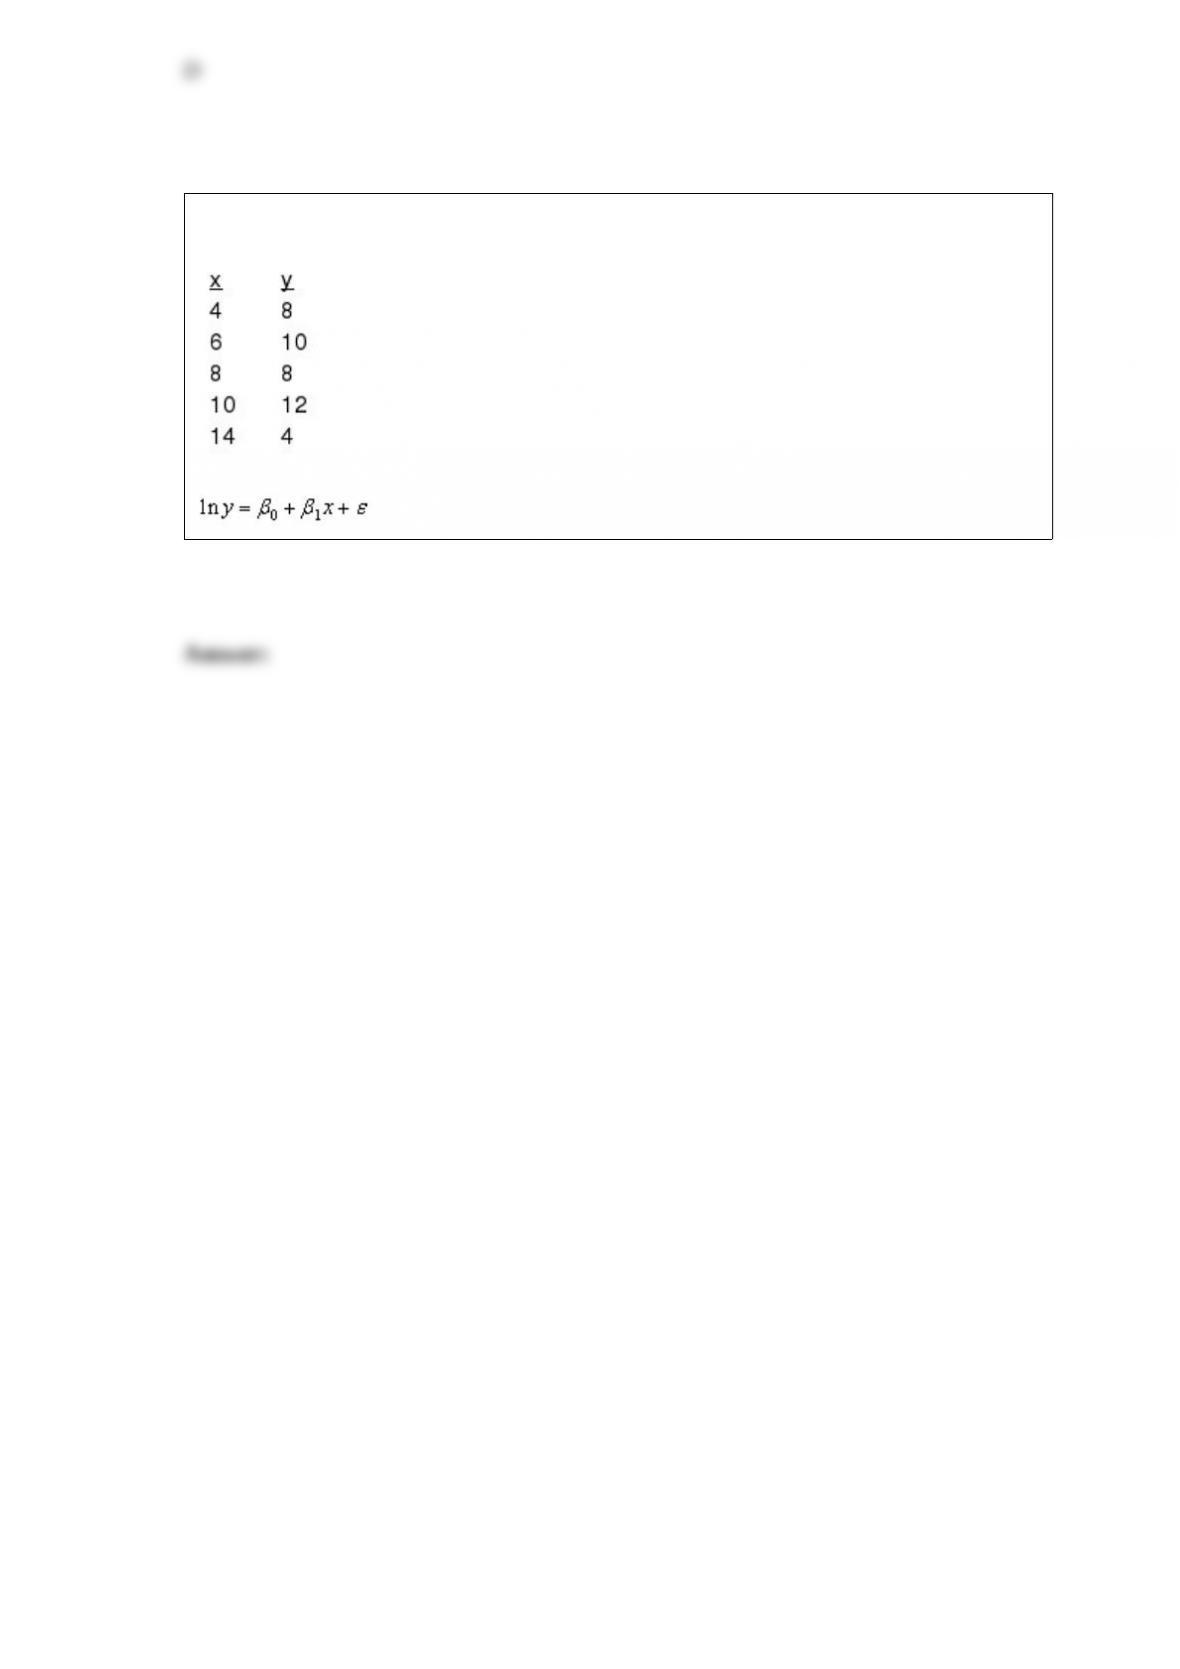
Consider the following data.
Use Excel’s Regression Tool to estimate a general linear model of the form
A __________ can be used to graphically present quantitative data.
a. histogram
b. pie chart
c. stem-and-leaf display
d. both a histogram and a stem-and-leaf display are correct

Which of the following is not a characteristic of the normal probability distribution?
a. The mean, median, and the mode are equal
b. The mean of the distribution can be negative, zero, or positive
c. The distribution is symmetrical
d. The standard deviation must be 1
Two approaches to drawing a conclusion in a hypothesis test are
a. p-value and critical value
b. one-tailed and two-tailed
c. Type I and Type II
d. null and alternative
Exhibit 15-2
A regression model between sales (y in $1,000), unit price (x1 in dollars) and television
advertisement (x2 in dollars) resulted in the following function:
= 7 – 3x1 + 5x2
For this model SSR = 3500, SSE = 1500, and the sample size is 18.
Refer to Exhibit 15-2. If SSR = 600 and SSE = 300, the test statistic F is
a. 2.33
b. 0.70
c. 17.5
d. 1.75
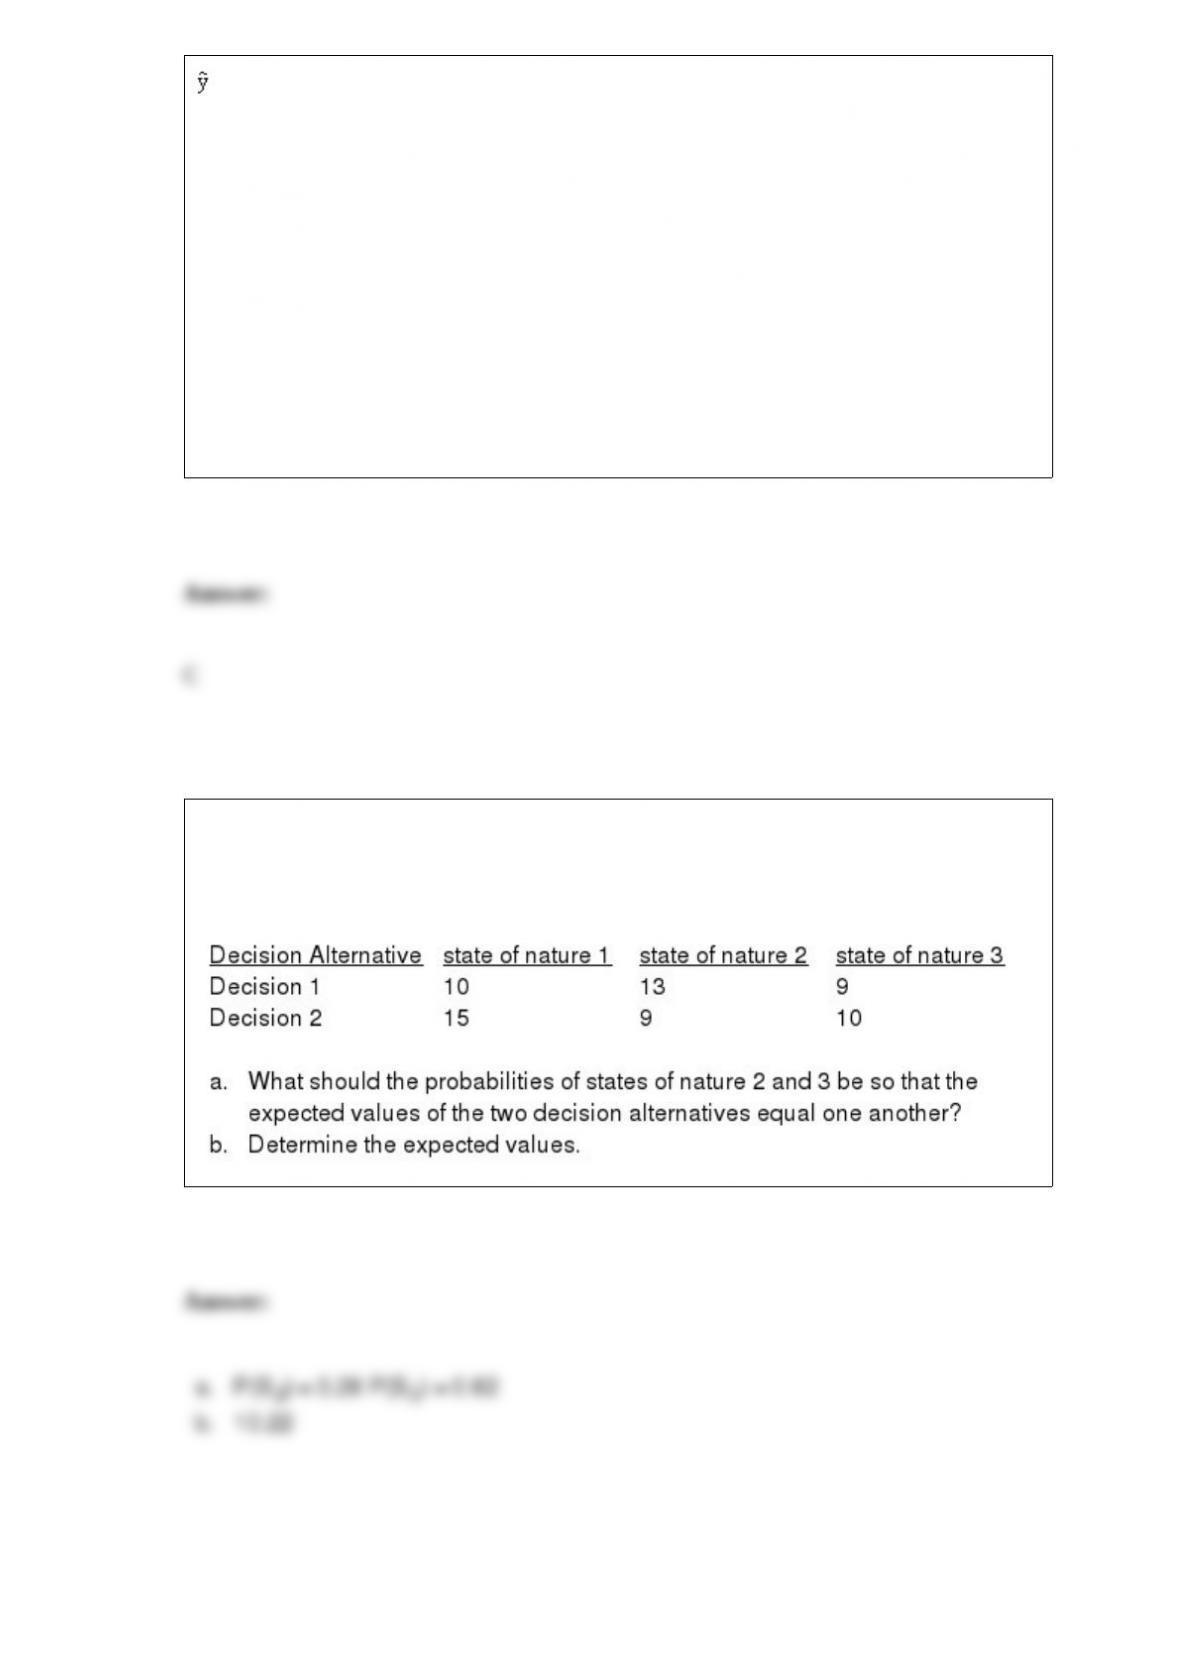
The following payoff table shows profits for two decision alternatives under three
different states of nature. It is known that the probability of the occurrence of state of
nature 1 is 0.1.
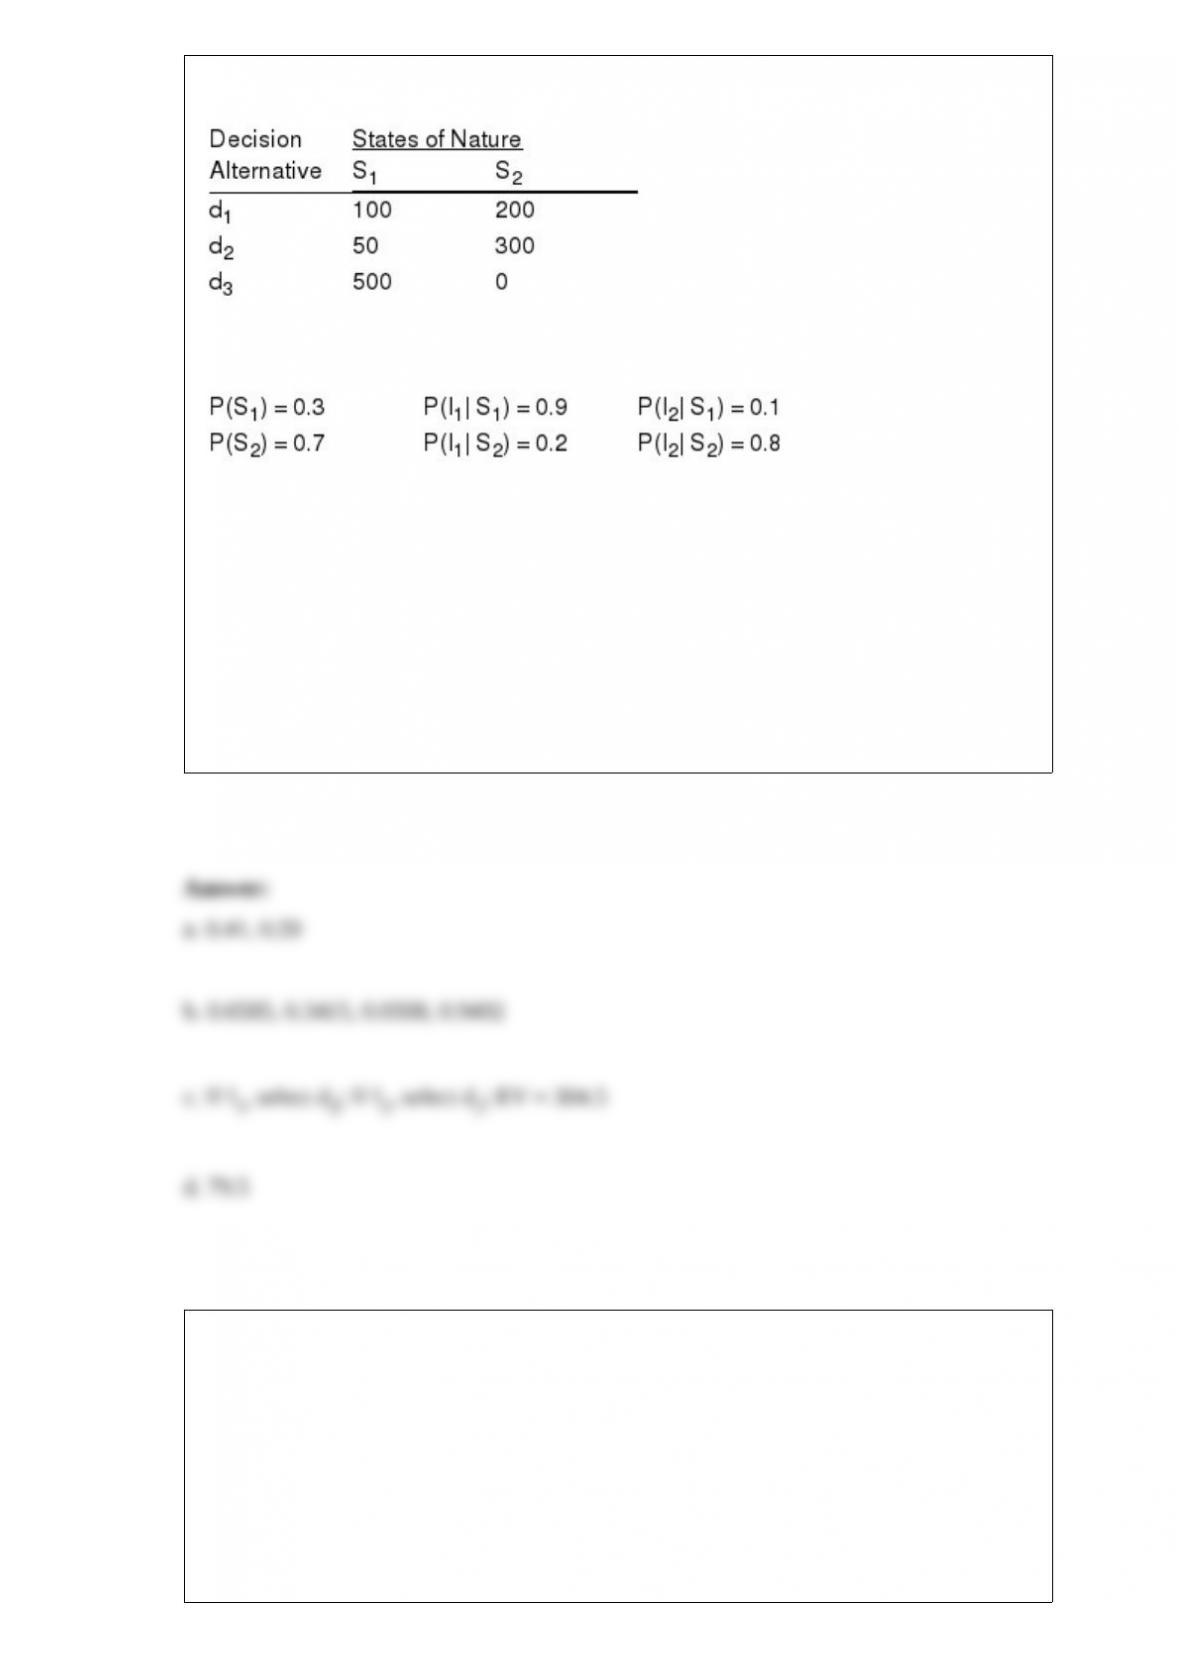
You are given the following payoff table:
Assume the following probability information is given:
a. Find the values of P(I1) and P(I2).
b. What are the values of P(S1 | I1), P(S2 | I1), P(S1 | I2), and P(S2 | I2)?
c. Use the decision tree approach and determine the optimal decision strategy. What is
the expected value of the solution?
d. Determine the expected value of sample information.
In a data set, the number of observations will always be the same as the number of
a. variables
b. elements
c. data sets
d. data

Exhibit 15-4
a. y = 0 + 1x1 + 2x2 +
b. E(y) = 0 + 1x1 + 2x2
c. = bo + b1 x1 + b2 x2
d. E(y) = 0 + 1x1 + 2x2
Refer to Exhibit 15-4. Which equation gives the estimated regression line?
a. equation a
b. equation b
c. equation c
d. equation d