
A simple random sample of size n from a finite population of size N is a sample
selected such that each possible sample of size
a. N has the same probability of being selected
b. n has a probability of 0.5 of being selected
c. n has a probability of 0.1 of being selected
d. n has the same probability of being selected
Z is a standard normal random variable. The P (-1.20 z 1.50) equals
a. 0.0483
b. 0.3849
c. 0.4332
d. 0.8181
Global Airlines operates two types of jet planes: jumbo and ordinary. On jumbo jets,
25% of the passengers are on business while on ordinary jets 30% of the passengers are
on business. Of Global’s air fleet, 40% of its capacity is provided on jumbo jets. (Hint:
you have been given two conditional probabilities.)
a. What is the probability a randomly chosen business customer flying with Global is on
a jumbo jet?
b. What is the probability a randomly chosen non-business customer flying with Global
is on an ordinary jet?
35. Excel’s ____ function is used to perform a goodness of fit test.
a. z-Test: Two Sample for Means
b. t-Test: Two Sample Assuming Equal Variances
c. CHISQ.DIST.RT
d. NORM.S.DIST
A small stock brokerage firm wants to determine the average daily sales (in dollars) of
stocks to their clients. A sample of the sales for 36 days revealed average daily sales of
$200,000. Assume that the standard deviation of the population is known to be $18,000.
The number of times each experimental condition is observed in a factorial design is
known as
a. partition
b. replication
c. experimental condition
d. factor
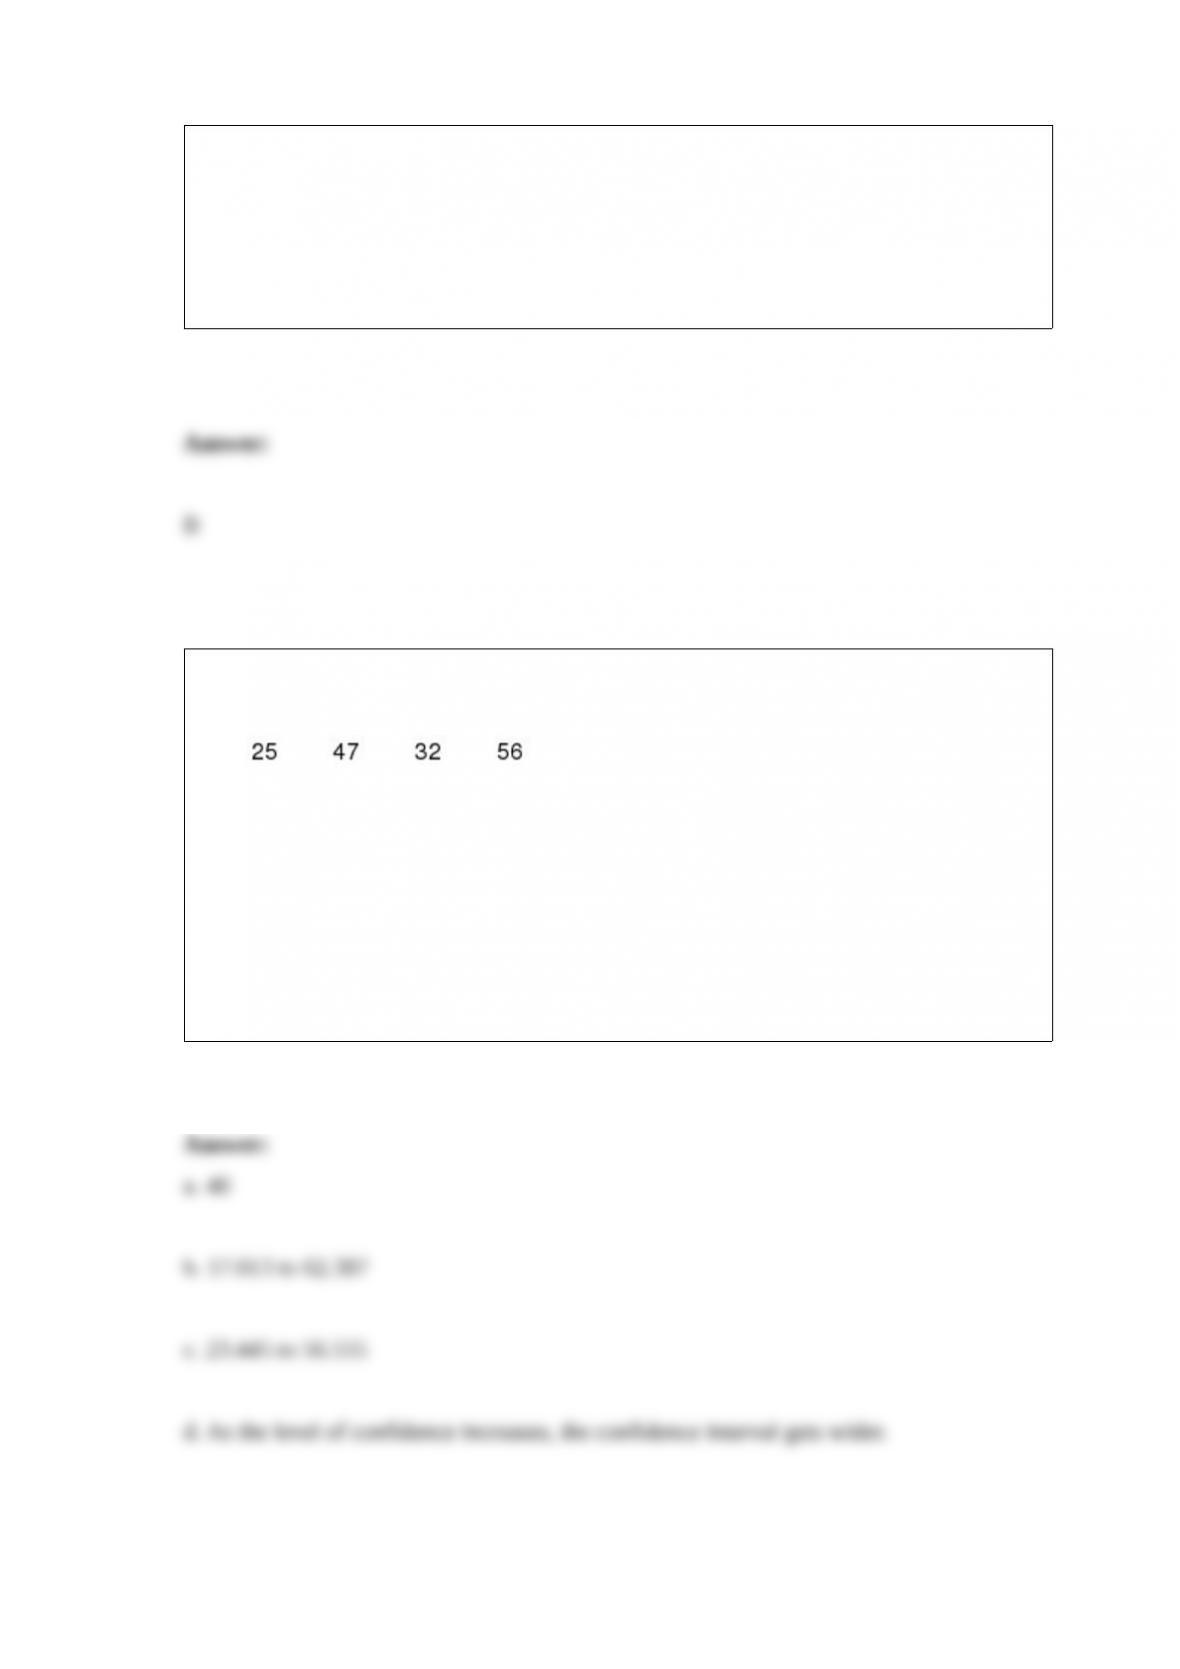
You are given the following information obtained from a random sample of 4
observations from a large, normally distributed population.
a. What is the point estimate of
?
b. Construct a 95% confidence interval for
.
c. Construct a 90% confidence interval for
.
d. Discuss why the 90% and 95% confidence intervals are different.

A population of size 1,000 has a proportion of 0.5. Therefore, the proportion and the
standard deviation of the sample proportion for samples of size 100 are
a. 500 and 0.047
b. 500 and 0.050
c. 0.5 and 0.047
d. 0.5 and 0.050
If the coefficient of correlation is a positive value, then the slope of the regression line
a. must also be positive
b. can be either negative or positive
c. can be zero
d. None of these answers is correct.
Consider the following data.
The standard deviation of a standard normal distribution
a. is always equal to zero
b. is always equal to one
c. can be any positive value
d. can be any value
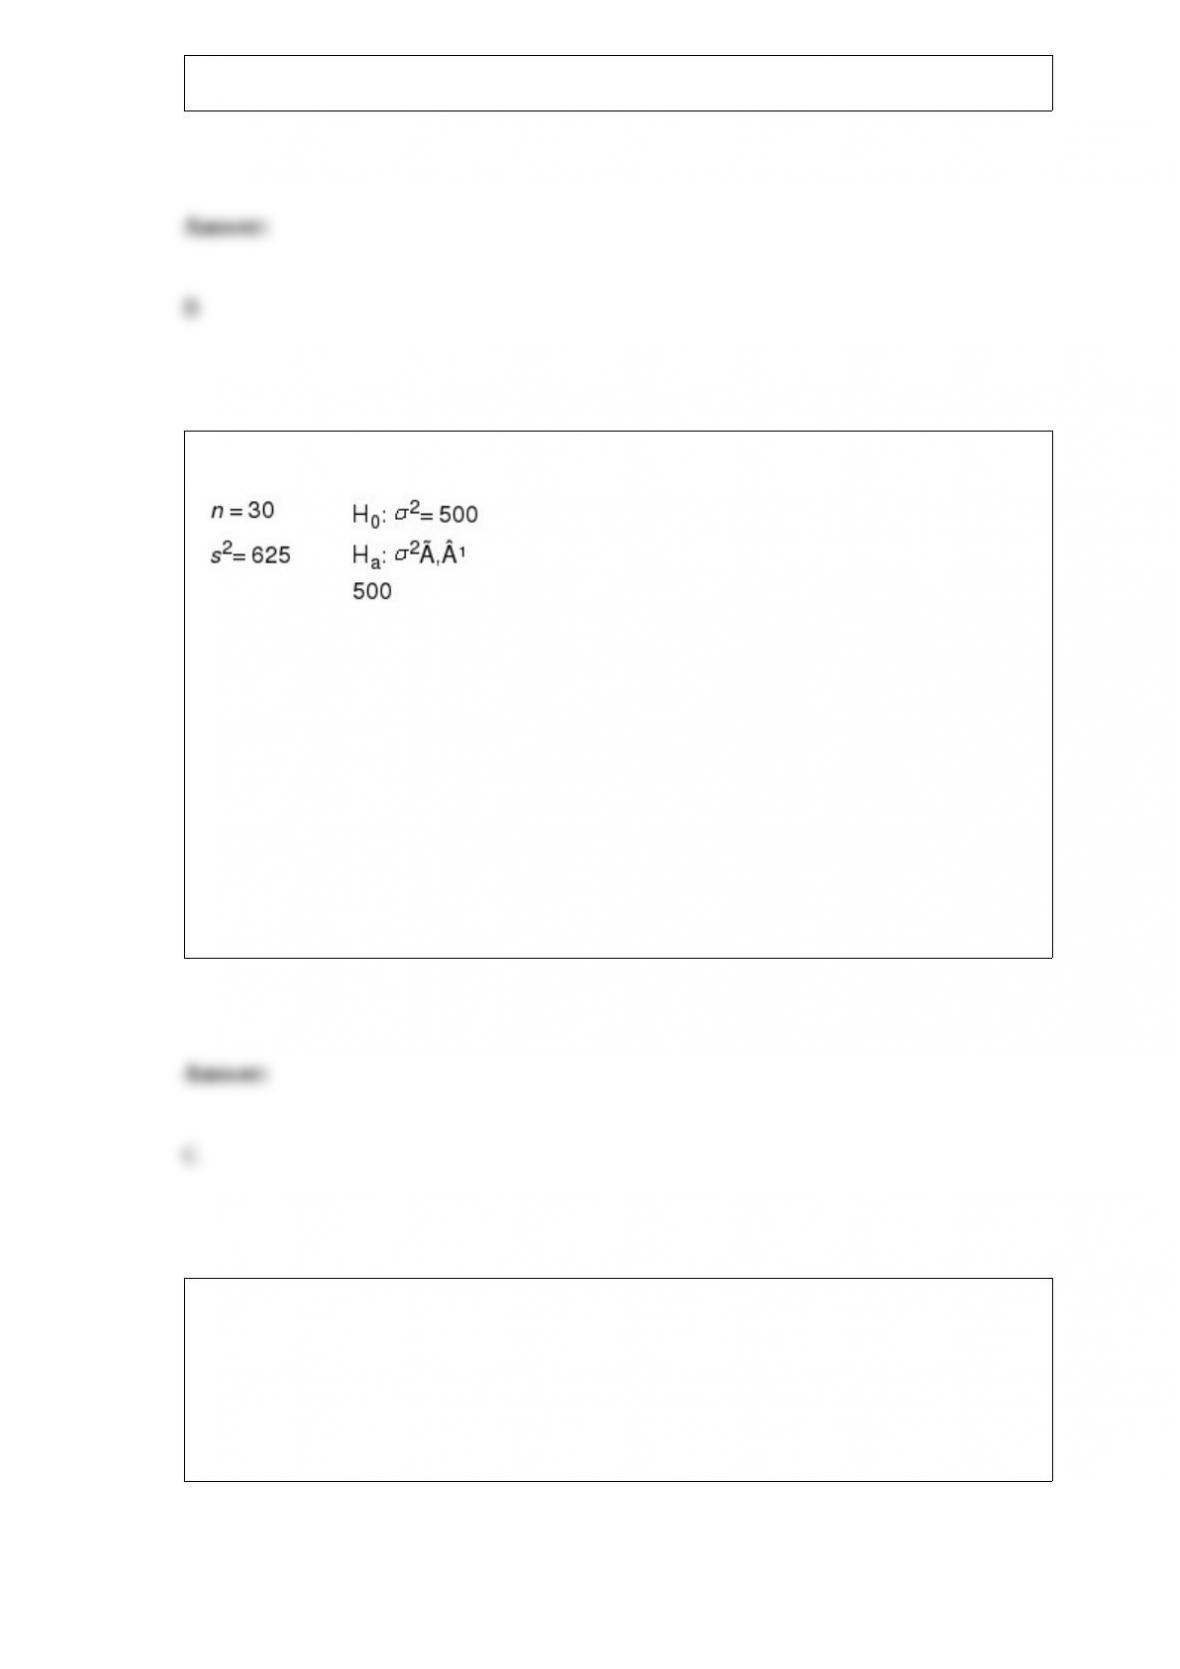
Exhibit 11-4
Refer to Exhibit 11-4. The null hypothesis is to be tested at the 5% level of significance.
The critical value(s) from the table is(are)
a. 42.5569
b. 43.7729
c. 16.0471 and 45.7222
d. 16.7908 and 46.9792
Exhibit 10-2
The following information was obtained from matched samples.
The daily production rates for a sample of workers before and after a training program
are shown below.

Refer to Exhibit 10-2. The point estimate for the difference between the means of the
two populations is
a. -1
b. -2
c. 0
d. 1
In contrast to Deming’s philosophy, which required a major cultural change in the
organization, Juran’s programs were designed to improve quality by
a. working within the current organizational system
b. reducing the number of levels in the organizational structure
c. changing customer perception and expectations
d. identifying and replacing the most counter-productive employees
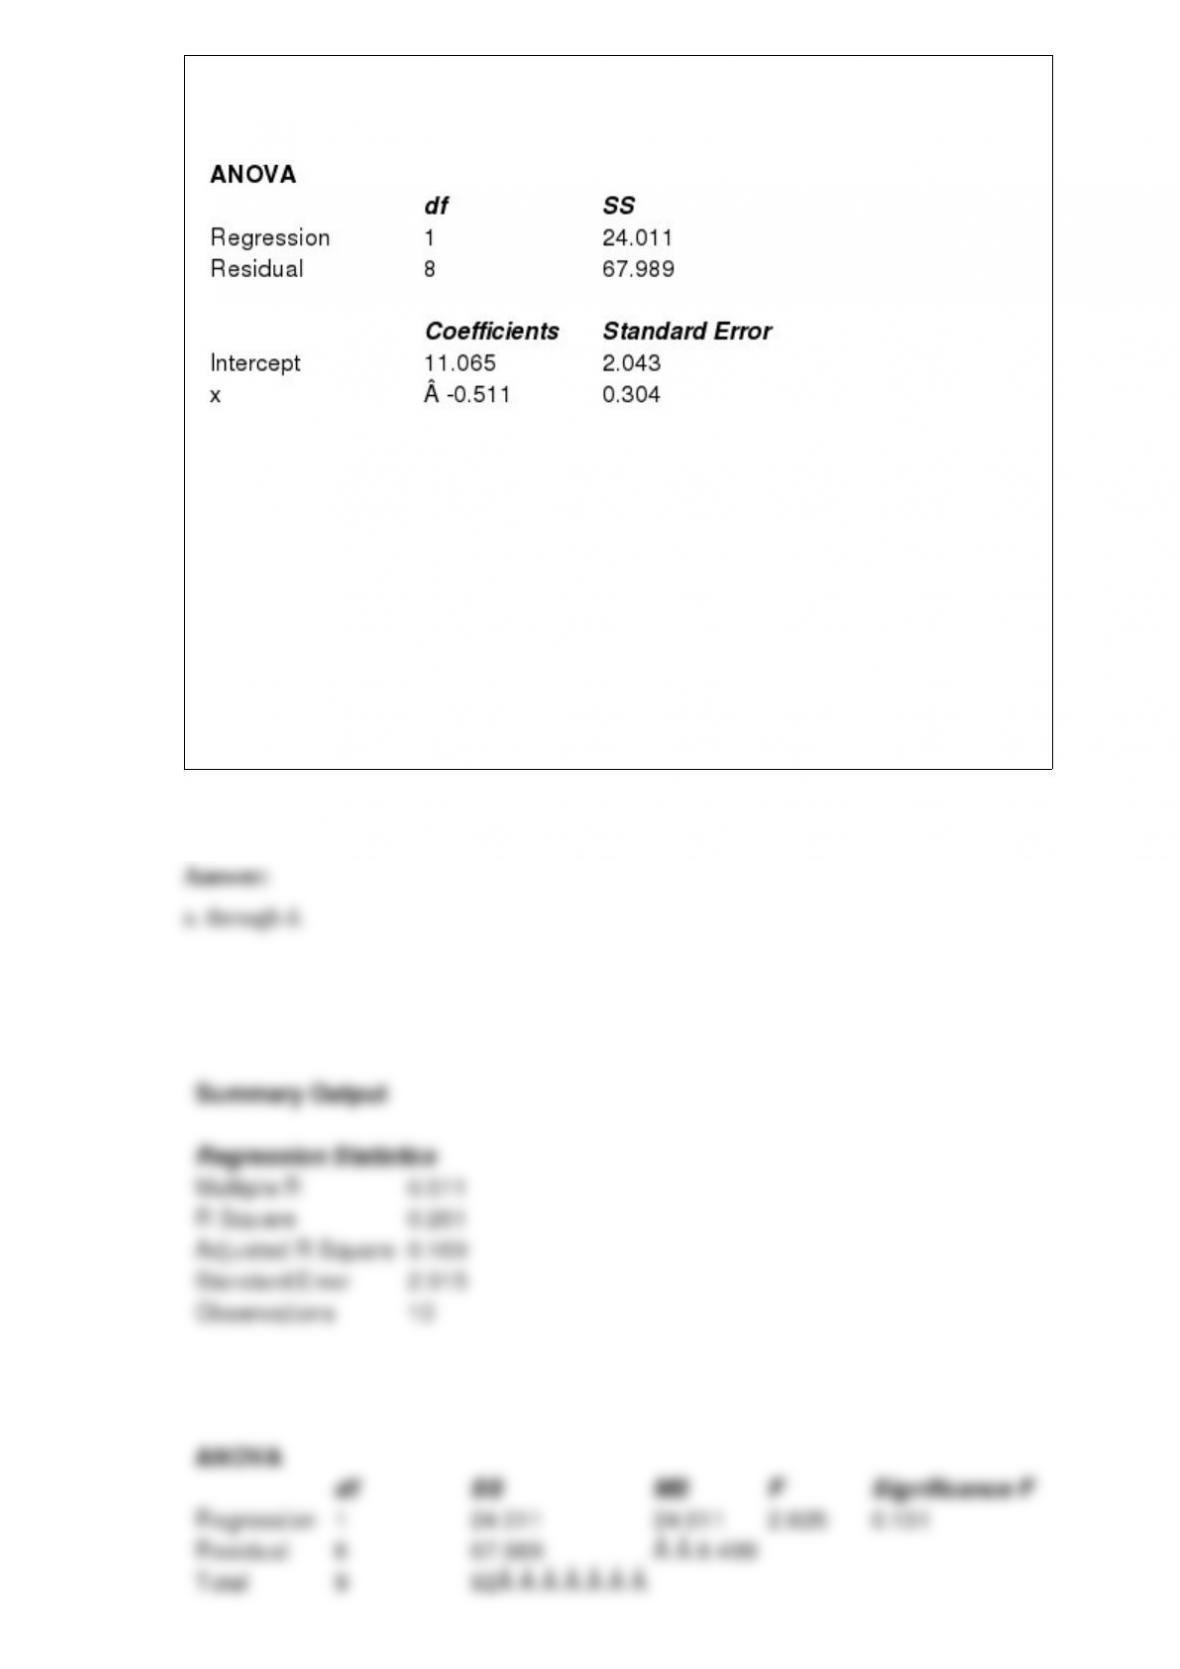
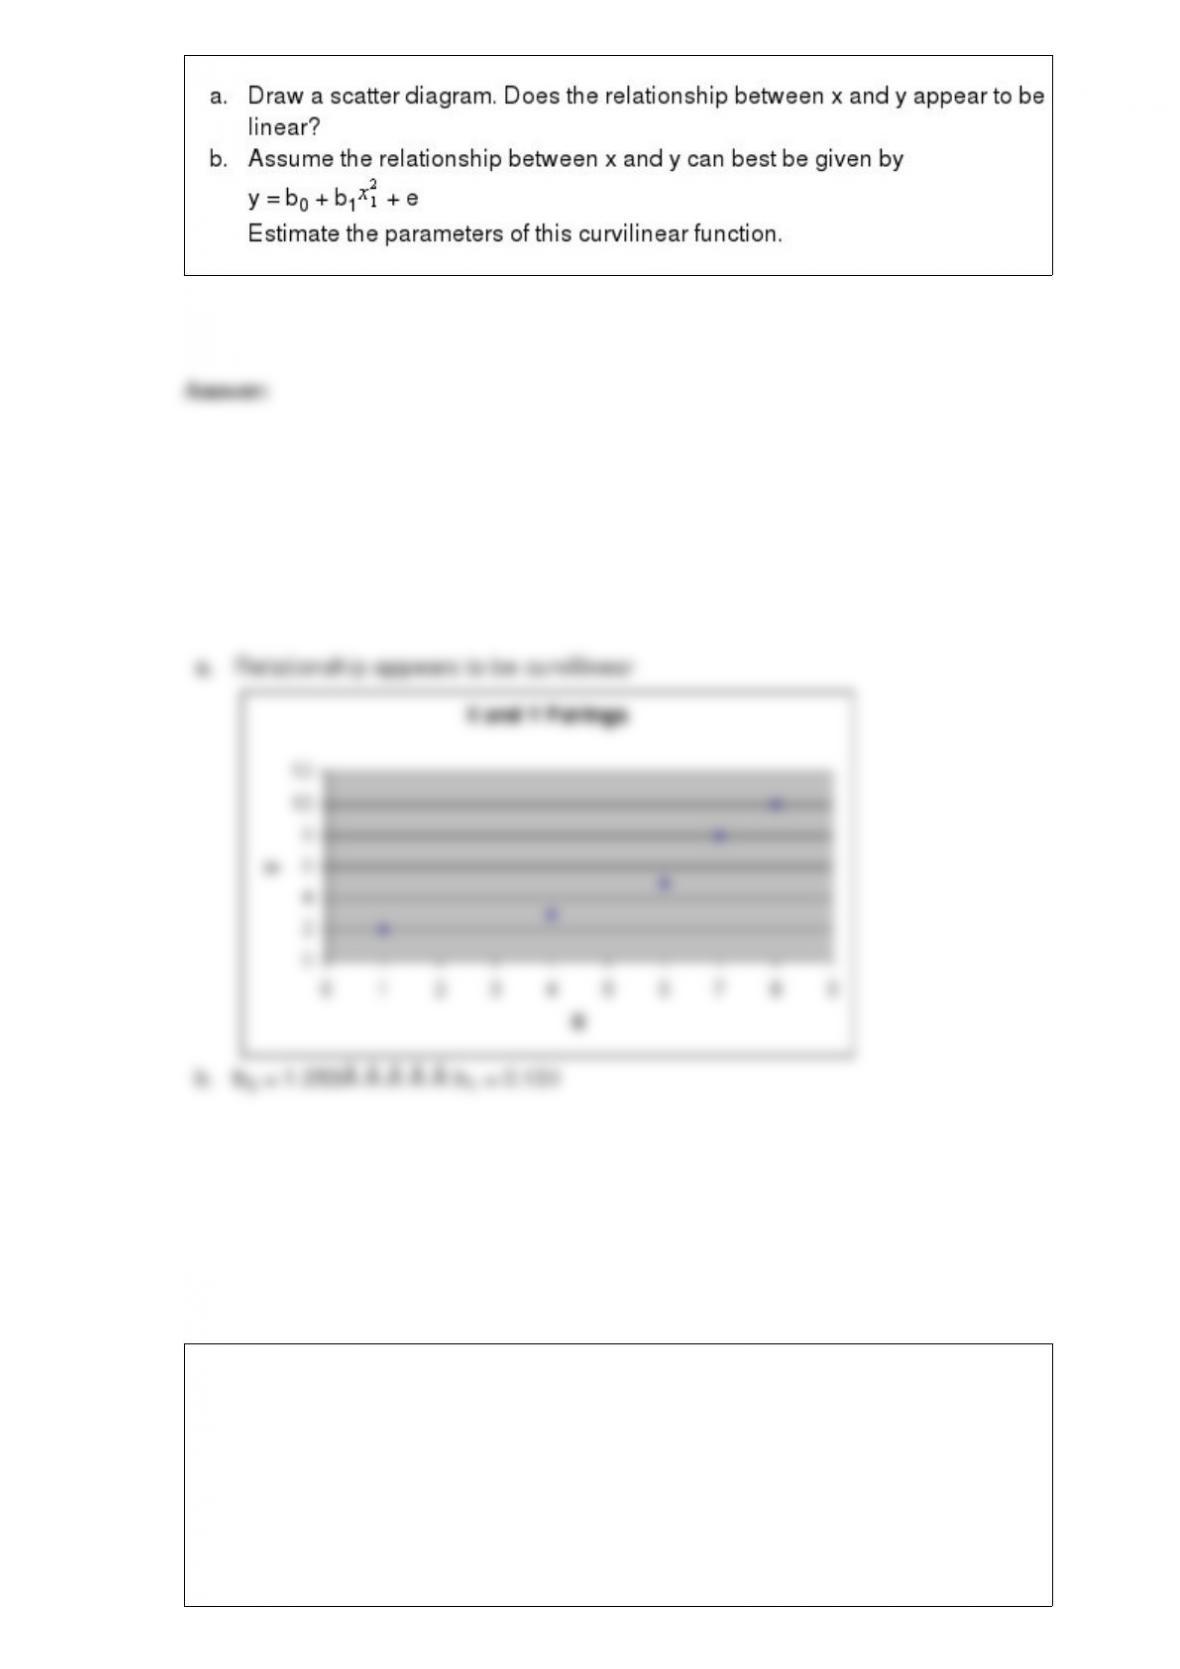
Shown below is a portion of a computer output for regression analysis relating Y
(dependent variable) and X (independent variable).
a. What has been the sample size for the above?
b. Perform a t test and determine whether or not X and Y are related. Let = 0.05.
c. Perform an F test and determine whether or not X and Y are related. Let = 0.05.
d. Compute the coefficient of determination.
e. Interpret the meaning of the value of the coefficient of determination that you found
in d. Be very specific.
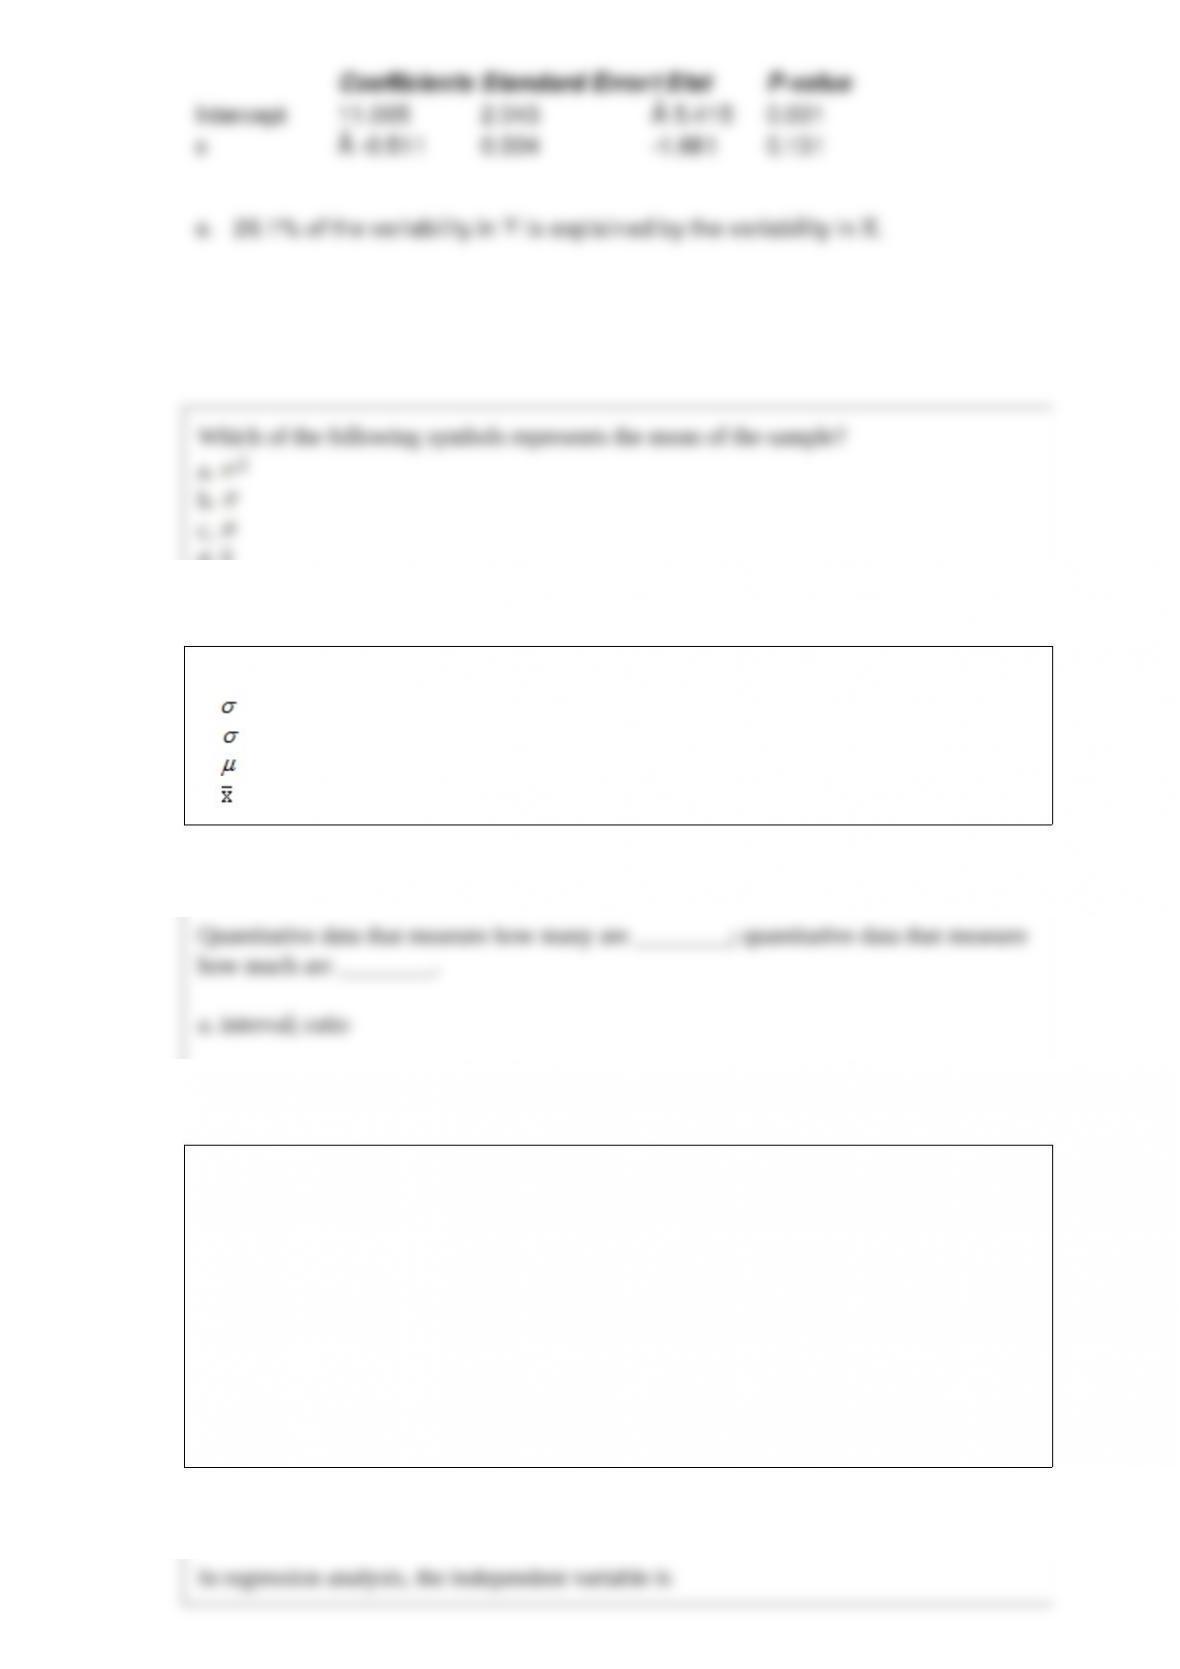
Which of the following symbols represents the mean of the sample?
a. 2
b.
c.
d.
Quantitative data that measure how many are ________; quantitative data that measure
how much are ________.
a. interval; ratio
b. ratio; interval
c. continuous; discrete
d. discrete; continuous
In regression analysis, the independent variable is
a. used to predict other independent variables
b. used to predict the dependent variable
c. called the intervening variable
d. None of these answers is correct.
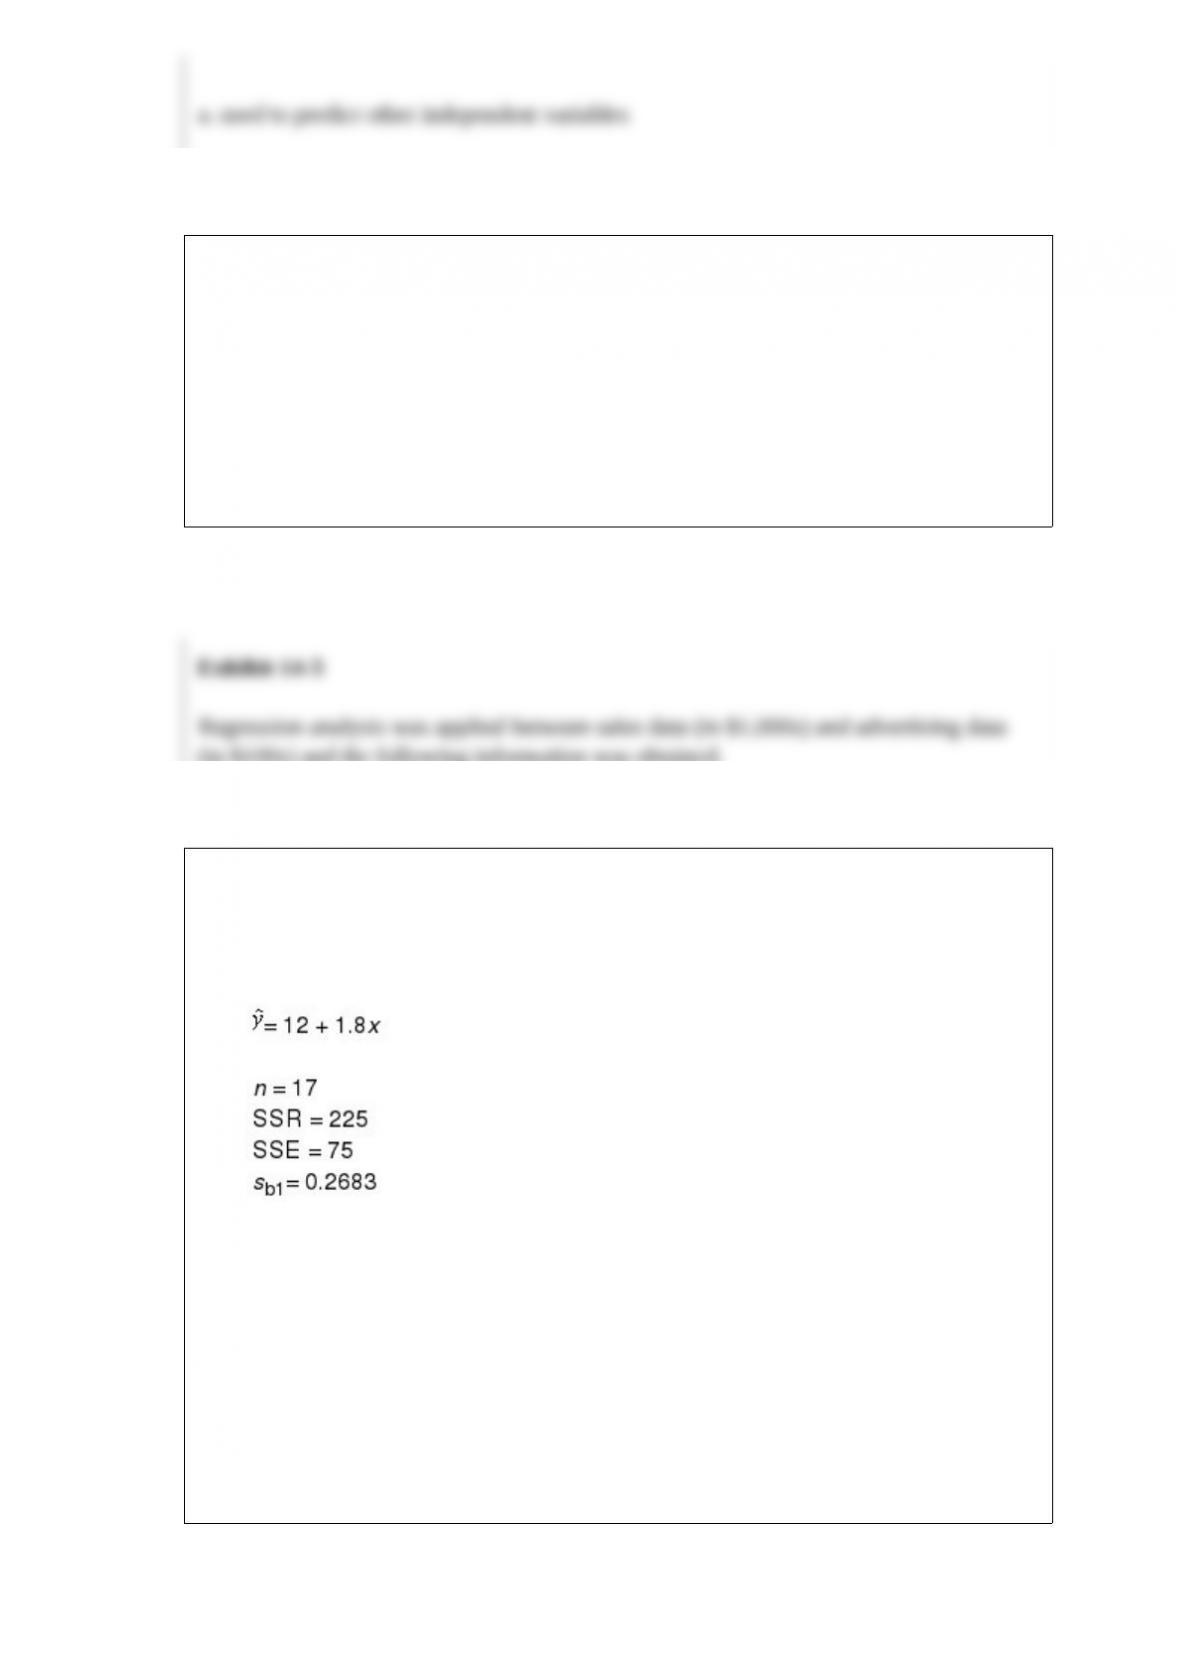
Exhibit 14-3
Regression analysis was applied between sales data (in $1,000s) and advertising data
(in $100s) and the following information was obtained.
Refer to Exhibit 14-3. The F statistic computed from the above data is
a. 3
b. 45
c. 48
d. Not enough information is given to answer this question.

A random sample of 89 tourists in the Grand Bahamas showed that they spent an
average of $2,860 (in a week) with a standard deviation of $126; and a sample of 64
tourists in New Province showed that they spent an average of $2,935 (in a week) with
a standard deviation of $138. We are interested in determining if there is any significant
difference between the average expenditures of those who visited the two islands?
a. Determine the degrees of freedom for this test.
b. Compute the test statistic.
c. Compute the p-value.
d. What is your conclusion? Let = .05.
Which of the following is not a required condition for a discrete probability function?
a. f(x) 0 for all values of x
b. f(x) 1
c. f(x) 0
d. All of the answers are correct.