
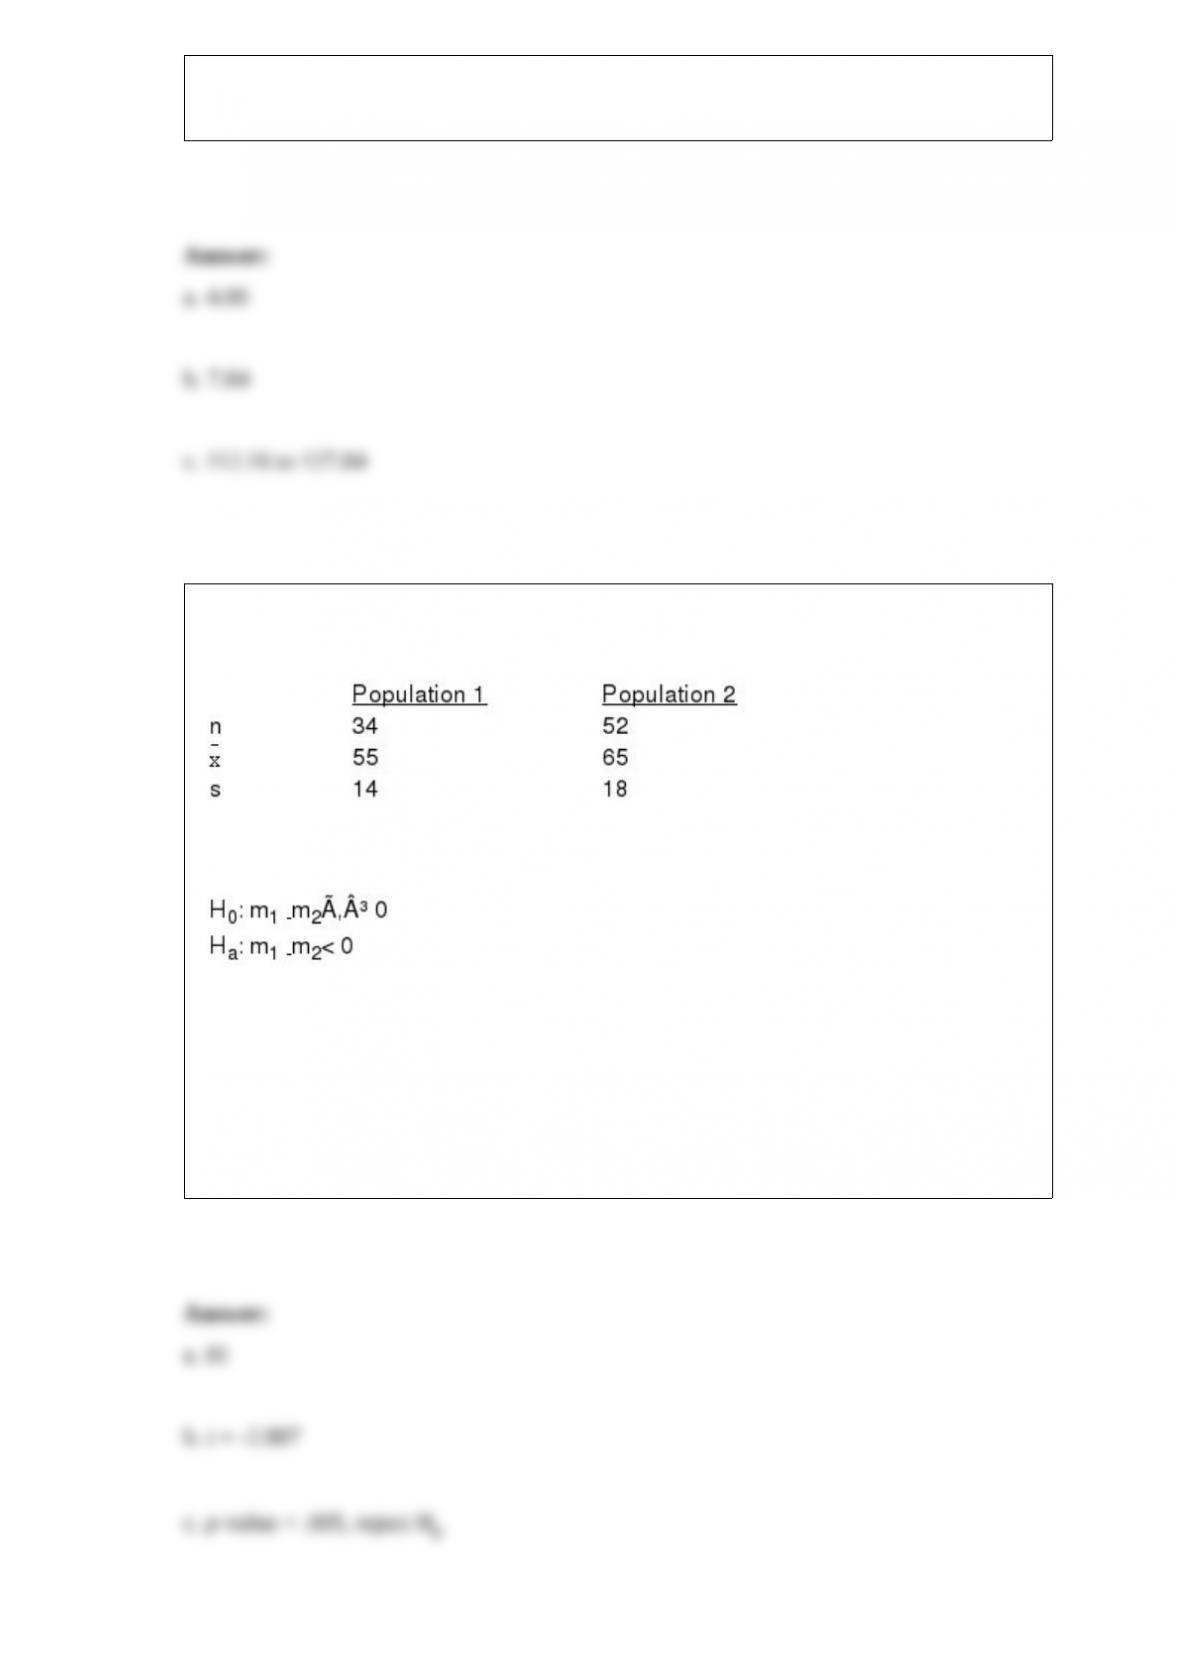
The critical F value with 6 numerator and 60 denominator degrees of freedom at = .
05 is
a. 3.74
b. 2.25
c. 2.37
d. 1.96
The population being studied is usually considered ______ if it involves an ongoing
process that makes listing or counting every element in the population impossible.
a. finite
b. infinite
c. skewed
d. symmetric
Exhibit 8-3
A random sample of 81 automobiles traveling on a section of an interstate showed an
average speed of 60 mph. The distribution of speeds of all cars on this section of
highway is normally distributed, with a standard deviation of 13.5 mph.
Refer to Exhibit 8-3. The 86.9% confidence interval for
is
a. 46.500 to 73.500
b. 57.735 to 62.265
c. 59.131 to 60.869
d. 50 to 70
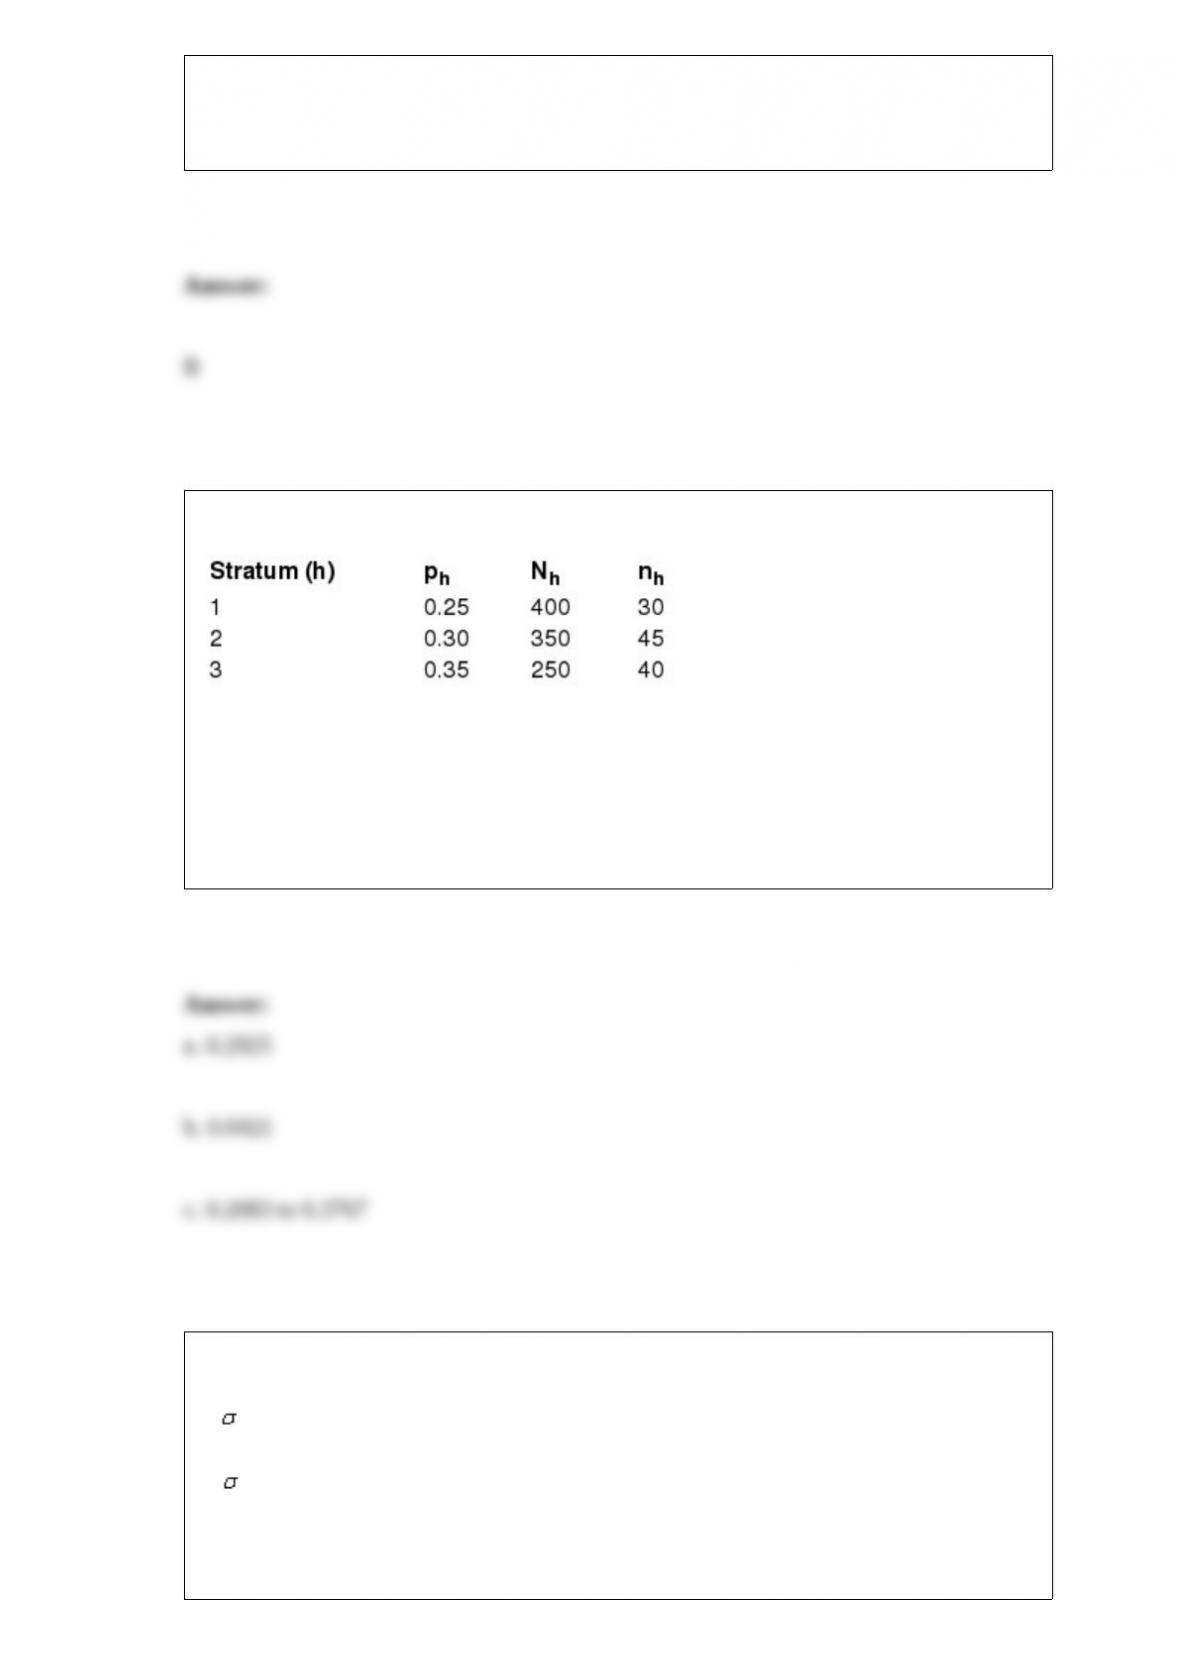
A stratified simple random sample has been taken with the following results.
a. Determine the point estimator of the population proportion.
b. Estimate the standard error of the population proportion.
c. Develop an approximate 95% confidence interval for the population proportion.
The symbol used for the variance of the population is
a.
b. 2
c. s

d. s2
The sampling distribution of the quantity (n-1)s2/2 is the
a. chi-square distribution
b. normal distribution
c. F distribution
d. t distribution
The probability of the occurrence of event A in an experiment is 1/3. If the experiment
is performed 2 times and event A did not occur, then on the third trial event A
a. must occur
b. may occur
c. could not occur
d. has a 2/3 probability of occurring

The degrees of freedom for a contingency table with 12 rows and 12 columns is
a. 144
b. 121
c. 12
d. 120
Exhibit 8-2
The manager of a grocery store has taken a random sample of 100 customers. The
average length of time it took these 100 customers to check out was 3.0 minutes. It is
known that the standard deviation of the checkout time is one minute.
Refer to Exhibit 8-2. The standard error of the mean equals
a. 0.001
b. 0.010
c. 0.100
d. 1.000
A multiple regression model has the form

= 5 + 6x + 7w
As x increases by 1 unit (holding w constant), y is expected to
a. increase by 11 units
b. decrease by 11 units
c. increase by 6 units
d. decrease by 6 units
Given an actual demand of 61, forecast of 58, and an of .3, what would the forecast
for the next period be using simple exponential smoothing?
a. 57.1
b. 58.9
c. 61.0
d. 65.5
Exhibit 6-5
The weight of items produced by a machine is normally distributed with a mean of 8
ounces and a standard deviation of 2 ounces.
Refer to Exhibit 6-5. What is the probability that a randomly selected item weighs
exactly 8 ounces?
a. 0.5
b. 1.0
c. 0.3413
d. None of the alternative answers is correct.
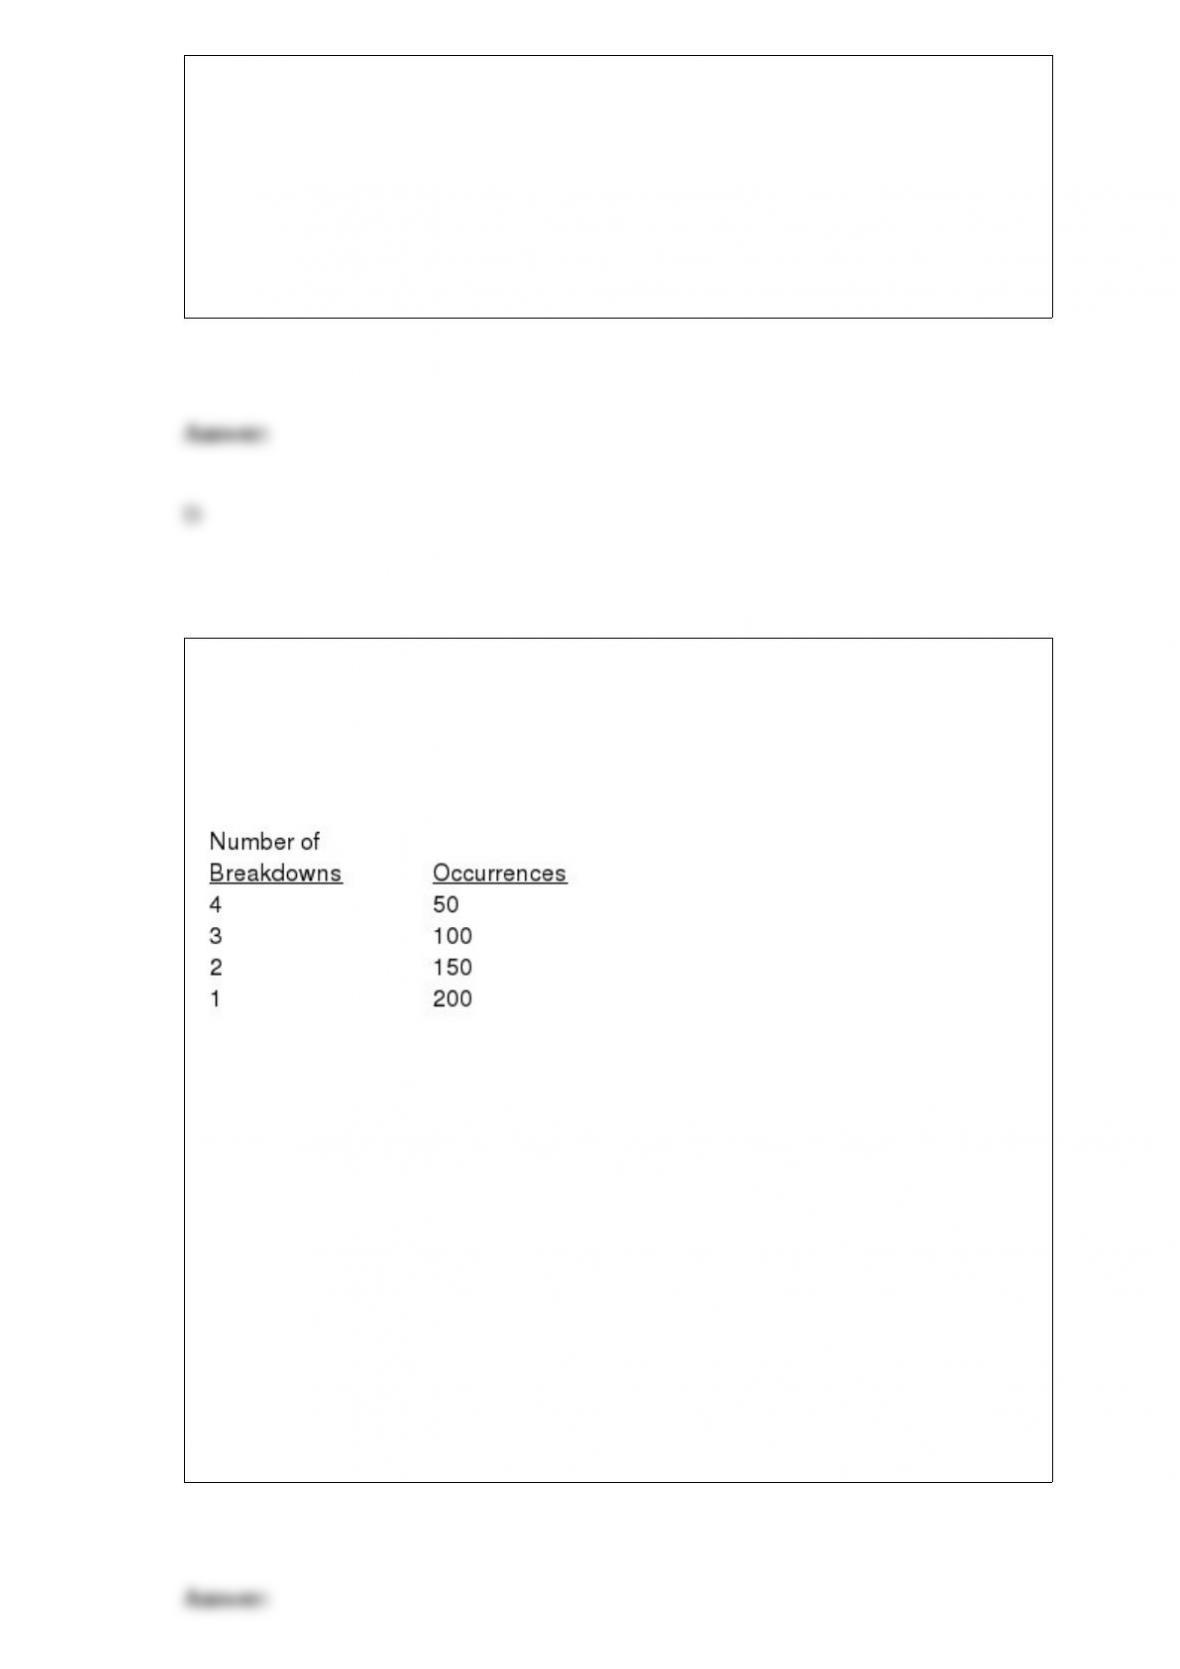
A maintenance department replaces a malfunctioning machine with a standby machine
if one is available; otherwise, they repair the broken machine as soon as possible. When
a standby machine is available, production down time is greatly reduced. The
department has reviewed its historical maintenance records on machine breakdowns
and found this pattern for the past four weeks:
If a standby machine is not available when a breakdown occurs, the estimated cost is
$400 due to lost production time, overtime usage on the other machines, and emergency
repair procedures. On the other hand, weekly cost for machines not in use is estimated
to be $200 due to storage and special handling expenses. The department manager
wants to use a payoff table to determine how many standby machines they should
maintain.
a. Construct a table showing the cost associated with each decision alternative (number
of computers stocked) and state of nature (number of computers needed) combination.
b. Compute the probability of each state of nature.
c. How many standby computers should be stocked in order to minimize their expected
costs?
Consider a population of five weights identical in appearance but weighing 1, 3, 5, 7,
and 9 ounces.
a. Determine the mean and the variance of the population.
b. Sampling without replacement from the above population with a sample size of 2
produces ten possible samples. Using the ten sample mean values, determine the mean
of the population and the variance of .
c. Compute the standard error of the mean.
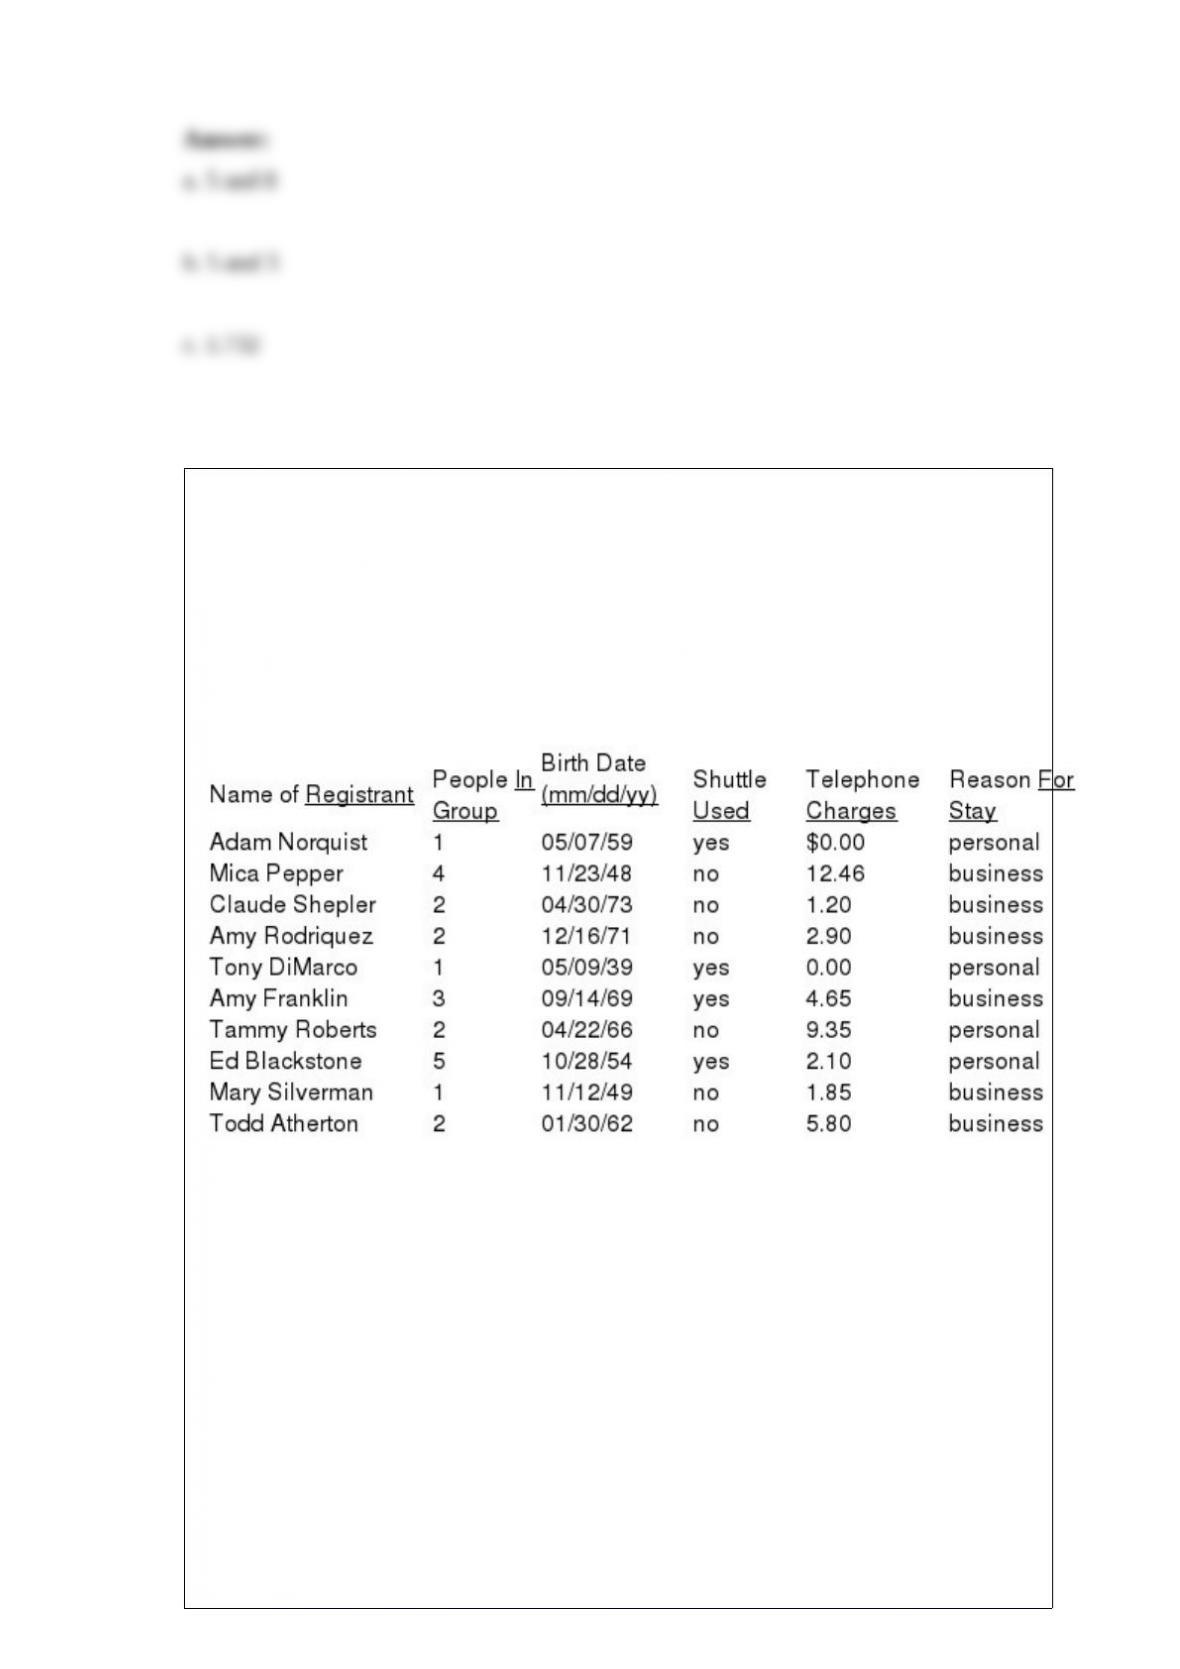
Laura Naples, Manager of Heritage Inn, periodically collects and tabulates information
about a sample of the hotel’s overnight guests. This information aids her in planning and
scheduling decisions she must make. The table below lists data on ten randomly
selected hotel registrants, collected as the registrants checked out. The data listed for
each registrant are: number of people in the group; birth date of person registering;
shuttle service used, yes or no; total telephone charges incurred; and reason for stay,
business or personal.
a. How many elements are there in the data set?
b. How many variables are there in the data set?
c. How many observations are there in the data set?
d. What are the observations for the second element listed?
e. What is the total number of measurements in the data set?
f. Which variables are quantitative?
g. Which variables are qualitative?
h. What is the scale of measurement for each of the variables?
i. Does the data set represent cross-sectional or times series data?
j. Does the data set represent an experimental or an observational study?
All of the following are true about a cyclical pattern except
a. it is often due to multi-year business cycles
b. it is often combined with long-term trend patterns and called trend-cycle patterns
c. it is an alternating sequence of data points above and below the trend line
d. it is usually easier to forecast than a seasonal pattern due to less variability
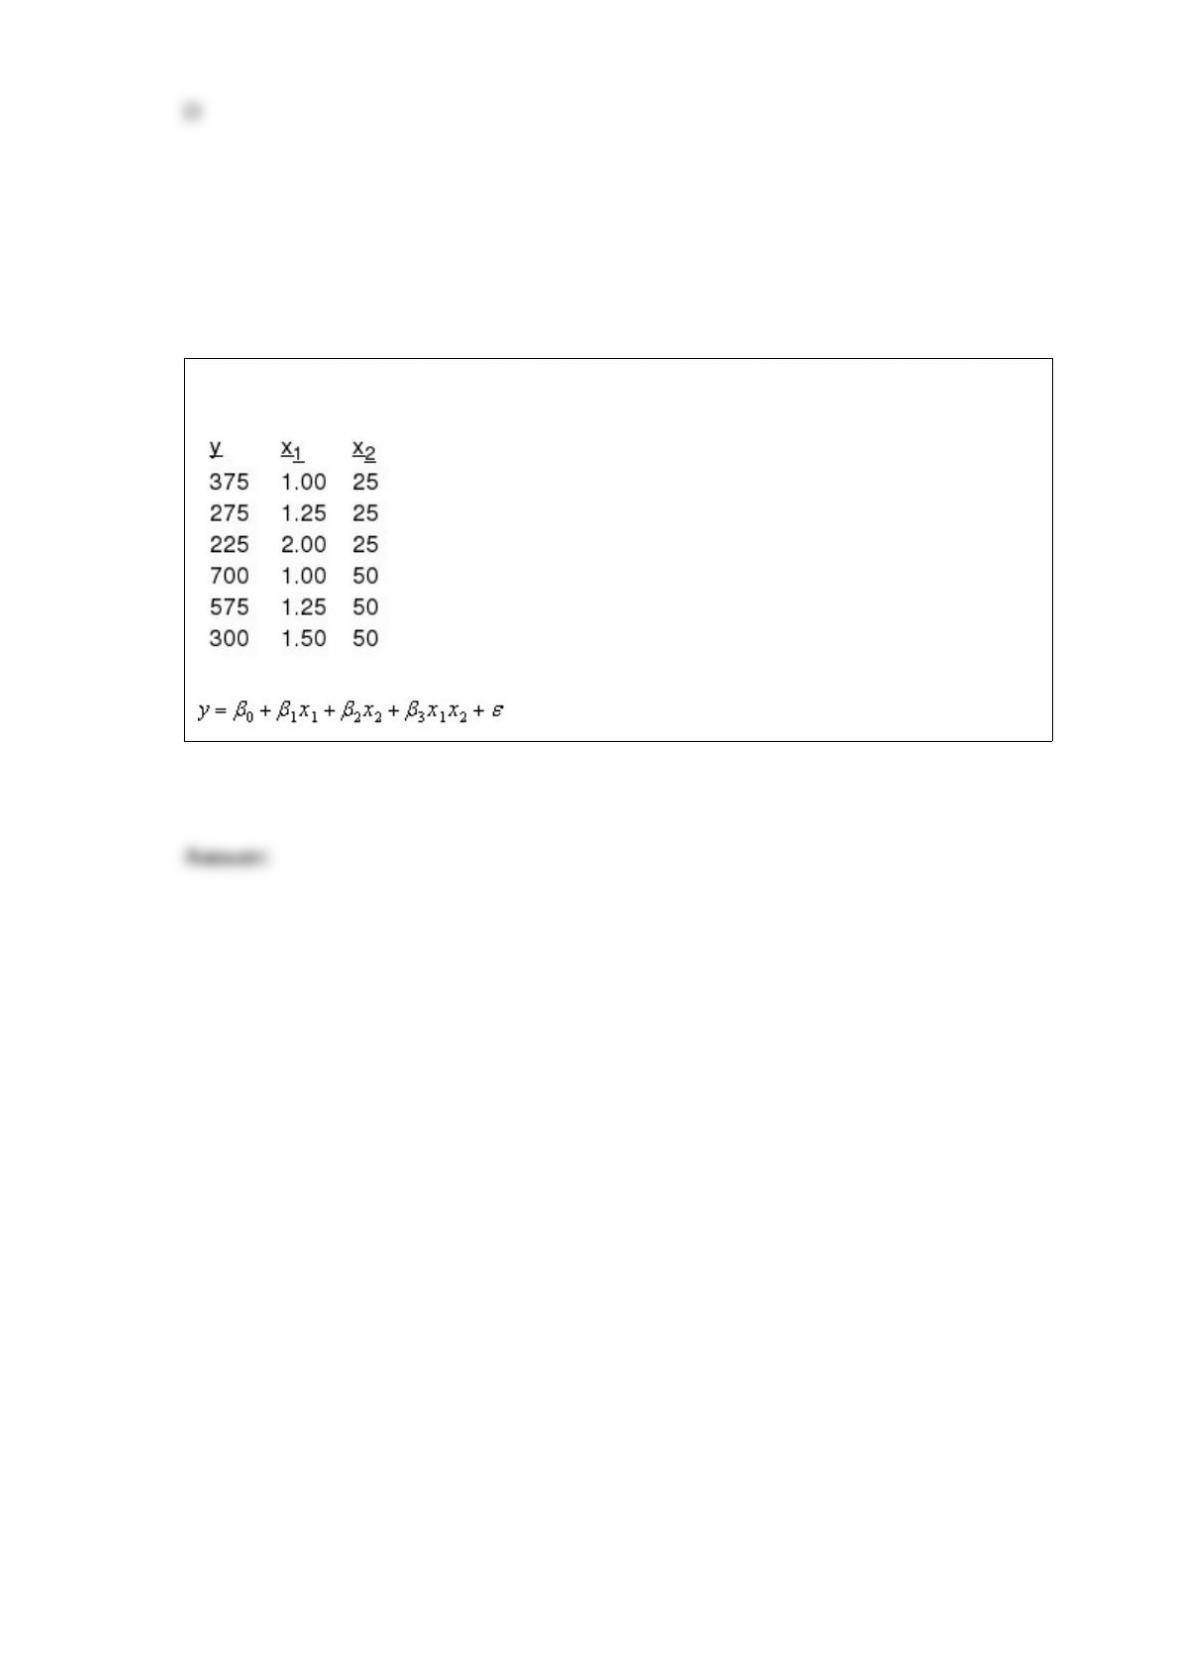
Consider the following data.
Use Excel’s Regression Tool to estimate a general linear model of the form
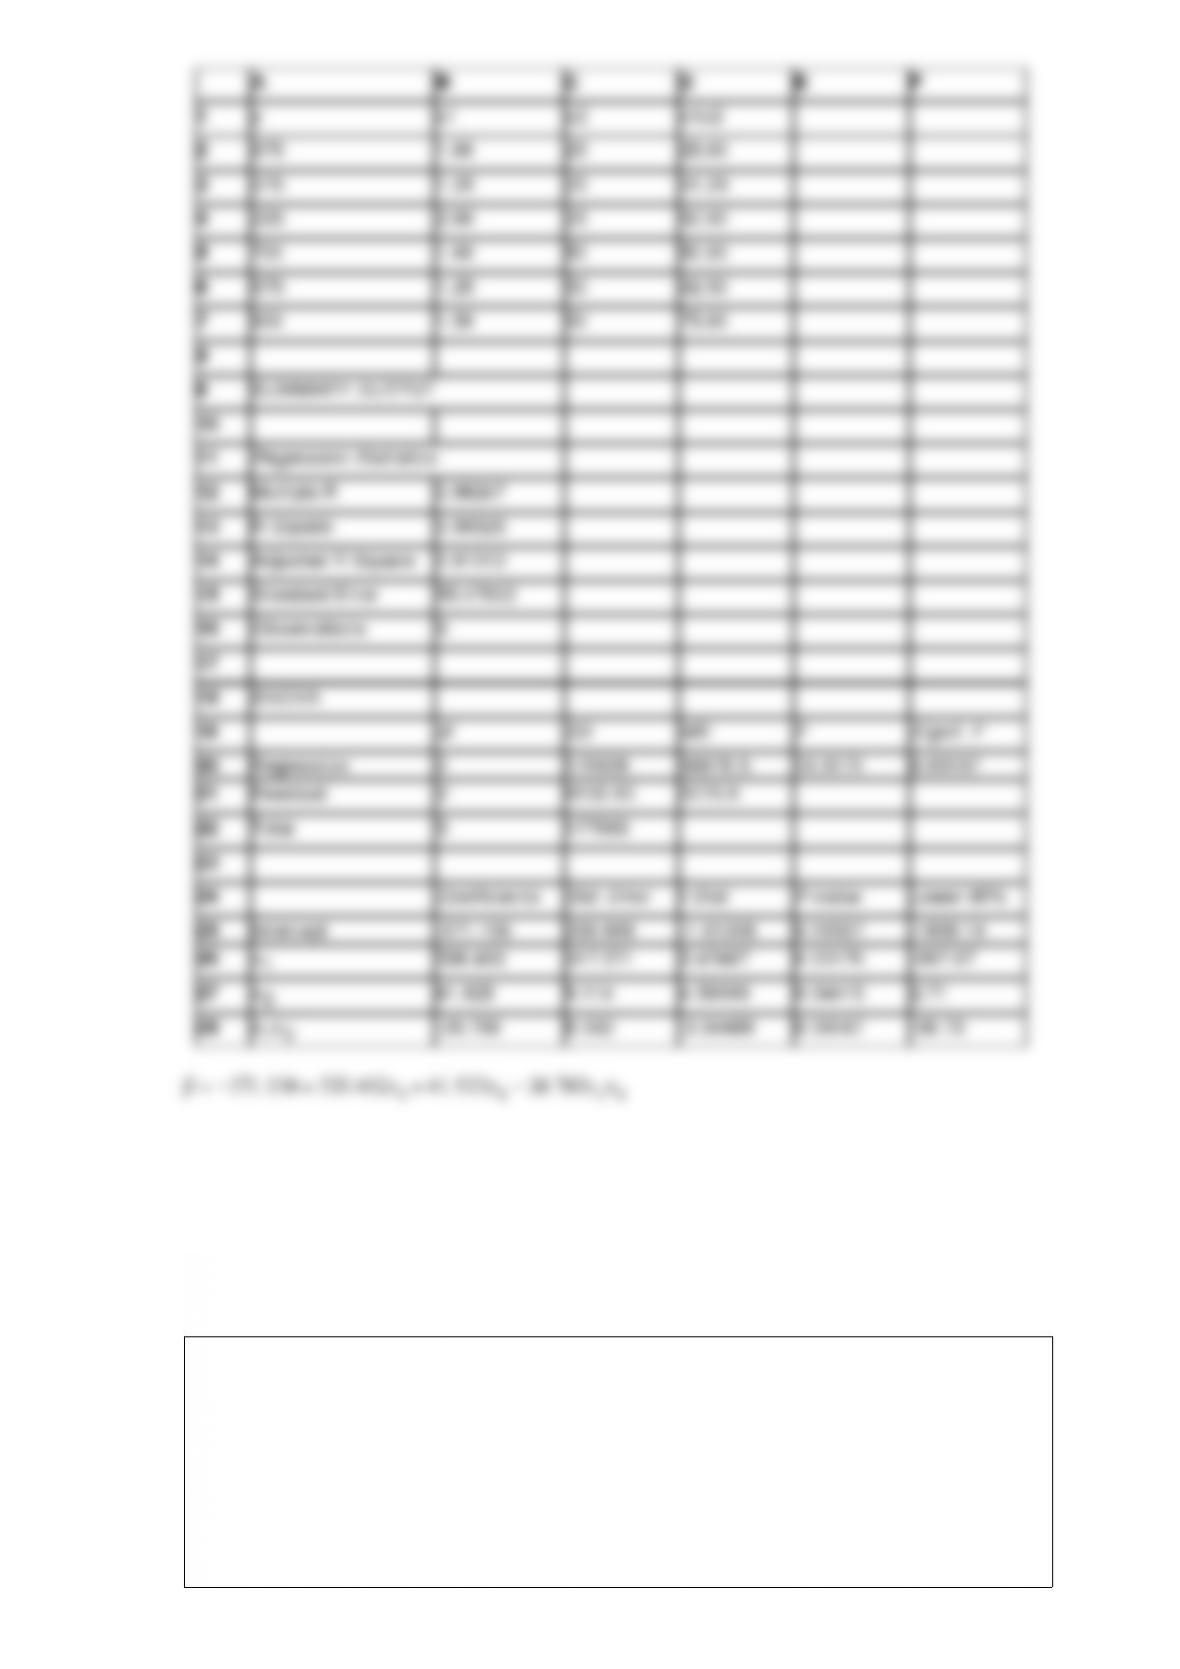
When an analysis of variance is performed on samples drawn from k populations, the
mean square between treatments (MSTR) is
a. SSTR/nT
b. SSTR/(nT – 1)
c. SSTR/k
d. SSTR/(k – 1)
e. None of these alternatives is correct.
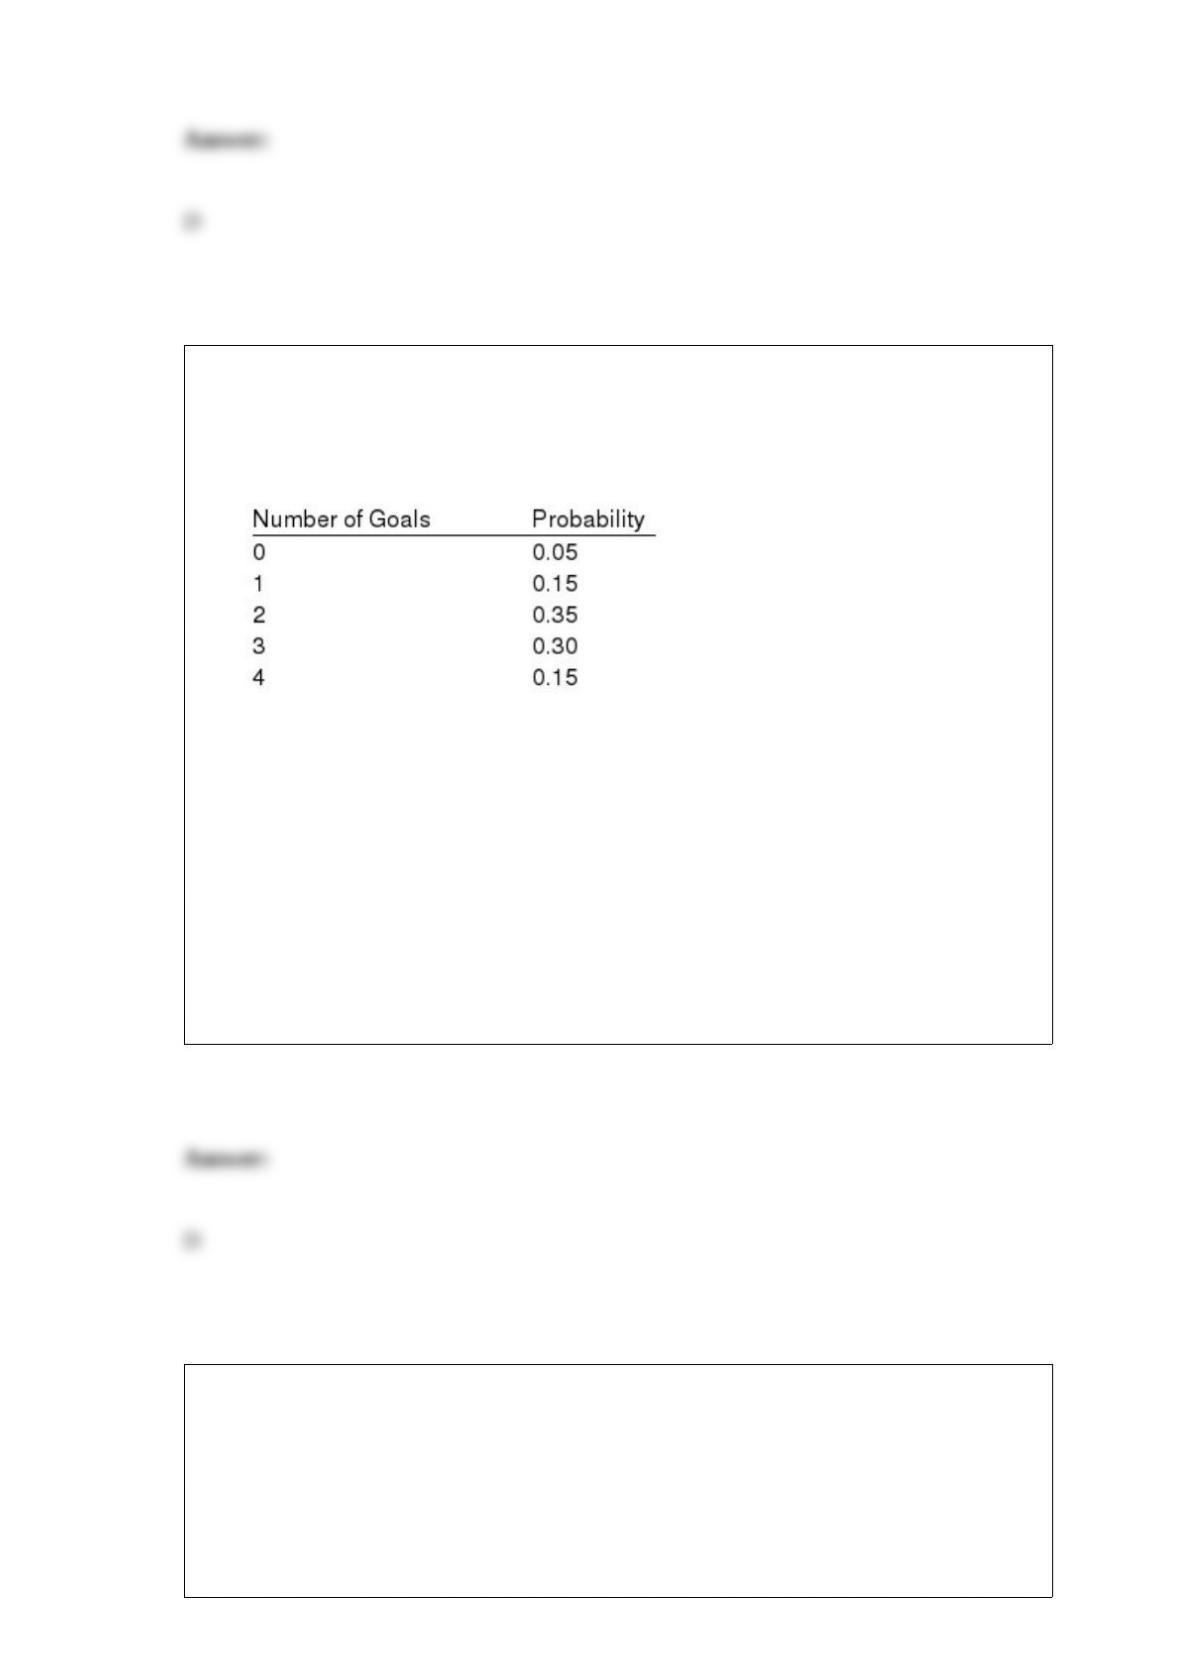
Exhibit 5-3
The probability distribution for the number of goals the Lions soccer team makes per
game is given below.
Refer to Exhibit 5-3. What is the probability that in a given game the Lions will score
no goals?
a. 0.95
b. 0.85
c. 0.75
d. None of the answers is correct.
A random sample of 100 credit sales in a department store showed an average sale of
$120.00. From past data, it is known that the standard deviation of the population is
$40.00.
a. Determine the standard error of the mean.
b. With a 0.95 probability, determine the margin of error.
c. What is the 95% confidence interval of the population mean?
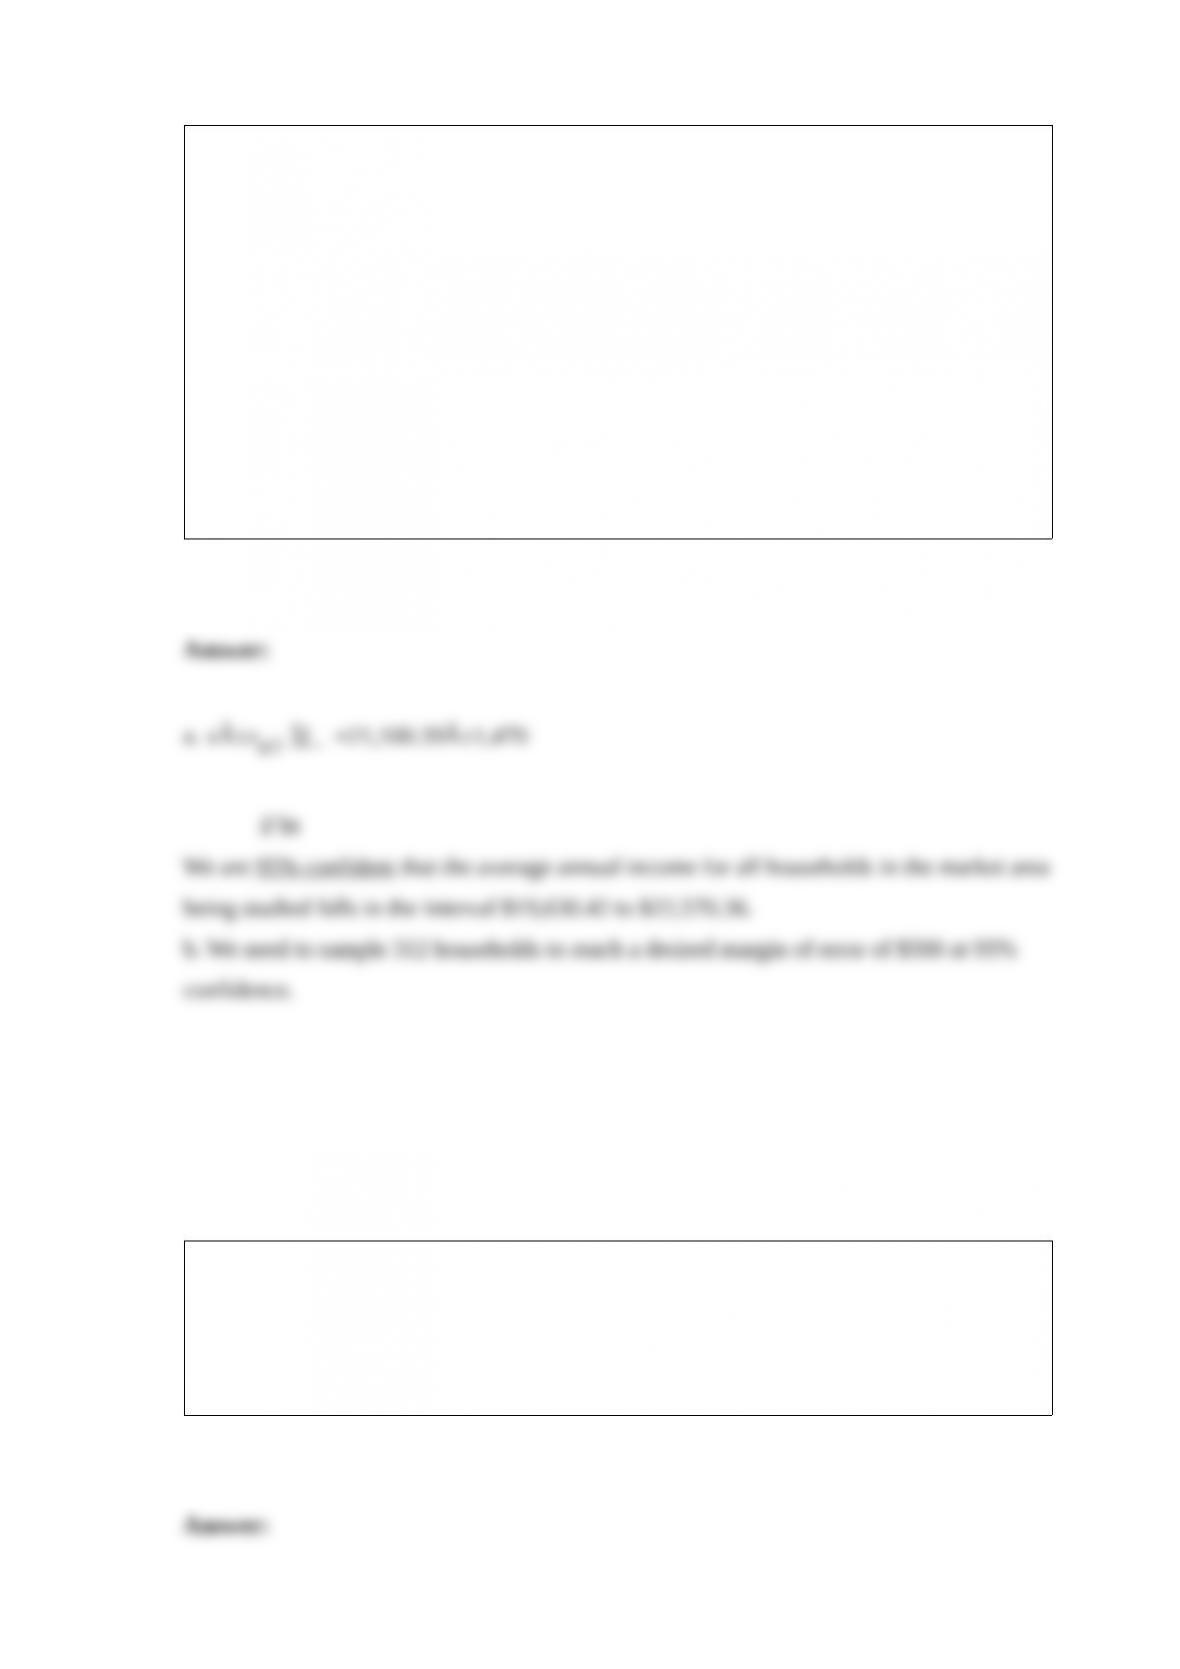
Two independent samples are drawn from two populations, and the following
information is provided.
We want to test the following hypotheses.
a. Determine the degrees of freedom.
b. Compute the test statistic.
c. At 95% confidence, test the hypotheses. Assume the two populations are normally
distributed and have equal variances.
National Discount has 260 retail outlets throughout the United States. National
evaluates each potential location for a new retail outlet in part on the mean annual
income of the households in the marketing area of the new location. National develops
an interval estimate of the mean annual income in a potential marketing area after
taking a random sample of households.
For a marketing area being studied, a sample of 36 households was taken and the
sample mean income was $21,100.39. Based on past experience, National Discount
assumes a known value of
= $4500 for the population income standard deviation.
a. Develop a 95% confidence interval for the mean annual income of households in this
marketing area.
b. Suppose that National’s management team wants a 95% confidence interval estimate
of the population mean with a margin of error of E = $500. How large a sample size is
needed?
The percent frequency of a class is computed by
a. multiplying the relative frequency by 10
b. dividing the relative frequency by 100
c. multiplying the relative frequency by 100
d. adding 100 to the relative frequency
A random sample of 41 scores of students taking the ACT test showed a standard
deviation of 8 points. Provide a 98% confidence interval estimate for the standard
deviation of all the ACT test scores.
From a population of cans of coffee marked “12 ounces,” a sample of 25 cans is
selected and the contents of each can are weighed. The sample revealed a mean of 11.8
ounces and a standard deviation of 0.5 ounces. Test to see if the mean of the population
is at least 12 ounces. (Assume the population is normally distributed.) Use a .05 level of
significance.
A regression analysis (involving 45 observations) relating a dependent variable (y) and
two independent variables resulted in the following information.
= 0.408 + 1.3387x1 + 2x2
The SSE for the above model is 49.
When two other independent variables were added to the model, the following
information was provided.
= 1.2 + 3.0x1 + 12x2 + 4.0x3 + 8x4
This latter model’s SSE is 40.
At a 5% significance level, test to determine if the two added independent variables
contribute significantly to the model.
In order to determine the average price of hotel rooms in Atlanta, a sample of 64 hotels
was selected. It was determined that the average price of the rooms in the sample was
$112. The population standard deviation is known to be $16. Use a 0.05 level of
significance and determine whether or not the average room price is significantly
different from $108.50.
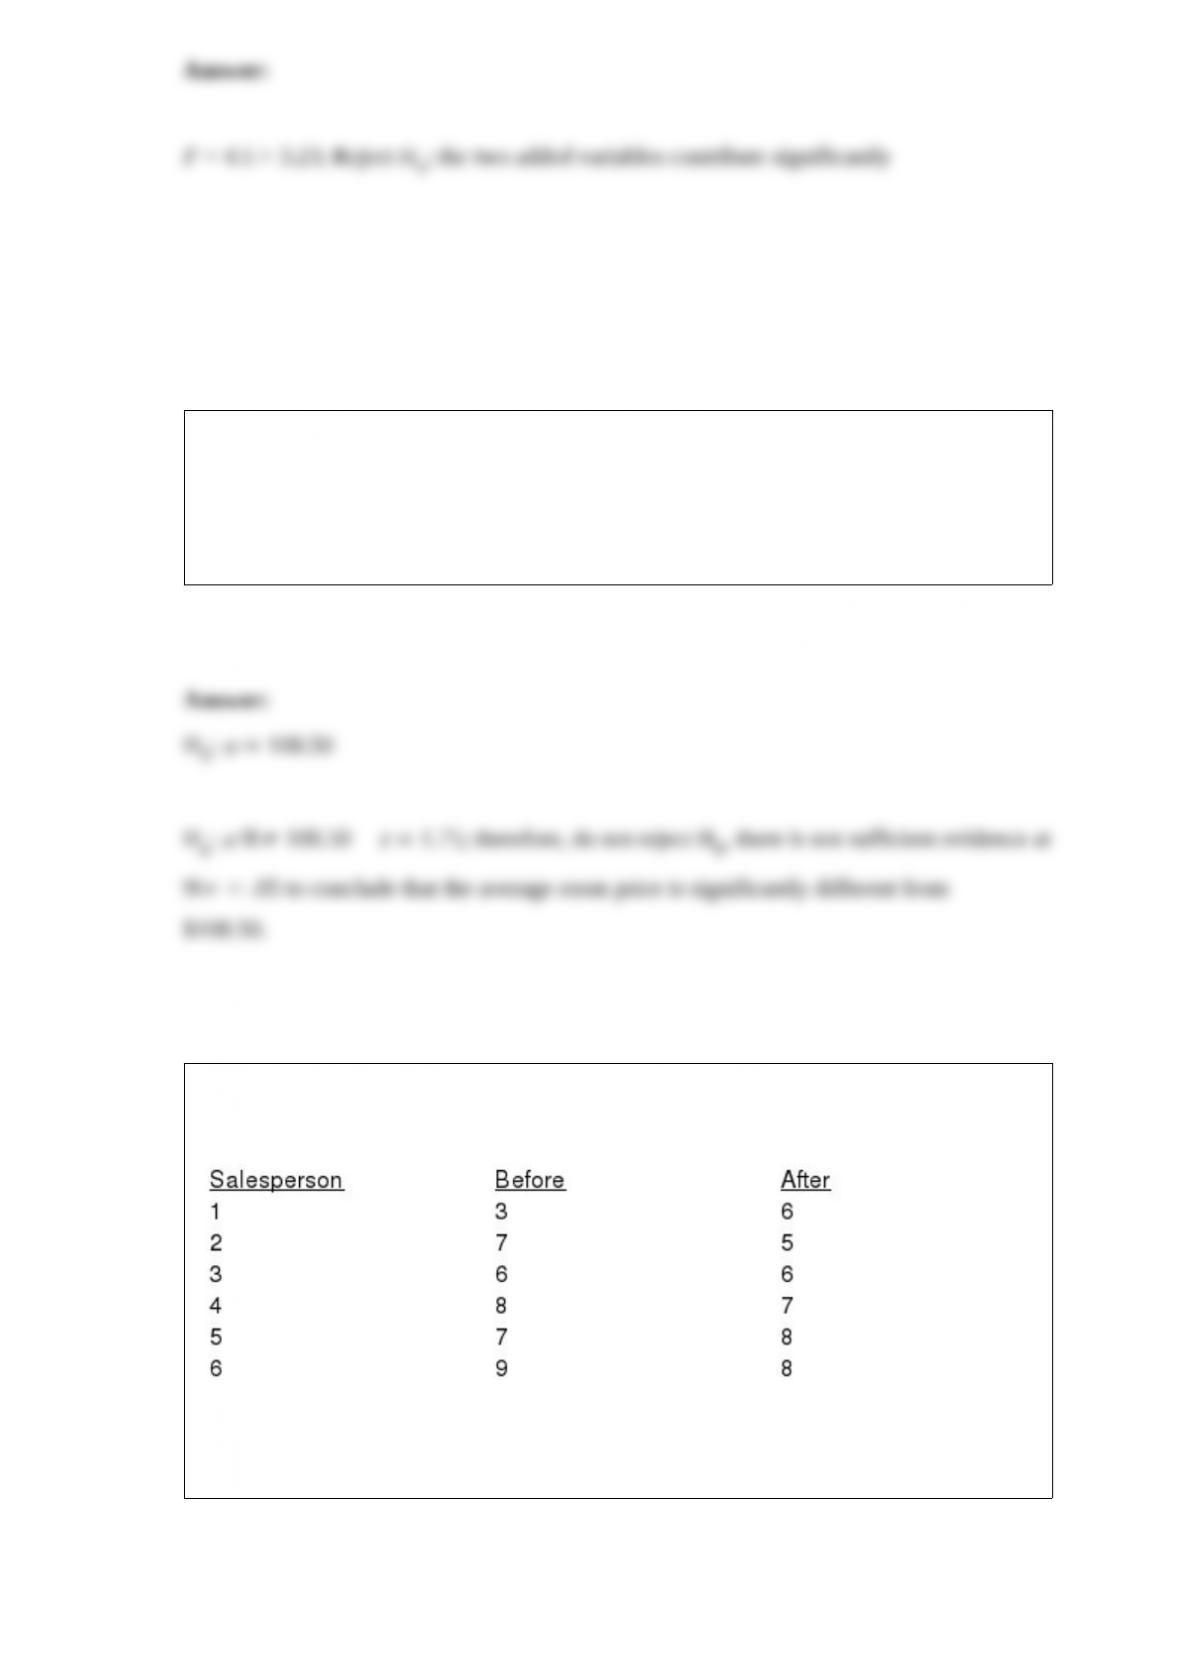
The following data present the number of computer units sold per day by a sample of 6
salespersons before and after a bonus plan was implemented.
At 95% confidence, test to see if the bonus plan was effective. That is, did the bonus
plan actually increase sales?
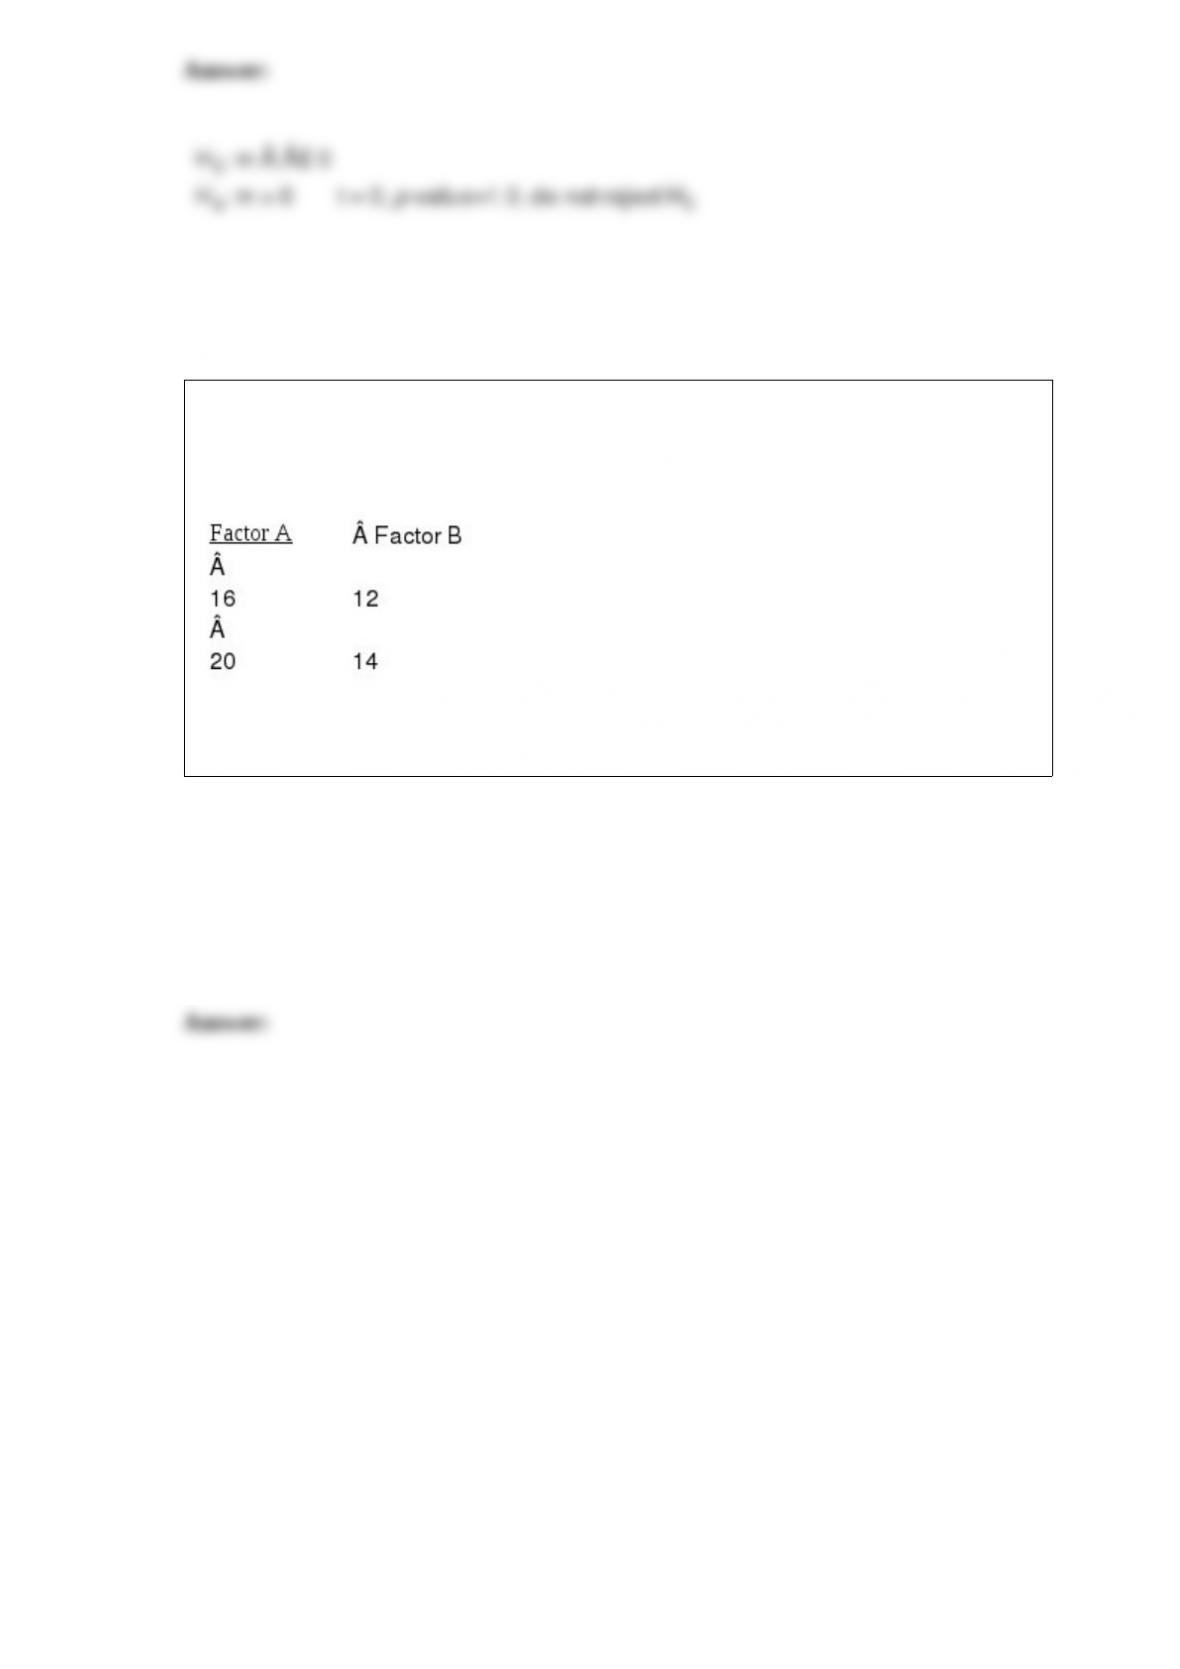
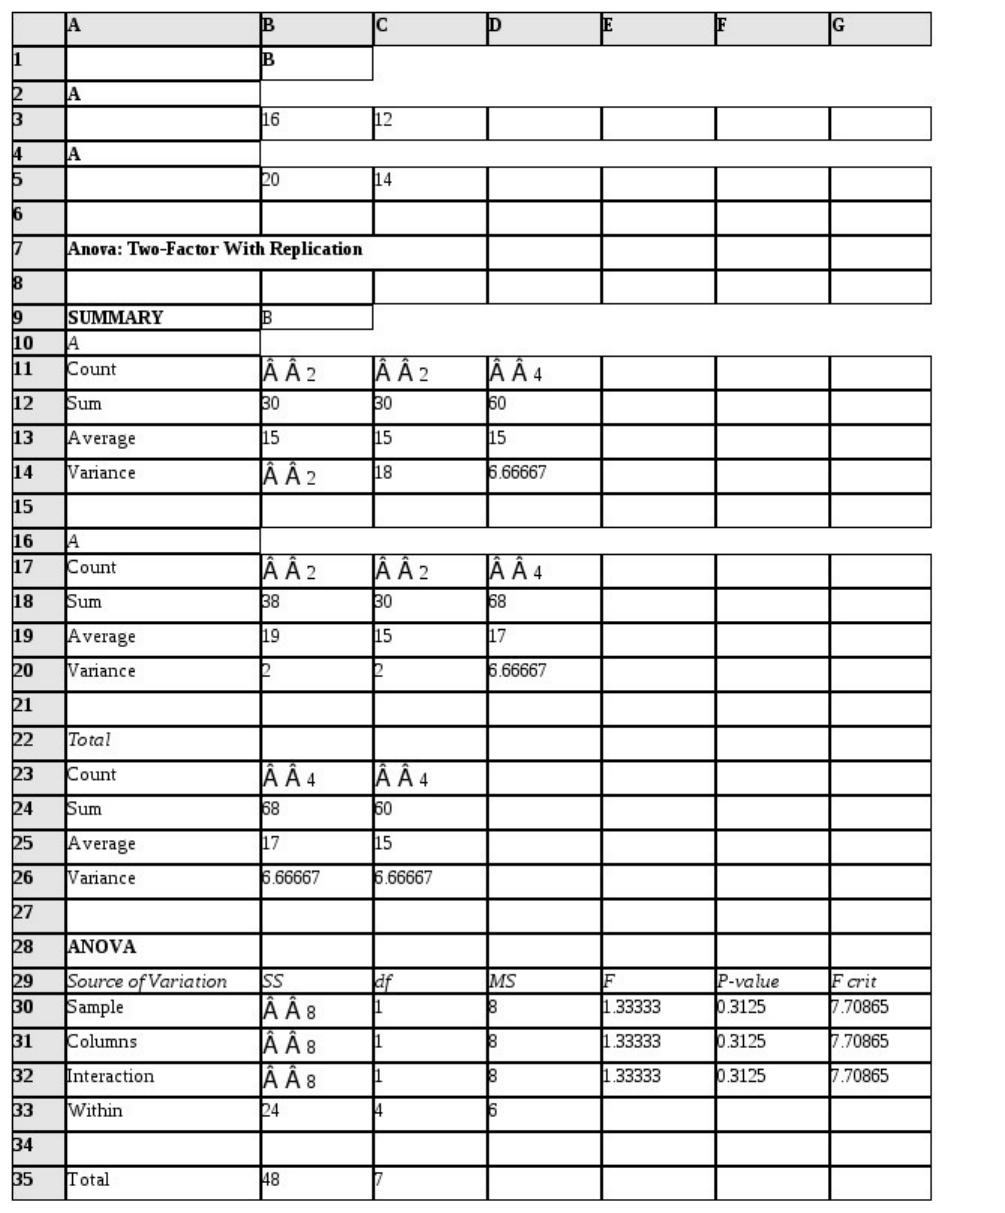
A factorial experiment involving 2 levels of factor A and 2 levels of factor
B resulted in the following.
Use Excel and test for any significant main effect and any interaction
effect. Use = .05.
At a local university, a sample of 49 evening students was selected in order to determine
whether the average age of the evening students is significantly different from 21. The
average age of the students in the sample was 23 years. The population standard
deviation is known to be 3.5 years. Determine whether or not the average age of the
evening students is significantly different from 21. Use a 0.1 level of significance.
The Ambell Company uses batteries from two different manufacturers. Historically,
60% of the batteries are from manufacturer 1, and 90% of these batteries last for over
40 hours. Only 75% of the batteries from manufacturer 2 last for over 40 hours. A
battery in a critical tool fails at 32 hours. What is the probability it was from
manufacturer 2?
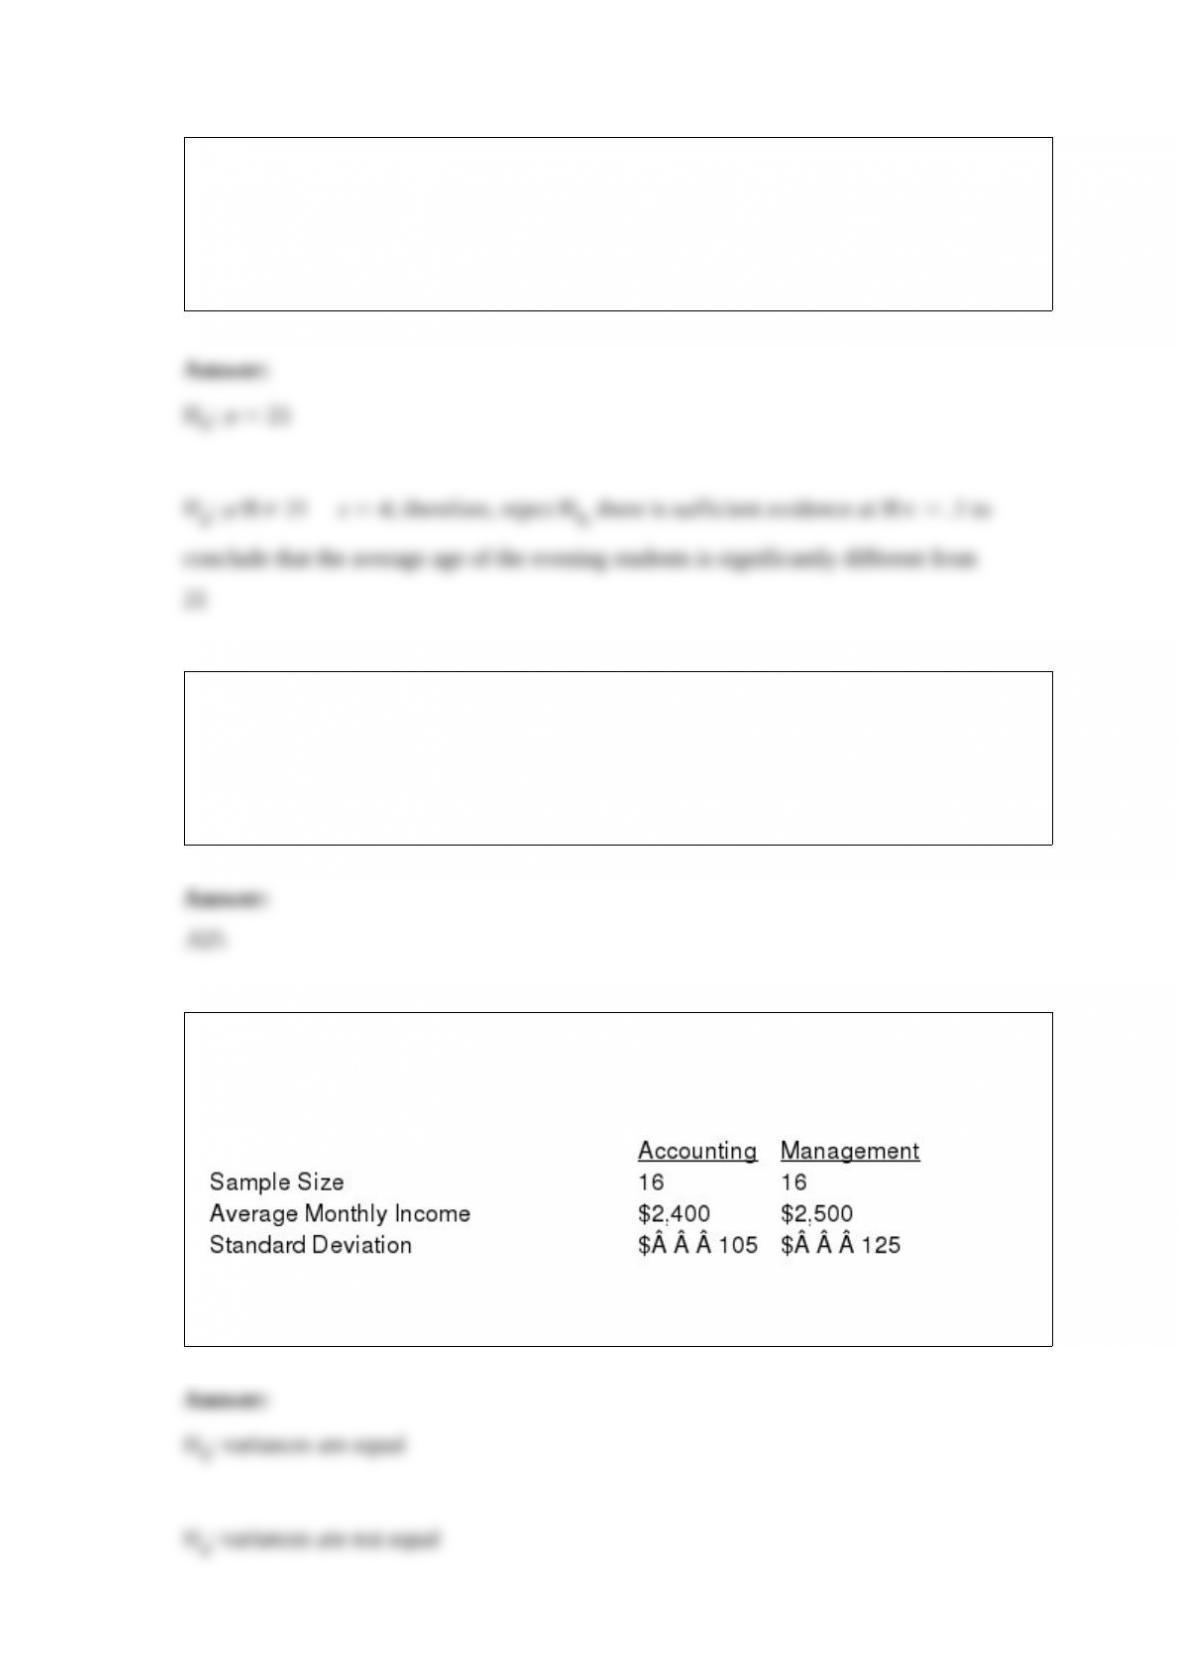
We are interested in determining whether or not the variances of the starting salaries of
accounting majors is significantly different from management majors. The following
information was gathered from two samples:
At a 5% level of significance, test to determine whether or not the variances are equal.
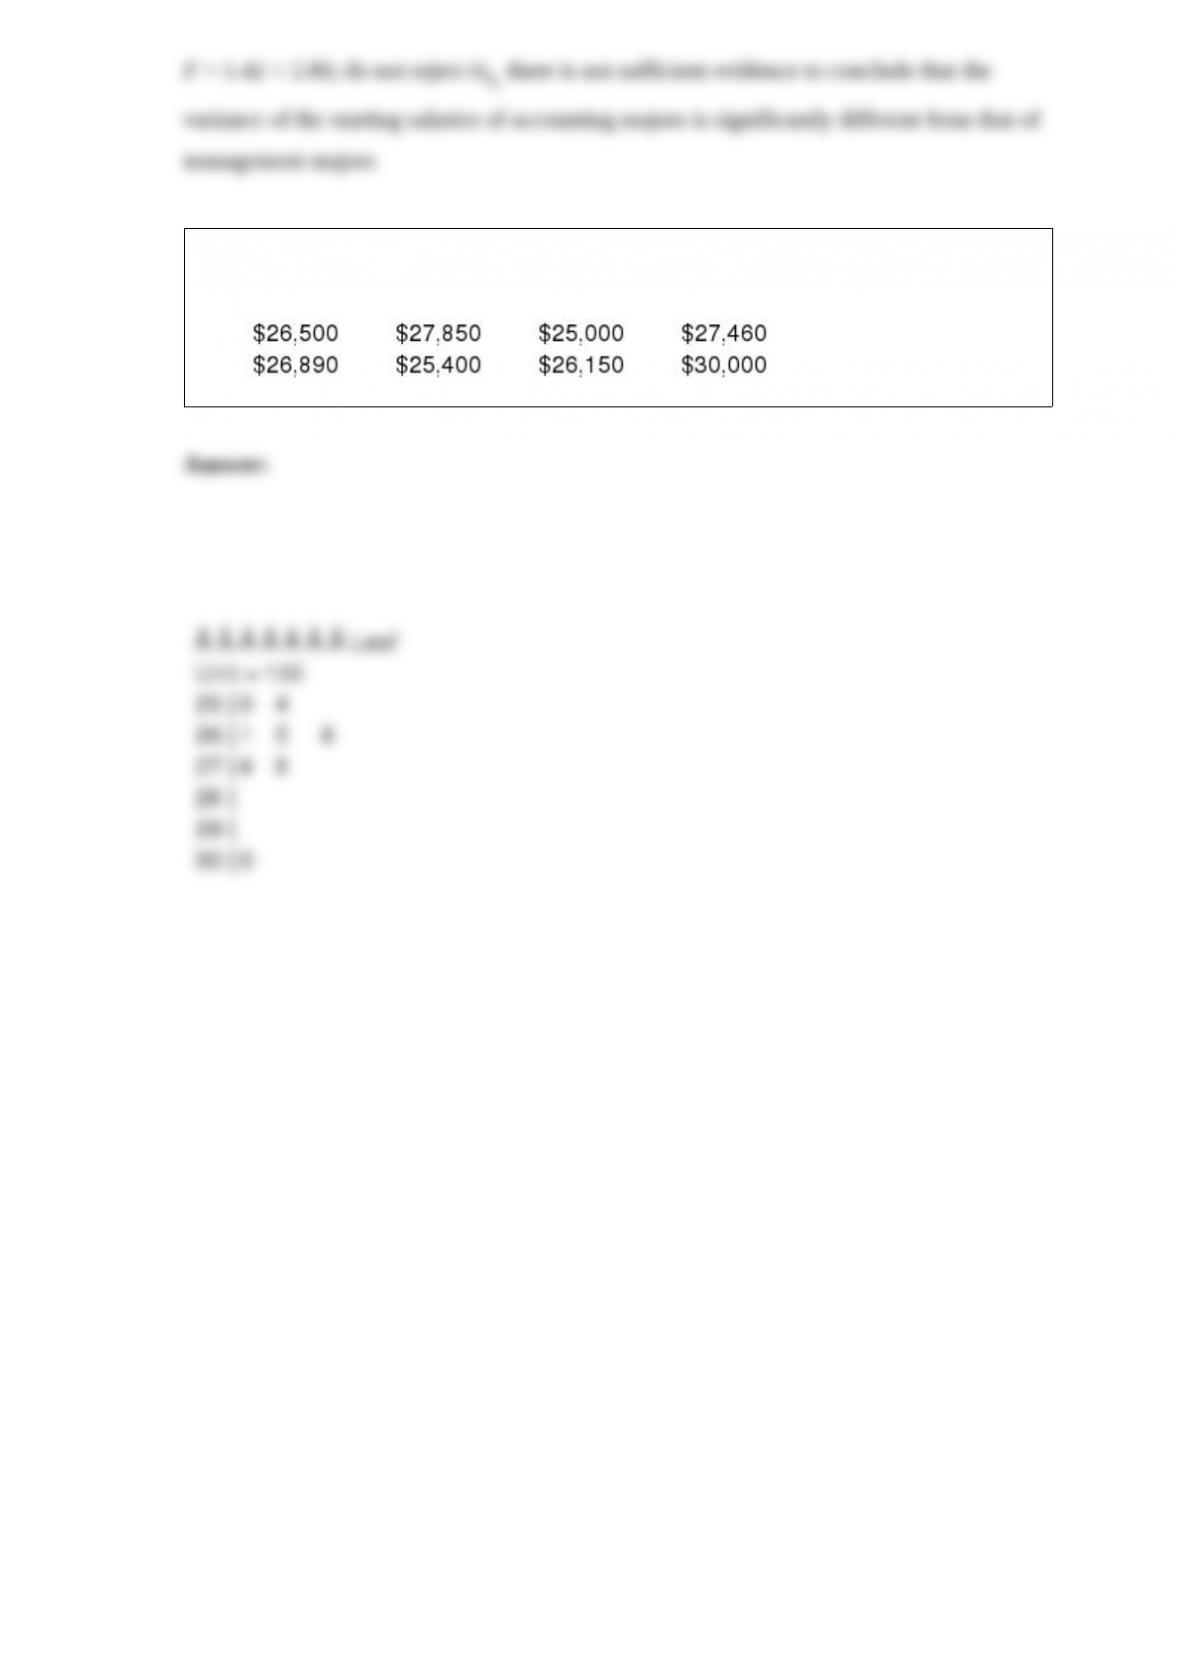
You are given the following data on the annual salaries for eight employees. Construct a
stem-and-leaf display. Specify the leaf unit for the display.