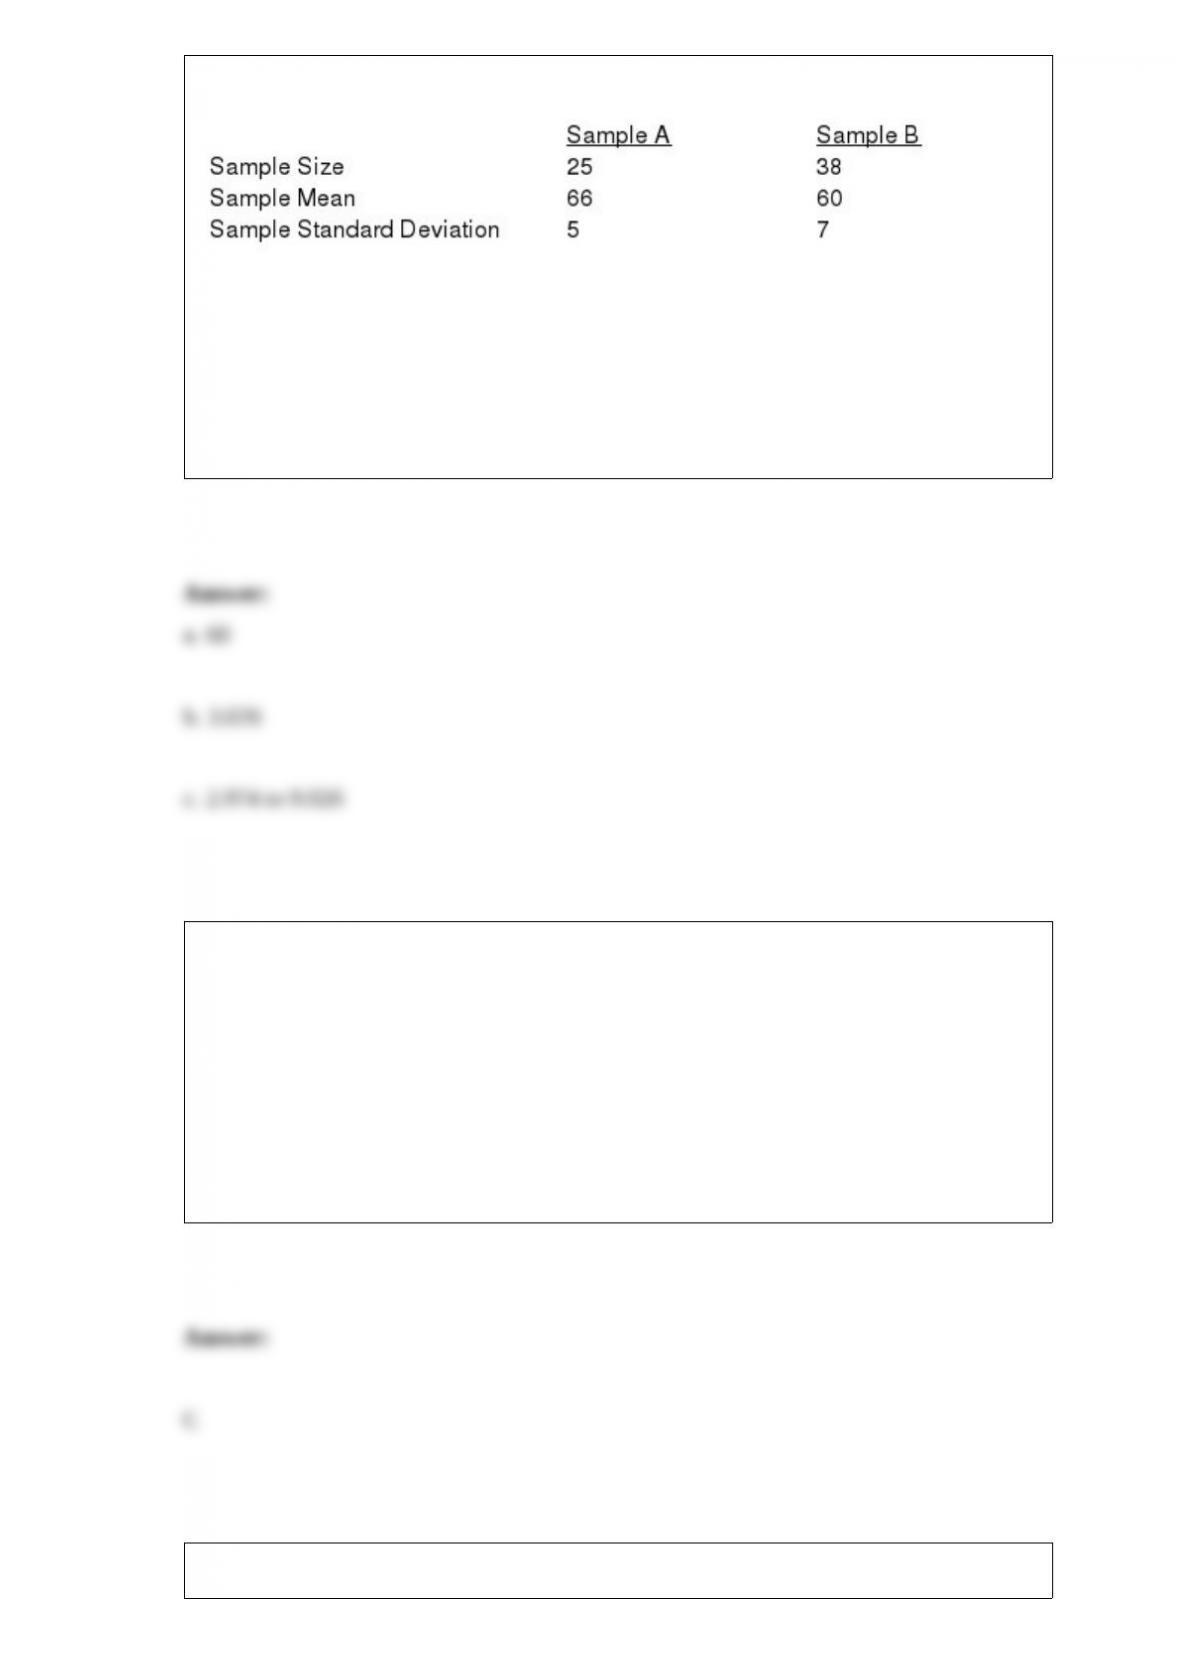
Consider the following results for two samples randomly taken from two populations.
a. What are the degrees of freedom for the t distribution?
b. At 95% confidence, compute the margin of error.
c. Develop a 95% confidence interval for the difference between the two population
means.
As the goodness of fit for the estimated multiple regression equation increases,
a. the value of the adjusted multiple coefficient of determination decreases
b. the value of the regression equation’s constant b0 decreases
c. the value of the multiple coefficient of determination increases
d. the value of the correlation coefficient increases
Exhibit 16-4
In a laboratory experiment, data were gathered on the life span (y in months) of 33 rats,
units of daily protein intake (x1), and whether or not agent x2 (a proposed life extending
agent) was added to the rats diet (x2 = 0 if agent x2 was not added, and x2 = 1 if agent
was added.) From the results of the experiment, the following regression model was
developed.
= 36 + 0.8x1 – 1.7x2
Also provided are SSR = 60 and SST = 180.
Refer to Exhibit 16-4. The life expectancy of a rat that was given 2 units of agent x2
daily, but was not given any protein is
a. 32.6
b. 36
c. 38
d. 34.3
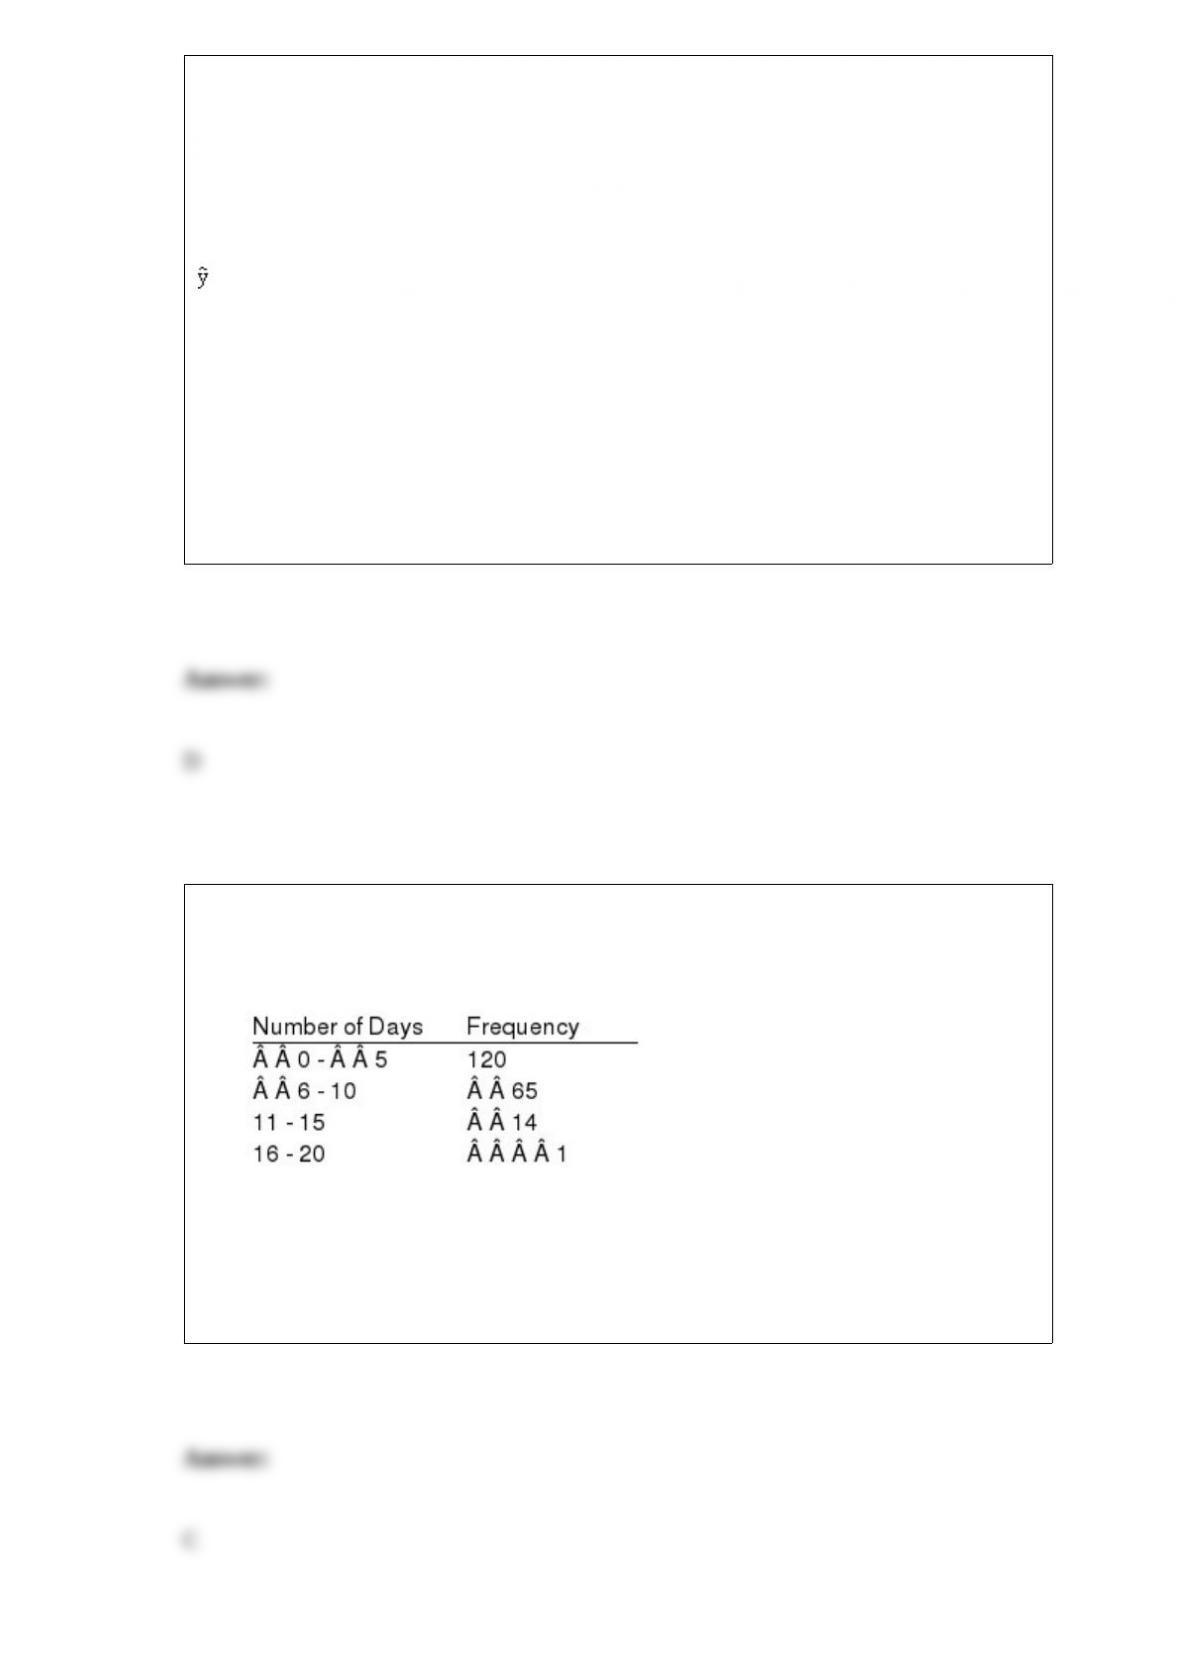
Exhibit 2-3
The number of sick days taken (per month) by 200 factory workers is summarized
below.
Refer to Exhibit 2-3. The number of workers who took less than 11 sick days per month
a. was 15
b. was 200
c. was 185
d. was 65
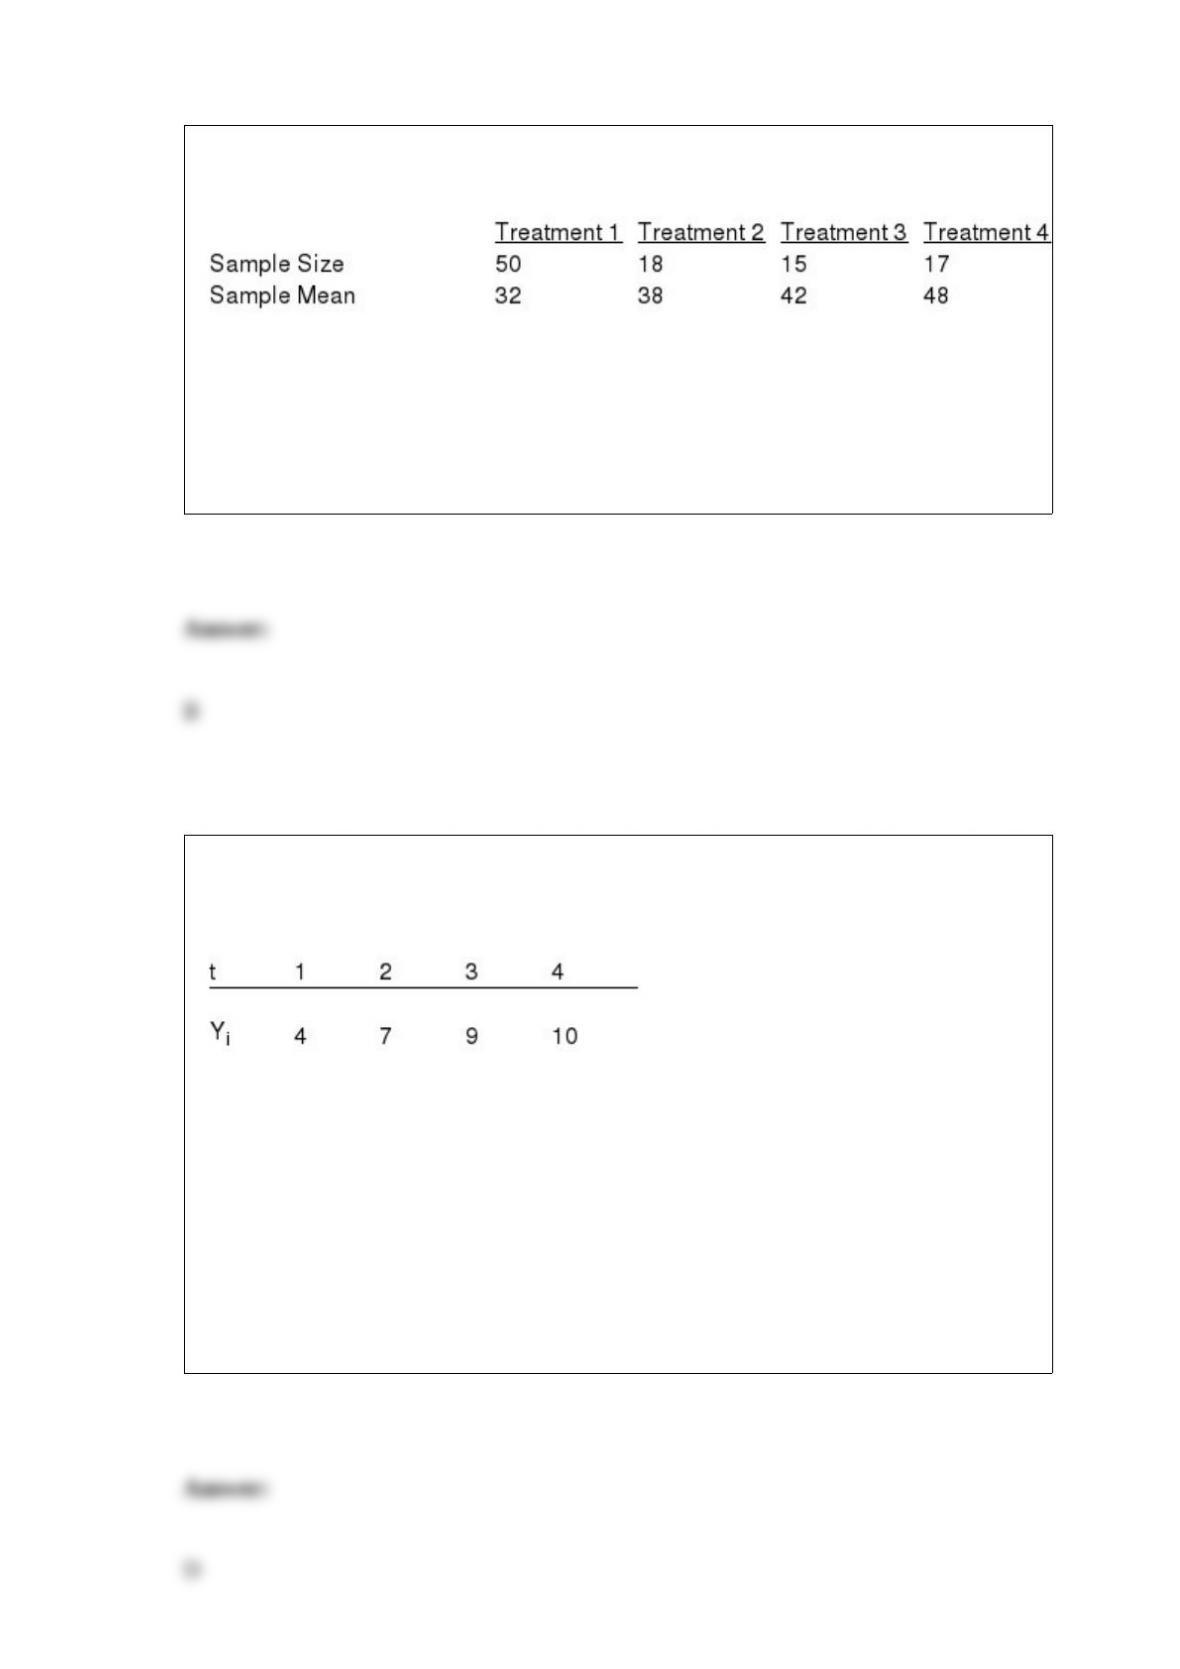
In a completely randomized design involving four treatments, the following information
is provided.
The overall mean (the grand mean) for all treatments is
a. 40.0
b. 37.3
c. 48.0
d. 37.0
e. None of these alternatives is correct.
43. Exhibit 17-2
Consider the following time series.
Refer to Exhibit 17-2. The forecast for period 10 is
a. 10.0
b. 25.0
c. 30.0
d. 22.5

The highest point of a normal curve occurs at
a. one standard deviation to the right of the mean
b. two standard deviations to the right of the mean
c. approximately three standard deviations to the right of the mean
d. the mean
If a data set has an even number of observations, the median
a. cannot be determined
b. is the average value of the two middle items
c. must be equal to the mean
d. is the average value of the two middle items when all items are arranged in ascending
order
The symbol used for the variance of the sample is
a.
b. 2
c. s
d. s2
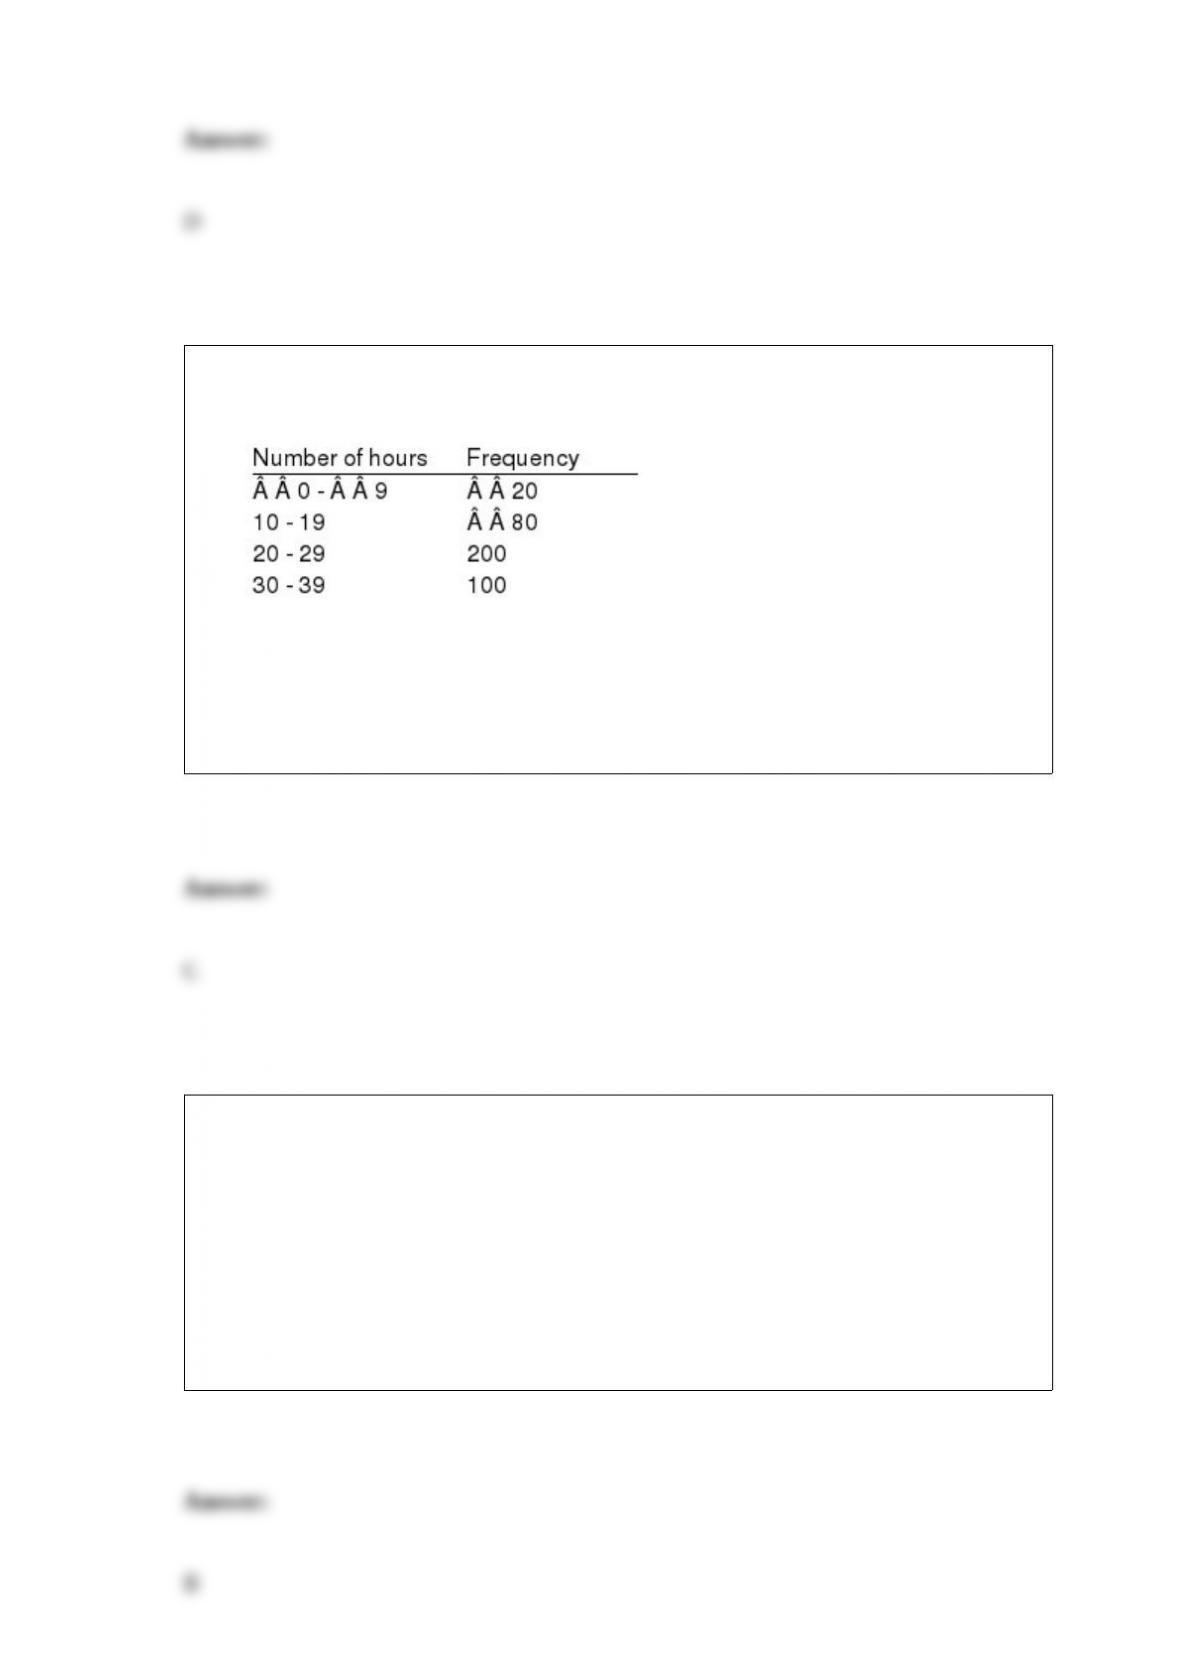
Exhibit 2-1
The numbers of hours worked (per week) by 400 statistics students are shown below.
Refer to Exhibit 2-1. The percentage of students who work at least 10 hours per week is
a. 50%
b. 5%
c. 95%
d. 100%
If P(A) 0.38, P(B) 0.83, and P(A ‡ B) 0.57; then P(A ˆ B)
a. 1.21
b. 0.64
c. 0.78
d. 1.78

Exhibit 10-5
The following information was obtained from matched samples.
Refer to Exhibit 10-5. If the null hypothesis is tested at the 5% level, the null hypothesis
a. should be rejected
b. should not be rejected
c. should be revised
d. None of these alternatives is correct.
The second stage of a two-stage acceptance sampling plan is executed when the
first-stage result is
a. x1 > c1
b. c1 < x1 < c2
c. x1 > c2
d. x1> c1 + c2
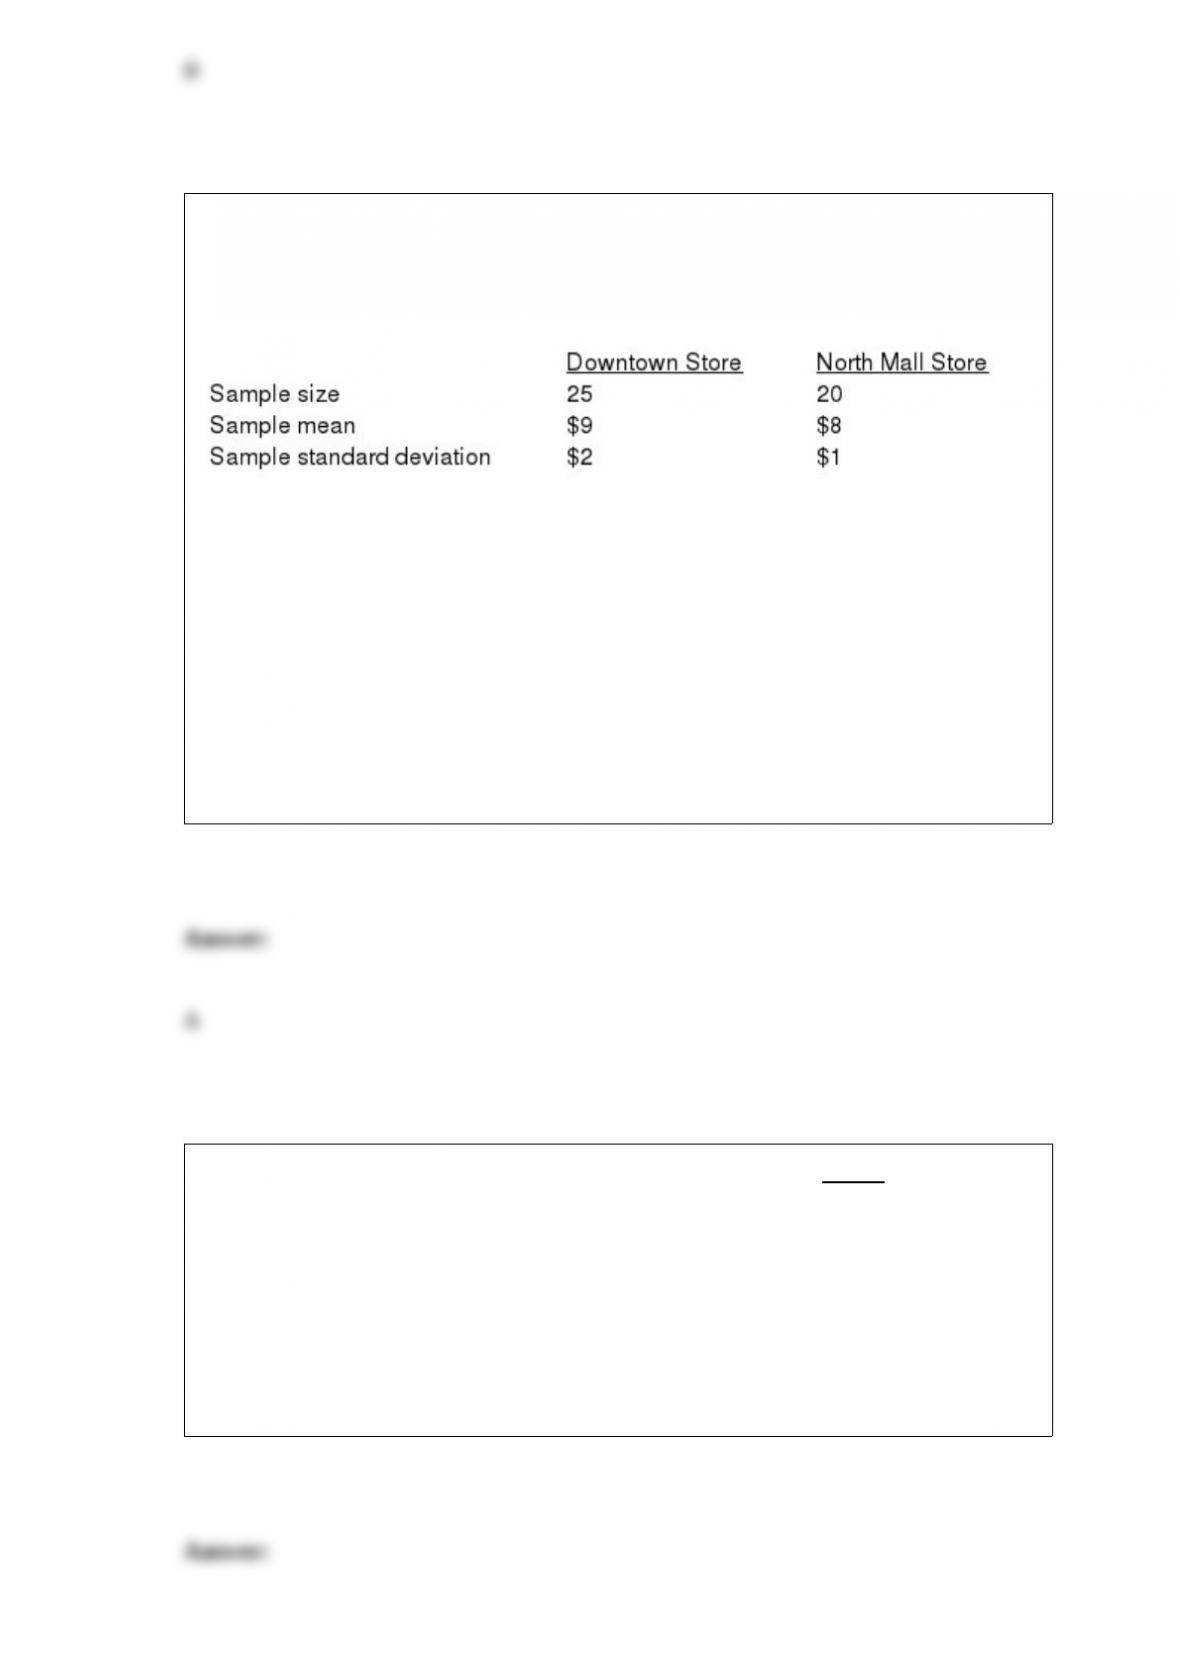
Exhibit 10-7
In order to estimate the difference between the average hourly wages of employees of
two branches of a department store, the following data have been gathered.
Refer to Exhibit 10-7. A point estimate for the difference between the two sample
means is
a. 1
b. 2
c. 3
d. 4
All of the following are true about the standard error of the mean except
a. it is larger than the standard deviation of the population
b. it decreases as the sample size increases
c. its value is influenced by the standard deviation of the population
d. it measures the variability in sample means

A group of observations measured at successive time intervals is known as
a. a trend component
b. a time series
c. a forecast
d. an additive time series model
In the past, 75% of the tourists who visited Chattanooga went to see Rock City. The
management of Rock City recently undertook an extensive promotional campaign.
They are interested in determining whether the promotional campaign actually
increased the proportion of tourists visiting Rock City. The correct set of hypotheses is
a. H0: p > 0.75 Ha: p 0.75
b. H0: p < 0.75 Ha: p 0.75
c. H0: p 0.75 Ha: p < 0.75
d. H0: p 0.75 Ha: p > 0.75
Exhibit 16-2

In a regression model involving 30 observations, the following estimated regression
equation was obtained.
= 170 + 34x1 – 3x2 + 8x3 + 58x4 + 3x5
For this model, SSR = 1,740 and SST = 2,000.
Refer to Exhibit 16-2. The value of SSE is
a. 3,740
b. 170
c. 260
d. 2000
The sum of the relative frequencies for all classes will always equal
a. the sample size
b. the number of classes
c. one
d. 100
The measure of central location most often reported for annual income and property
value data is the
a. median
b. mode
c. weighted mean
d. aggregate mean
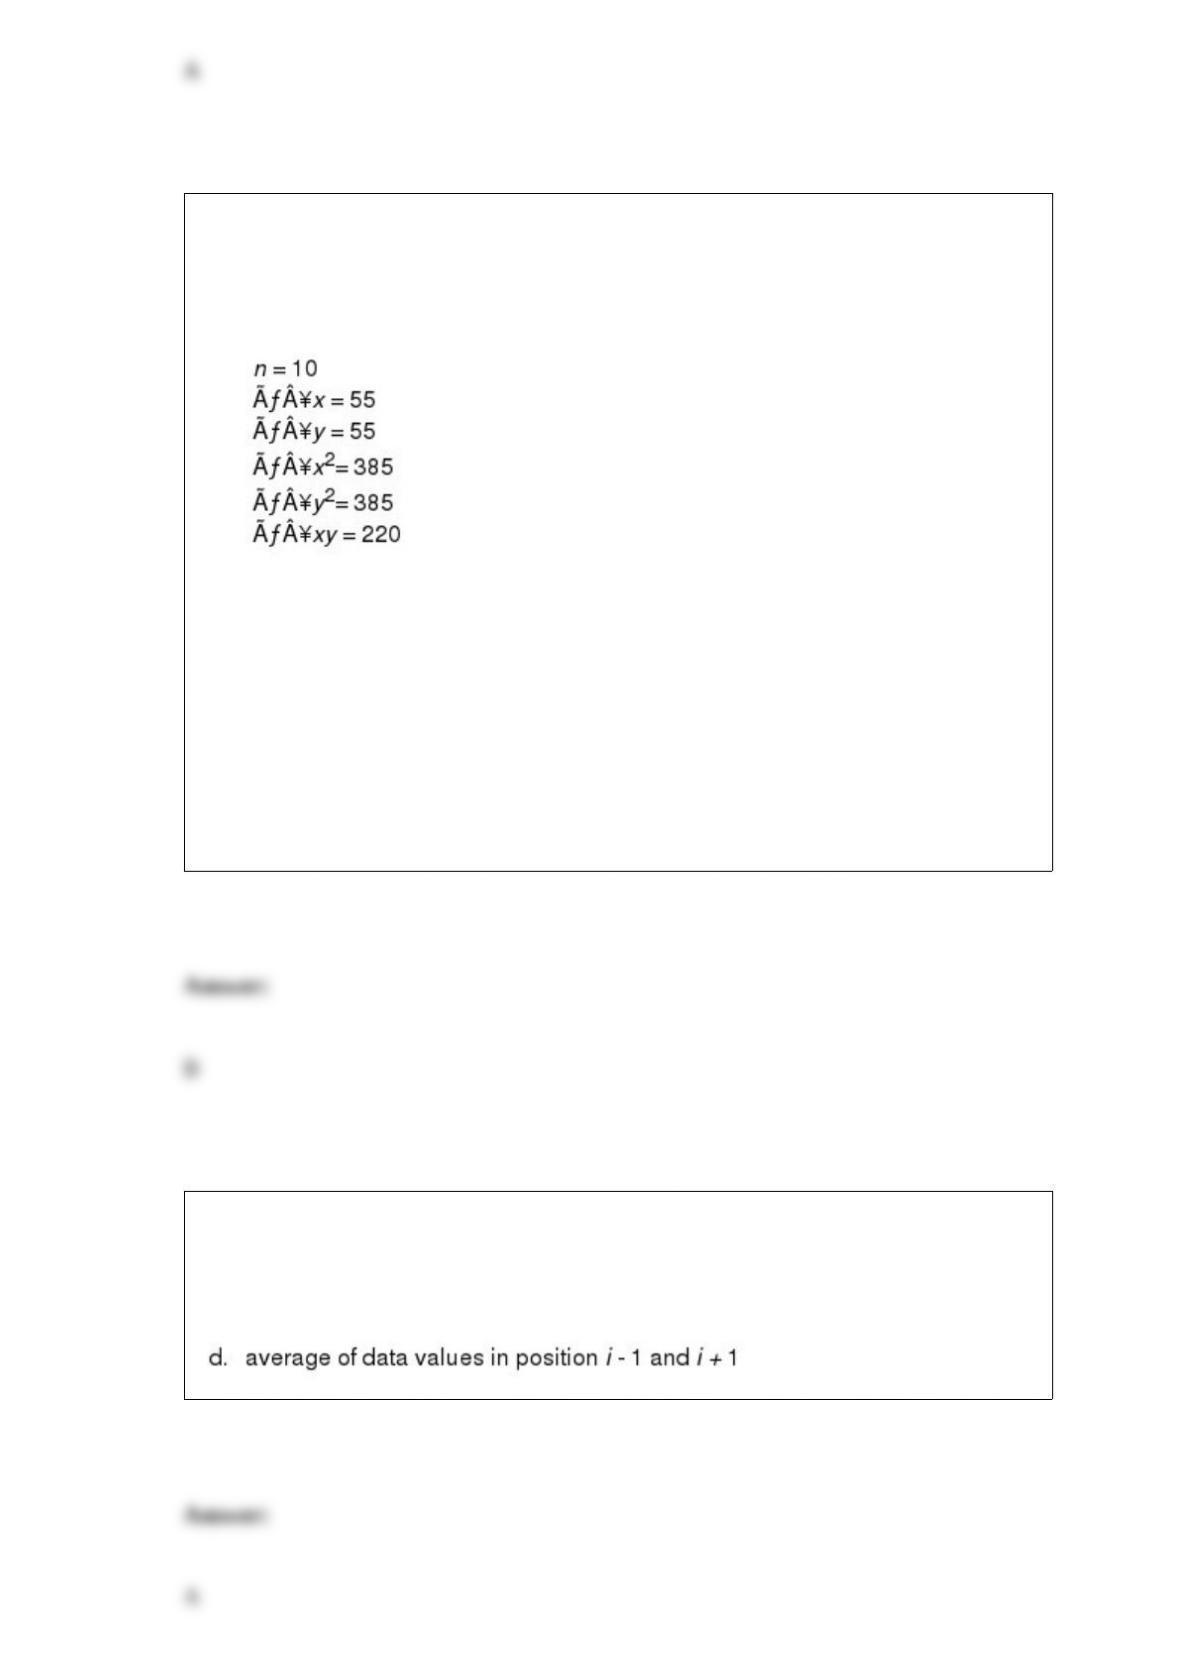
Exhibit 14-1
A regression analysis resulted in the following information regarding a dependent
variable (y) and an independent variable (x).
Refer to Exhibit 14-1. The sample correlation coefficient equals
a. 0
b. -1
c. +1
d. -0.5
In computing the pth percentile, if the index i is an integer the pth percentile is the
a. data value in position i
b. data value in position i + 1
c. average of data values in position i and i + 1

A continuous random variable may assume
a. any value in an interval or collection of intervals
b. only integer values in an interval or collection of intervals
c. only fractional values in an interval or collection of intervals
d. only the positive integer values in an interval
A researcher is gathering data from four geographical areas designated: South 1;
North 2; East 3; West 4. The designated geographical regions represent
a. categorical data
b. quantitative data
c. directional data
d. either quantitative or categorical data